

A splicing isoform of GPR56 mediates microglial synaptic refinement via phosphatidylserine binding
- PMID: 32452062
- PMCID: PMC7429740
- DOI: 10.15252/embj.2019104136
A splicing isoform of GPR56 mediates microglial synaptic refinement via phosphatidylserine binding
Abstract
Developmental synaptic remodeling is important for the formation of precise neural circuitry, and its disruption has been linked to neurodevelopmental disorders such as autism and schizophrenia. Microglia prune synapses, but integration of this synapse pruning with overlapping and concurrent neurodevelopmental processes, remains elusive. Adhesion G protein-coupled receptor ADGRG1/GPR56 controls multiple aspects of brain development in a cell type-specific manner: In neural progenitor cells, GPR56 regulates cortical lamination, whereas in oligodendrocyte progenitor cells, GPR56 controls developmental myelination and myelin repair. Here, we show that microglial GPR56 maintains appropriate synaptic numbers in several brain regions in a time- and circuit-dependent fashion. Phosphatidylserine (PS) on presynaptic elements binds GPR56 in a domain-specific manner, and microglia-specific deletion of Gpr56 leads to increased synapses as a result of reduced microglial engulfment of PS+ presynaptic inputs. Remarkably, a particular alternatively spliced isoform of GPR56 is selectively required for microglia-mediated synaptic pruning. Our present data provide a ligand- and isoform-specific mechanism underlying microglial GPR56-mediated synapse pruning in the context of complex neurodevelopmental processes.
Keywords: GPR56; adhesion GPCR; microglia; phosphatidylserine; synaptic pruning.
© 2020 The Authors.
Conflict of interest statement
The authors declare that they have no conflict of interest.
Figures
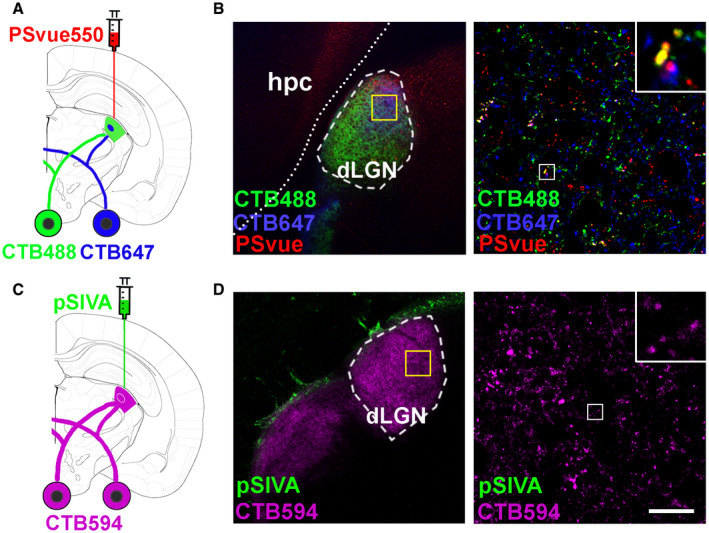
- A
A diagram illustrating PS labeling by PSvue550 and RGC inputs anterograde tracing by CTB. CTB was intraoccularly injected 24 h prior to PSVue/pSIVA injection.
- B
Left panel shows well‐diffused PSVue into dLGN. The yellow box indicates the region where the images were taken. Right panel shows RGC inputs colocalize with PSVue signal. The white box indicates the region of higher magnification image shown.
- C
A diagram showing pSIVA labeling and RGC inputs tracing by CTB.
- D
Left panel shows pSIVA accumulated in the border between hippocampus and LGN. Right panel shows minimal pSIVA colocalized with RGC inputs. Scale bar, 20 μm.
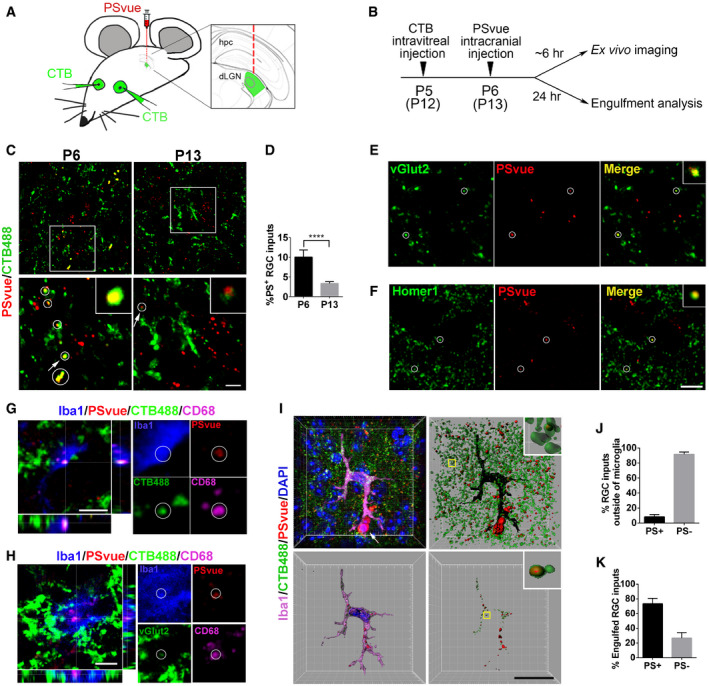
- A
A schematic drawing of experimental procedure where CTB488 is intraocularly injected, followed by intracranial injection of PSvue550 to dLGN border.
- B
A schematic diagram shows the timeline of procedures for ex vivo imaging and engulfment analysis.
- C
Top panel: Representative images show PS labeling in the WT dLGN at P6 and P13. RGC inputs were labeled with CTB488. Bottom panel: Enlarged images of the boxed region in top panels. Circles indicate PS+ RGC inputs. Arrows point to the enlarged PS+ RGC inputs in the insets. Scale bar, 5 μm.
- D
Quantification of the percentage of PS+ RGC inputs in total RGC inputs at P6 and P13. N = 4, ****P < 0.0001. Student's t‐test.
- E
Co‐labeling of vGlut2 and PSVue in the dLGN at P6. Circles indicate colocalized vGlut2 and PSVue.
- F
Co‐labeling of Homer1 and PSVue in the dLGN at P6. Circles indicate colocalized Homer1 and PSVue. Scare bar, 5 μm.
- G
Orthogonal sections showed a triple‐positive PS+/CTB488+/CD68+ RGC inputs inside of microglia. Scare bar, 5 μm.
- H
Orthogonal sections showed a triple‐positive PS+/vGlut2+/CD68+ synapse inside of microglia. Scare bar, 5 μm.
- I
A representative image of microglia (upper‐left) is surface rendered (bottom‐left). The white arrow points to cells which might be apoptotic cells labeled by PSVue. RGC inputs and PSVue outside or inside of microglia are shown in the two right panels. Scare bar, 20 μm.
- J
Quantification of the percentage of PS+ and PS− RGC inputs outside of microglia in total inputs. N = 4.
- K
Quantification of the percentage of engulfed PS+ and PS− RGC inputs in total engulfed inputs. N = 4.
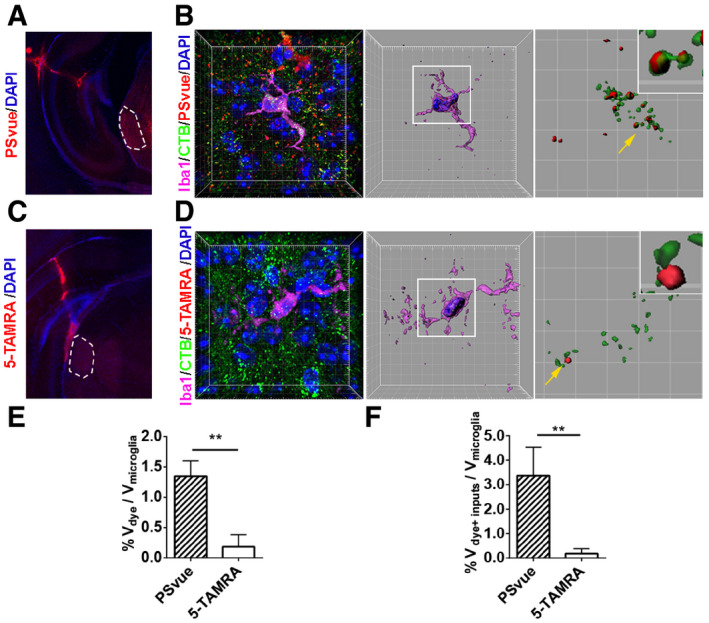
- A
An image shows the PSVue signal after intracranial injection. Dotted areas indicate the dLGN.
- B
A representative image of microglia from PSVue treated dLGN. Nuclei were labeled with DAPI. The mid‐panel shows a 3D surface rendered microglia (purple) with DAPI (blue) and engulfed inputs (green) and PSVue (red). The right panel shows engulfed RGC inputs and PSVue inside of microglia. The magnified insert shows PS+ RGC inputs.
- C
An image shows the 5‐TAMRA signal after injection. Dotted areas indicate the dLGN.
- D
A representative image of microglia from 5‐TAMRA treated dLGN. Very few 5‐TAMRA puncta were observed. The middle panel shows a surface rendered microglia with engulfed inputs (green) and 5‐TAMRA (red). The right panel shows engulfed RGC inputs and 5‐TAMRA. The insert shows RGC inputs do not overlap with 5‐TAMRA.
- E
Quantification of engulfed PSVue and 5‐TAMRA dyes by microglia. N = 4 (PSVue), N = 3 (5‐TAMRA), **P = 0.001.
- F
Quantification of engulfed PSVue‐positive or 5‐TAMRA‐positive RGC inputs by microglia. N = 4 (PSVue), N = 3 (5‐TAMRA), **P = 0.006.
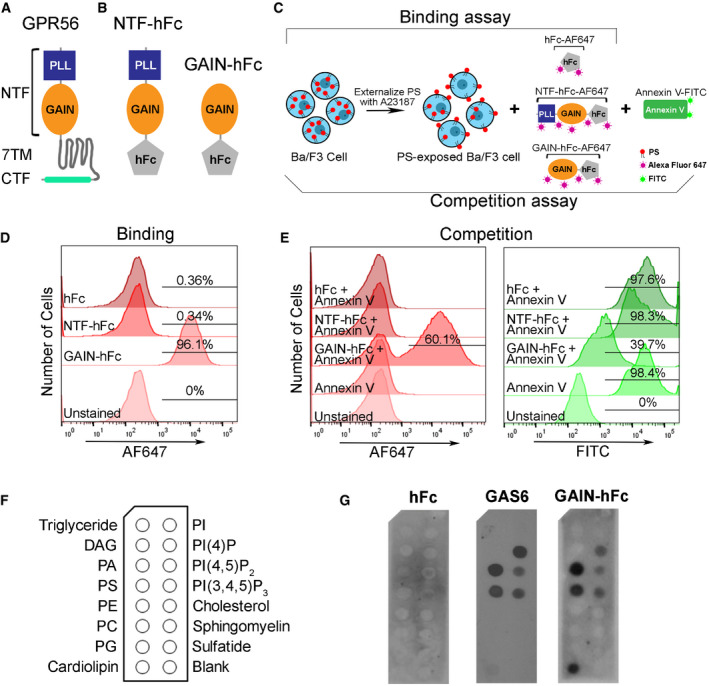
- A
A schematic drawing of GPR56 protein structure, with a N‐terminal fragment (NTF), a seven‐transmembrane domain (7‐TM) and a C‐terminal fragment (CTF).
- B
A diagram shows the hFc tag was added to the c‐terminal of GPR56‐NTF (NTF‐hFC) or GAIN domain (GAIN‐hFc).
- C
A flowchart showing the experimental design of flow cytometry analysis. Briefly, Ba/F3 cells are treated with A23187 to externalize PS. For the binding assay, Alexa Fluor 647‐conjugated hFc, GAIN‐hFc, or NTF‐hFc were incubated with PS‐externalized Ba/F3 cells. For the competition assay, Alexa Fluor 647‐conjugated hFc, GAIN‐hFc, or NTF‐hFc were used to compete with FITC‐conjugated Annexin V binding.
- D
The binding experiment using flow cytometry show that only the GAIN domain binds to PS, similar as Annexin V binding.
- E
In the competition experiment, AF647 channel shows that GAIN domain binds 60.1% of the PS+ Ba/F3 cells (left). Correspondingly, FITC channel reveals 39.7% Annexin V binding to PS+ Ba/F3 cells (right).
- F
A diagram of membrane lipid strips spotted with fifteen different lipids. DAG, diacylglycerol; PA, phosphatidic acid; PE, phosphatidylethanolamine; PC, phosphatidylcholine; PG, phosphatidylglycerol; PI, phosphatidylinositol.
- G
Direct binding of hFc‐tagged GPR56 GAIN proteins to PS and other phospholipids. HFc was used as a negative control, and GAS6 as a positive control.
- A
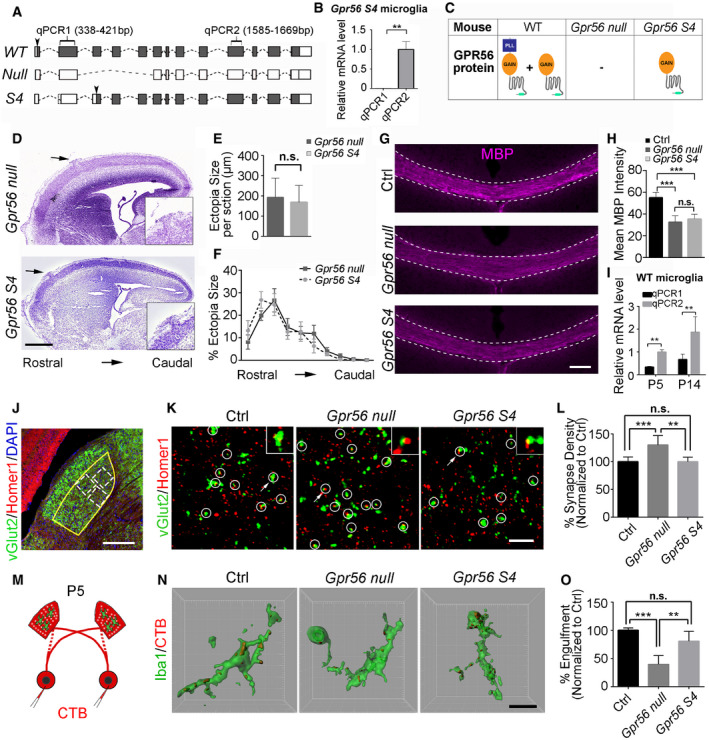
A diagram showing Gpr56 WT, null, and S4 transcripts. Solid boxes indicating exons that are transcribed. Arrowheads indicate the translation start sites.
- B
Gpr56 transcript levels in isolated microglia from Gpr56 S4 mice. N = 3, **P < 0.01 by Student's t‐test.
- C
A table showing the expression status of Gpr56 WT and S4 variants in microglia of different transgenic mice.
- D
Representative images of Nissl staining of Gpr56 null and Gpr56 S4 E16.5 neocortex. Arrows indicate cortical ectopias that are shown in insets.
- E
Quantification of ectopia size per section. N = 6, P = 0.64 by Student's t‐test.
- F
The distribution of ectopia from rostral to caudal cortex. N = 3, F (9, 81) = 0.65, P = 0.75 by two‐way ANOVA with Bonferroni's post hoc test.
- G
Myelin basic protein (MBP) staining of corpus callosum in P28 controls, Gpr56 null and Gpr56 S4 mice. Scale bar, 100 μm.
- H
Quantification of MBP intensity in corpus callosum. N = 5, ***P < 0.001 by one‐way ANOVA with Tukey's post hoc test.
- I
Gpr56 transcript levels in WT microglia at P5 and P14. N = 4, **P < 0.01, two‐way ANOVA with Sidak's multiple comparisons test.
- J
An overview of vGlut2 and Homer1 staining in dLGN at P10. The yellow outline indicates the dLGN core, and the dotted boxes show where synapses are quantified. Scale bar, 200 μm.
- K
Representative images of vGlut2/Homer1 staining in the dLGN of control, Gpr56 null, and Gpr56 S4 brains at P10. Arrows pointing to the enlarged synapse in the insets. Scale bar, 5 μm.
- L
Relative vGlut2/Homer1 synapse density in dLGN. N = 10 (Ctrl), N = 6 (Gpr56 null), N = 3 (Gpr56 S4). **P < 0.01, ***P < 0.001, one‐way ANOVA with Tukey's post hoc test.
- M
A schematic representation of the in vivo engulfment assay. CTB are injected into both eyes at P4, and anterogradely trace RGC projections to the dLGN. After 24 h, the brains are collected and analyzed at P5.
- N
Representative images and surface rendered microglia (green) in which CTB+(red) RGC inputs were engulfed. Scale bar, 10μm.
- O
Quantification of the percentage of engulfed RGC inputs in controls, Gpr56 null and Gpr56 S4 microglia. N = 4, **P < 0.01, ***P < 0.001, one‐way ANOVA with Tukey's post hoc test.
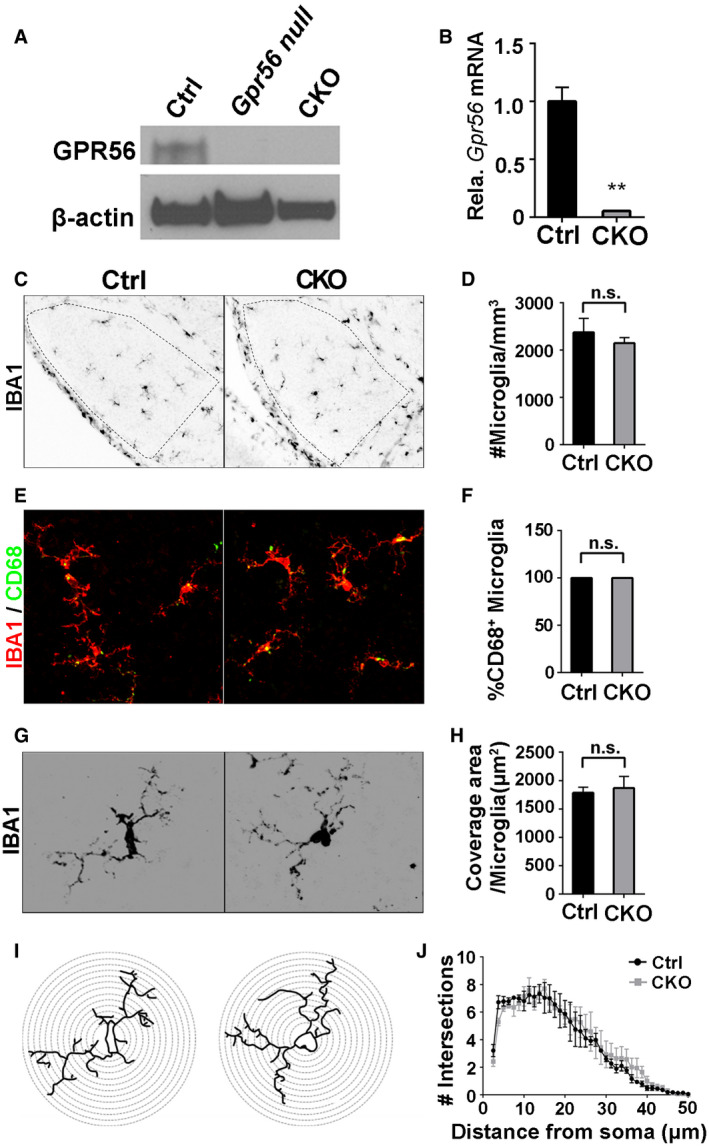
- A
Western blot shows GPR56 protein was detected in the isolated microglia from control mice, but not in the microglia from Gpr56 null or CKO mice.
- B
QPCR detects a high level of Gpr56 transcripts in control microglia, compared to CKO microglia. N = 3, **P < 0.01 by Student's t‐test.
- C
Images of microglia stained by anti‐Iba1 in dLGN at P5.
- D
Quantification of microglial density between CKO and controls. N = 3 (Ctrl), N = 4 (CKO), P = 0.462, Student's t‐test.
- E
Representative images of Iba1 and CD68 double staining.
- F
Quantification of the percentage of CD68‐positive microglia. 100% microglia are CD68‐positive in both CKO and controls. N = 3.
- G
Images of individual microglia, using Iba1 immunostaining to visualize its morphology.
- H
Quantification of coverage area of each microglia between CKO and controls. N = 35 (Ctrl), N = 22 (CKO) microglia from 3, 4 mice, respectively. P = 0.685, Student's t‐test.
- I
Images depicting concentric circles upon manually outlined microglia at 1.25 μm intervals for Sholl analysis.
- J
Sholl analysis shows no significant change in arbor complexity in CKO. N = 3, F (1, 156) = 0.88, P = 0.35 by two‐way ANOVA with Bonferroni's post hoc test.
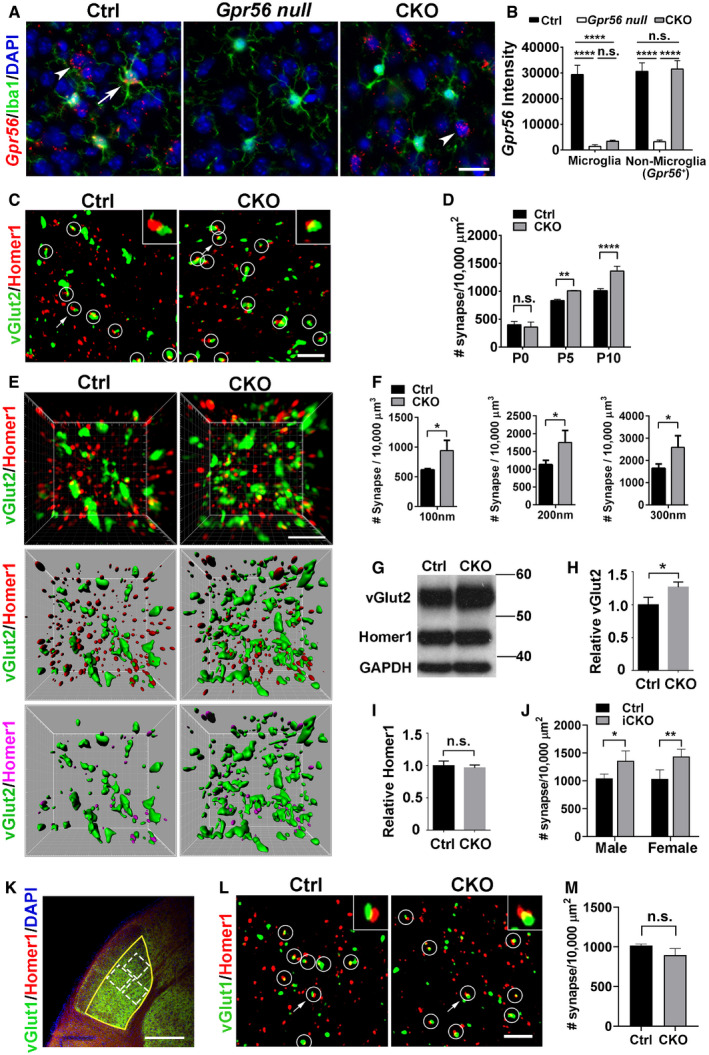
- A
Gpr56 is deleted in CKO microglia. RNAscope shows Gpr56 transcripts colocalize with microglia (arrow) in controls, but not in CKO, and is absent in all cell types in the global Gpr56 KO (Gpr56 null). Arrowhead indicates non‐microglia cells expressing Gpr56. RNAscope was performed in the prefrontal cortex of P30 mice. Scale bar, 20 μm.
- B
Quantification of Gpr56 fluorescence signals in (A). N = 20–50 cells for each.
- C
Confocal images of vGlut2 (green) labeling retinal ganglion cell (RGC) presynaptic terminals and Homer1 (red) for postsynapses in the dLGN of CKO and controls at P10. Overlapped vGlut2 and Homer1 are quantified as synapses, indicated by white circles. Arrows pointing to the synapse enlarged in the upper right‐hand inset. Scale bar, 5 μm.
- D
A time course of dLGN synapse density (vGlut2+/Homer1+) between WT and controls. N = 3 for P0, N = 4 for P5, N = 3 for P10.
- E
Representative super‐resolution images and 3D‐reconstructed images of vGlut2 and Homer1 staining of P8 dLGN. Green objects represent surface rendering of vGlut2+ presynaptic terminals. Red spots are rendered Homer1+ postsynapses. Magenta spots represent Homer1+ postsynapses within a distance of 300 nm from the nearest vGlut2+ surface. Scale bar, 2 μm.
- F
Quantification of Homer1+ spots adjacent to vGlut2 surface within 100 nm, 200 nm, and 300 nm, respectively. N = 3.
- G
Western blot of vGlut2 and Homer1 using microdissected dLGN tissue from P8 mice.
- H, I
Quantification of vGlut2 and Homer1 expression in CKOs and controls. N = 3, *P = 0.027.
- J
Quantification of synapse density (vGlut2+/Homer1+) in the dLGN of both male and female iCKO mice at P10. N = 3 for male, N = 4 for female.
- K
An overview of vGlut1 and Homer1 staining in dLGN at P10. The yellow outline indicates the dLGN core, and the dotted boxes show where synapses are quantified. Scale bar, 200 μm.
- L
Representative images of vGlut1+ (green) presynaptic terminals and Homer1+ (red) postsynapses in the dLGN of CKO and controls at P10. Arrows pointing to the synapse enlarged in inset. Scale bar, 5 μm.
- M
Quantification of synapse density (vGlut1/Homer1) at P10 in the dLGN of CKO mice and controls. N = 3 (WT), N = 5 (CKO), P = 0.053.
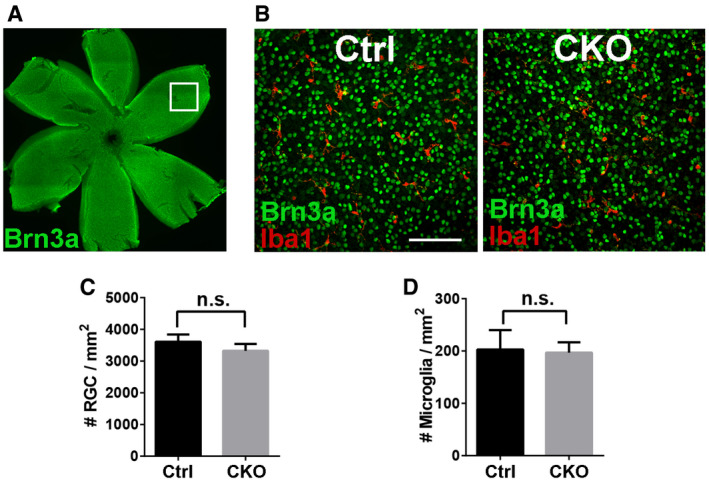
- A
Whole‐mount retinal staining of RGC using Brn3a antibody. The box indicates an example of imaging area in the peripheral retina.
- B
Representative images of RGC and microglia staining using Brn3a and Iba1 antibodies in retina. Scale bar, 100 μm.
- C
Quantification of RGC density in controls and CKO. N = 3, P = 0.187.
- D
Quantification of retinal microglia density in controls and CKO. N = 3, P = 0.810.
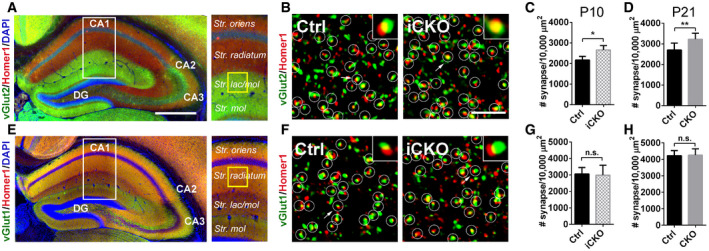
- A
Representative images show hippocampal vGlut2 and Homer1 immunostaining. White box outlines the region of interest and yellow box shows the regions where confocal images were taken. Scale bar, 500 μm.
- B
Confocal images of synaptic immunostaining in CA1 striatum lacunosum‐moleculare (str. lac/mol) at P10. Arrows pointing to the enlarged synapse in the insets. Scale bar, 5 μm.
- C, D
Quantification of synapse density in CA1 str. lac/mol in iCKO versus control at P10 (C), and CKO versus control at P21 (D). At P10, N(Ctrl) = 4, N(iCKO) = 3, P = 0.02. At P21, N = 8, P = 0.005.
- E
Representative images show hippocampal vGlut1 and Homer1 immunostaining.
- F
Confocal images of synaptic immunostaining in CA1 striatum radiatum at P10.
- G, H
Quantification of synapse density in CA1 striatum radiatum in iCKO versus control at P10 (G), and CKO versus control at P21 (H). At P10, N = 5, P = 0.83. At P21, N = 5, P = 0.89.
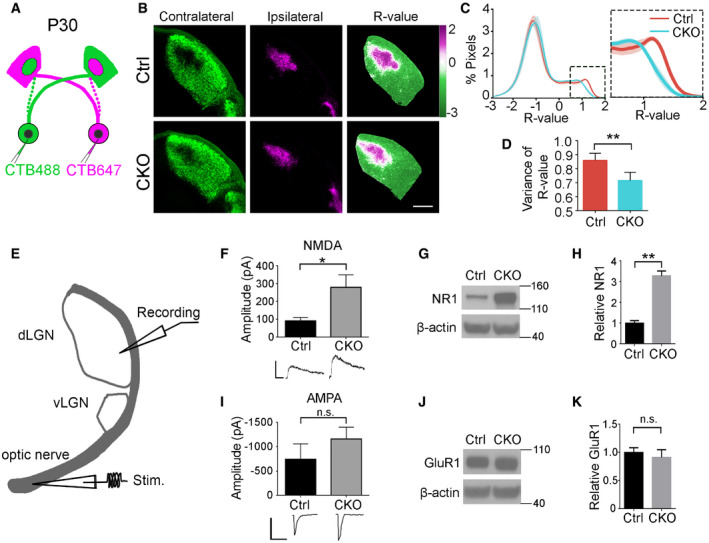
- A
A diagram of eye‐specific segregation assay at P30.
- B
CTB‐labeled dLGN shows reduced eye segregation at P30 in CKO mice. The left column shows contralateral dLGN labeled with CTB488 (green), and the middle one is ipsilateral dLGN with CTB647 (magenta). The right column represents the dLGN pseudocolored according to the R‐value for each pixel (R = log(Fipsi/Fcontra)). Scale bar, 200 μm.
- C
A histogram distribution chart of R‐value for all pixels within dLGN represents the degree of eye‐specific segregation. When R is 0, it means equal ipsilateral and contralateral fluorescence intensity at a pixel. A greater R‐value means a bigger difference of ipsi‐ to contraleteral fluorescence intensity. The narrower distribution of CKO in the inset indicates reduced segregation.
- D
The variance of R distributions in P30 control and CKO mice. N = 4 (Ctrl), N = 6 (CKO), P = 0.004, mean ± SD.
- E
A schematic diagram of electrophysiological recording in a parasagittal dLGN.
- F
Maximal NMDAR‐mediated currents measured in the dLGN of P28–P34 mice, P = 0.03, N = 14 (Ctrl), 23 (CKO) cells from 5, 7 mice, respectively. Mean ± SEM.
- G
Western blot of NMDAR1 (NR1) using microdissected dLGN tissue from P30 mice.
- H
Quantification of NMDAR1 expression in CKO mice and control. N = 3, P = 0.007, mean ± SD.
- I
Maximal AMPAR‐mediated currents measured in the dLGN of P28–P34 mice. P = 0.302, N = 13 (Ctrl), 17 (CKO) cells from 5, 7 mice, respectively. Mean ± SEM.
- J
Western blot of GluR1 with microdissected P30 dLGN tissue.
- K
Quantification of GluR1 expression in CKO mice and controls. N = 3, P = 0.40, mean ± SD.
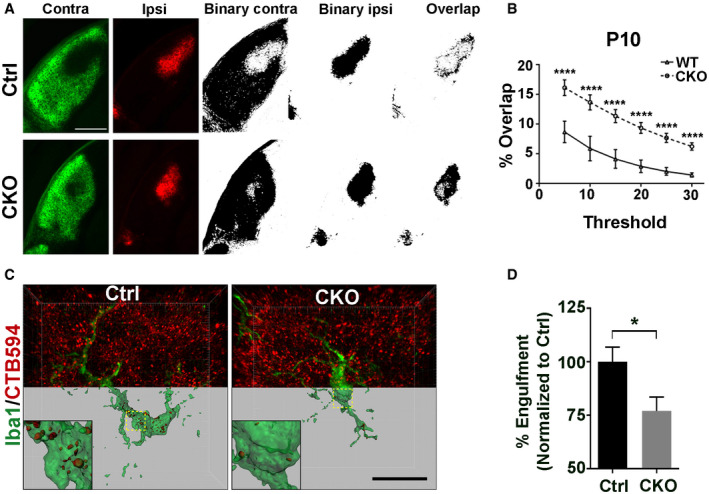
- A
The left two columns show contra‐ and ipsilateral RGC inputs labeled by CTB488 and CTB594, respectively. The middle two columns are binary images of contra‐ and ipsilateral LGN. The right images show an overlap between contralateral RGC inputs and ipsilateral inputs. Scale bar, 250 μm.
- B
Quantification of the percentage of overlapped contra‐ and ipsilateral RGC inputs on multiple thresholds in CKO and controls at P10. N = 4, ****P < 0.0001, two‐way ANOVA with Bonferroni's post hoc test.
- C
Representative images and surface rendered microglia (green) from P5 dLGN of CKO or controls in which RGC inputs were labeled with CTB‐594 (red). Scale bar, 20 μm.
- D
Quantification of the percentage of engulfed RGC inputs in controls and CKO microglia. More than 10 microglial cells are analyzed in each individual mouse brain. N = 4, *P = 0.039.
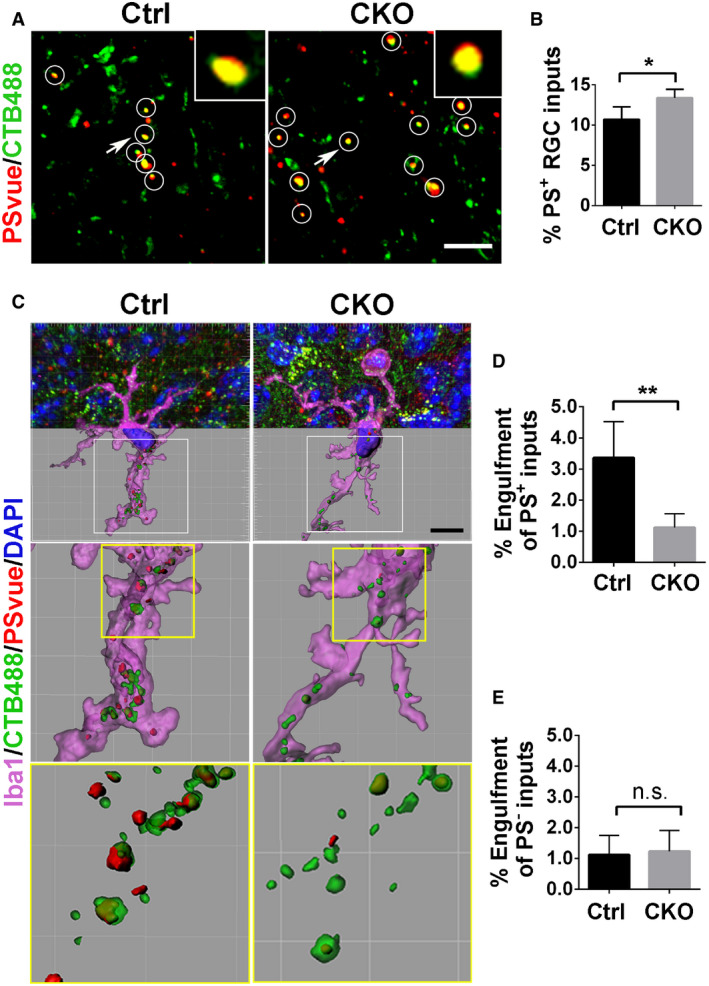
- A
Colocalized RGC inputs and PSVue signals in P6 control and CKO. White circles indicate PS+ RGC inputs. Arrows pointing to the RGC inputs enlarged in the insets. Scale bar, 5 μm.
- B
The percentage of PS+ RGC inputs in total inputs in CKO and controls. N = 5, *P = 0.02.
- C
Representative images of engulfed PS+ and PS− RGC inputs by microglia in control and CKO. Scale bar, 10 μm.
- D
Quantification of engulfed PS+ RGC inputs by microglia, which is calculated as follows: Volume of engulfed PS+ RGC inputs/Volume of microglia cell.
- E
Quantification of engulfed PS− RGC inputs in control and CKO.
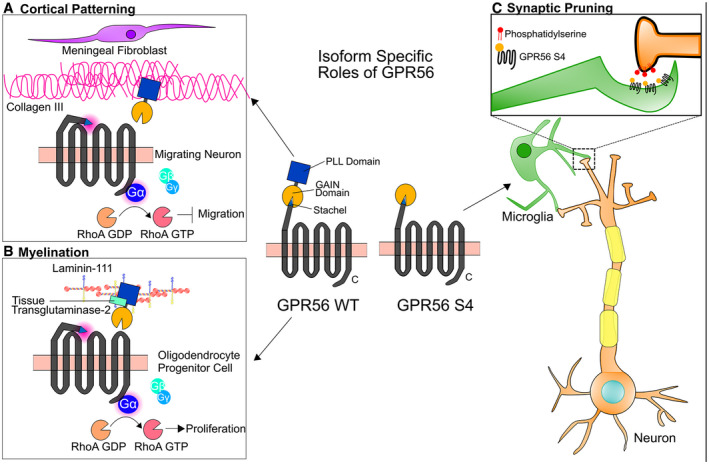
- A
WT GPR56 participates in cortical patterning during brain development. Collagen III, secreted by meningeal fibroblasts, activates GPR56 by binding to its PLL domain and sends a stop signal to migrating neurons once they reached to the pial basement membrane (Luo et al, 2011).
- B
In oligodendrocyte progenitor cells (OPCs), WT GPR56 binds to microglia‐secreted tissue transglutaminase‐2 (TG2) in the presence of laminin‐111 to promote OPC proliferation (Giera et al, 2015, 2018).
- C
In microglia, GPR56 S4 binds to externalized PS, which services as an “eat‐me” signal for those synapses needed to be removed, and mediates the engulfment of synapses by microglia.
Comment in
-
Please eat (only part) of me: synaptic phosphatidylserine cues microglia to feast: Two new studies identify how a common apoptotic cell flag is used to sculpt neural circuits.EMBO J. 2020 Aug 17;39(16):e105924. doi: 10.15252/embj.2020105924. Epub 2020 Jul 23. EMBO J. 2020. PMID: 32705698 Free PMC article.
References
-
- Bevers EM, Williamson PL (2016) Getting to the outer leaflet: physiology of phosphatidylserine exposure at the plasma membrane. Physiol Rev 96: 605–645 - PubMed
Publication types
MeSH terms
Substances
Grants and funding
LinkOut - more resources
Full Text Sources
Molecular Biology Databases
Research Materials
