

Genomic prediction of maize microphenotypes provides insights for optimizing selection and mining diversity
- PMID: 32452105
- PMCID: PMC7680549
- DOI: 10.1111/pbi.13420
Genomic prediction of maize microphenotypes provides insights for optimizing selection and mining diversity
Abstract
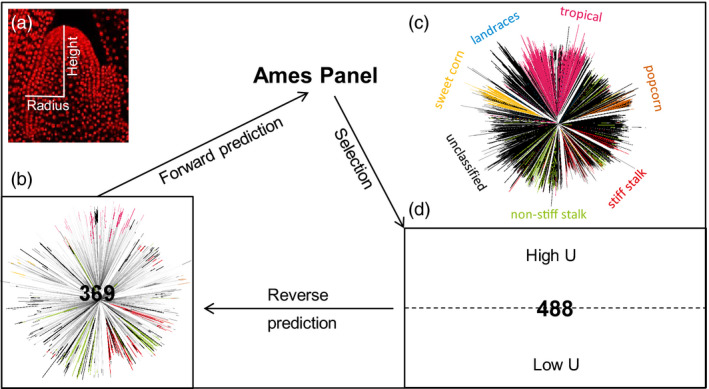
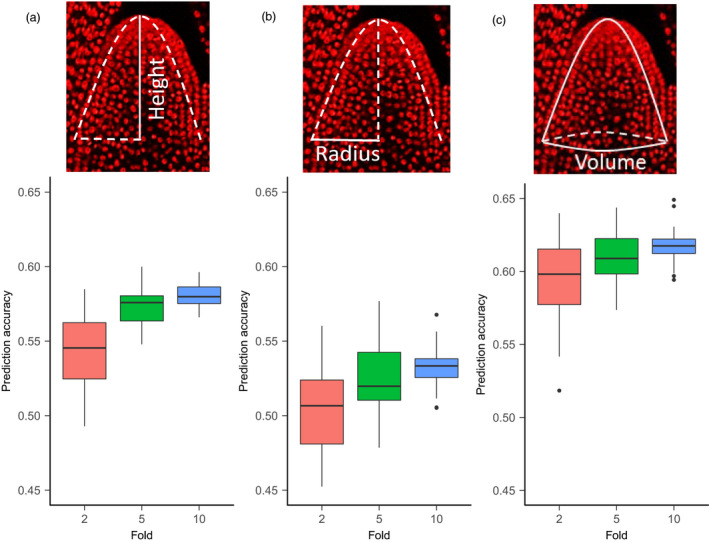
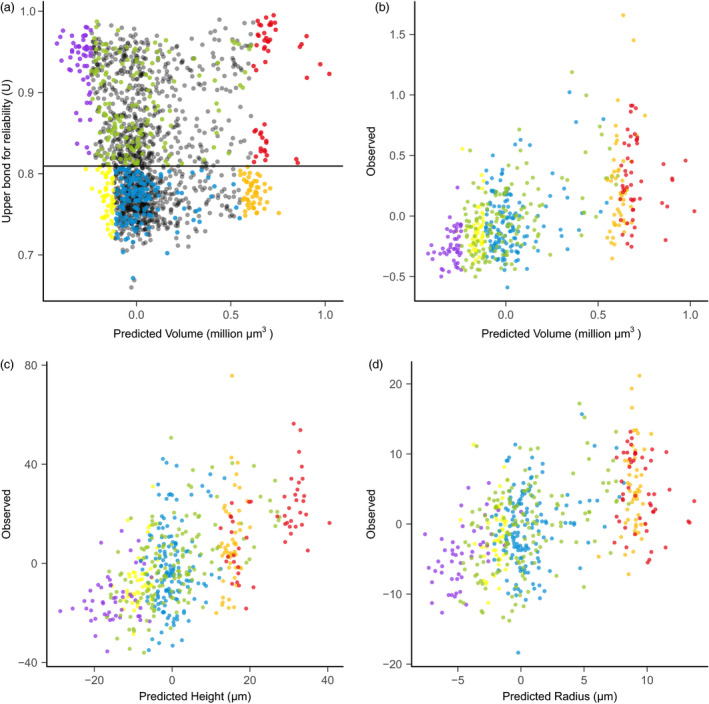
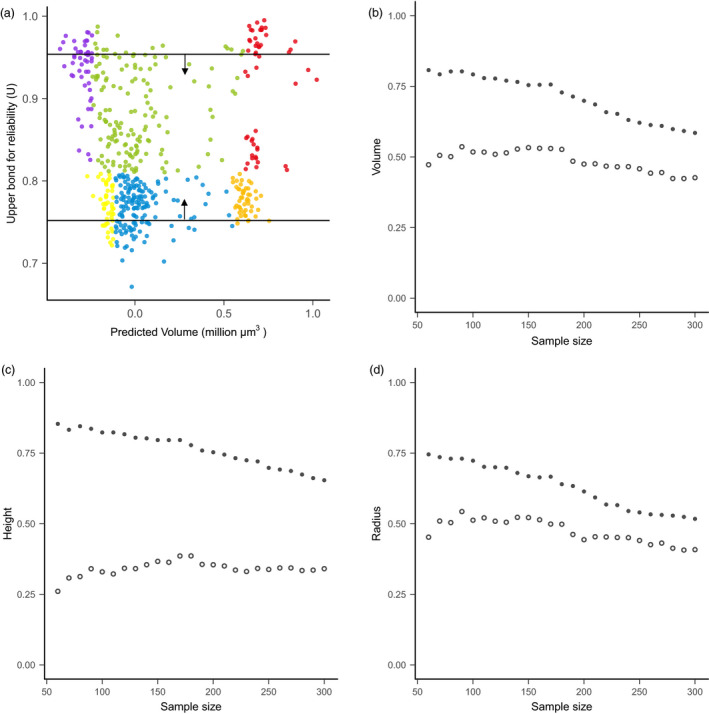
Effective evaluation of millions of crop genetic stocks is an essential component of exploiting genetic diversity to achieve global food security. By leveraging genomics and data analytics, genomic prediction is a promising strategy to efficiently explore the potential of these gene banks by starting with phenotyping a small designed subset. Reliable genomic predictions have enhanced selection of many macroscopic phenotypes in plants and animals. However, the use of genomicprediction strategies for analysis of microscopic phenotypes is limited. Here, we exploited the power of genomic prediction for eight maize traits related to the shoot apical meristem (SAM), the microscopic stem cell niche that generates all the above-ground organs of the plant. With 435 713 genomewide single-nucleotide polymorphisms (SNPs), we predicted SAM morphology traits for 2687 diverse maize inbreds based on a model trained from 369 inbreds. An empirical validation experiment with 488 inbreds obtained a prediction accuracy of 0.37-0.57 across eight traits. In addition, we show that a significantly higher prediction accuracy was achieved by leveraging the U value (upper bound for reliability) that quantifies the genomic relationships of the validation set with the training set. Our findings suggest that double selection considering both prediction and reliability can be implemented in choosing selection candidates for phenotyping when exploring new diversity is desired. In this case, individuals with less extreme predicted values and moderate reliability values can be considered. Our study expands the turbocharging gene banks via genomic prediction from the macrophenotypes into the microphenotypic space.
Keywords: genetic diversity; genomic selection; genomics; maize; plant breeding; shoot apical meristem.
© 2020 The Authors. Plant Biotechnology Journal published by Society for Experimental Biology and The Association of Applied Biologists and John Wiley & Sons Ltd.
Conflict of interest statement
The authors declare no conflict of interest.
Figures
Similar articles
-
Comprehensive analytical and empirical evaluation of genomic prediction across diverse accessions in maize.Plant Genome. 2021 Nov;14(3):e20160. doi: 10.1002/tpg2.20160. Epub 2021 Oct 18. Plant Genome. 2021. PMID: 34661990
-
Accuracy of genomic selection in European maize elite breeding populations.Theor Appl Genet. 2012 Mar;124(4):769-76. doi: 10.1007/s00122-011-1745-y. Epub 2011 Nov 11. Theor Appl Genet. 2012. PMID: 22075809
-
Genomic prediction models for traits differing in heritability for soybean, rice, and maize.BMC Plant Biol. 2022 Feb 26;22(1):87. doi: 10.1186/s12870-022-03479-y. BMC Plant Biol. 2022. PMID: 35219296 Free PMC article.
-
Genomic screening for artificial selection during domestication and improvement in maize.Ann Bot. 2007 Nov;100(5):967-73. doi: 10.1093/aob/mcm173. Epub 2007 Aug 18. Ann Bot. 2007. PMID: 17704539 Free PMC article. Review.
-
Genomic selection in plant breeding: Key factors shaping two decades of progress.Mol Plant. 2024 Apr 1;17(4):552-578. doi: 10.1016/j.molp.2024.03.007. Epub 2024 Mar 12. Mol Plant. 2024. PMID: 38475993 Review.
Cited by
-
A comparison of methods for training population optimization in genomic selection.Theor Appl Genet. 2023 Mar 9;136(3):30. doi: 10.1007/s00122-023-04265-6. Theor Appl Genet. 2023. PMID: 36892603 Free PMC article.
-
Developmental genetics of maize vegetative shoot architecture.Mol Breed. 2021 Feb 22;41(3):19. doi: 10.1007/s11032-021-01208-1. eCollection 2021 Mar. Mol Breed. 2021. PMID: 37309417 Free PMC article.
-
Genomic prediction for potato (Solanum tuberosum) quality traits improved through image analysis.Plant Genome. 2024 Dec;17(4):e20507. doi: 10.1002/tpg2.20507. Epub 2024 Sep 10. Plant Genome. 2024. PMID: 39256988 Free PMC article.
-
TrainSel: An R Package for Selection of Training Populations.Front Genet. 2021 May 7;12:655287. doi: 10.3389/fgene.2021.655287. eCollection 2021. Front Genet. 2021. PMID: 34025720 Free PMC article.
-
DHFS-ECM: Design of a Dual Heuristic Feature Selection-based Ensemble Classification Model for the Identification of Bamboo Species from Genomic Sequences.Curr Genomics. 2024 May 31;25(3):185-201. doi: 10.2174/0113892029268176240125055419. Epub 2024 Feb 1. Curr Genomics. 2024. PMID: 39087000 Free PMC article.
References
-
- Bernardo, R. and Yu, J. (2007) Prospects for genomewide selection for quantitative traits in maize. Crop Sci. 47, 1082–1090.
-
- Bradbury, P.J. , Zhang, Z. , Kroon, D.E. , Casstevens, T.M. , Ramdoss, Y. and Buckler, E.S. (2007) TASSEL: software for association mapping of complex traits in diverse samples. Bioinformatics, 23, 2633–2635. - PubMed
-
- de los Campos, G. , Gianola, D. and Allison, D.B. (2010) Predicting genetic predisposition in humans: the promise of whole‐genome markers. Nat. Rev. Genet. 11, 880–886. - PubMed
Publication types
MeSH terms
LinkOut - more resources
Full Text Sources
