Randomized Controlled Trial
. 2020 Jul;48(8):1916-1928.
doi: 10.1177/0363546520920591. Epub 2020 May 26.

The Use of Recombinant Human Growth Hormone to Protect Against Muscle Weakness in Patients Undergoing Anterior Cruciate Ligament Reconstruction: A Pilot, Randomized Placebo-Controlled Trial

Affiliations
Randomized Controlled Trial

The Use of Recombinant Human Growth Hormone to Protect Against Muscle Weakness in Patients Undergoing Anterior Cruciate Ligament Reconstruction: A Pilot, Randomized Placebo-Controlled Trial

Christopher L Mendias et al. Am J Sports Med. 2020 Jul.

Abstract

Background: Anterior cruciate ligament (ACL) tears are common knee injuries. Despite undergoing extensive rehabilitation after ACL reconstruction (ACLR), many patients have persistent quadriceps muscle weakness that limits their successful return to play and are also at an increased risk of developing knee osteoarthritis (OA). Human growth hormone (HGH) has been shown to prevent muscle atrophy and weakness in various models of disuse and disease but has not been evaluated in patients undergoing ACLR.

Hypothesis: Compared with placebo treatment, a 6-week perioperative treatment course of HGH would protect against muscle atrophy and weakness in patients undergoing ACLR.

Study design: Randomized controlled trial; Level of evidence, 2.

Methods: A total of 19 male patients (aged 18-35 years) scheduled to undergo ACLR were randomly assigned to the placebo (n = 9) or HGH (n = 10) group. Patients began placebo or HGH treatment twice daily 1 week before surgery and continued through 5 weeks after surgery. Knee muscle strength and volume, patient-reported outcome scores, and circulating biomarkers were measured at several time points through 6 months after surgery. Mixed-effects models were used to evaluate differences between treatment groups and time points, and as this was a pilot study, significance was set at P < .10. The Cohen d was calculated to determine the effect size.

Results: HGH was well-tolerated, and no differences in adverse events between the groups were observed. The HGH group had a 2.1-fold increase in circulating insulin-like growth factor 1 over the course of the treatment period (P < .05; d = 2.93). The primary outcome measure was knee extension strength, and HGH treatment increased normalized peak isokinetic knee extension torque by 29% compared with the placebo group (P = .05; d = 0.80). Matrix metalloproteinase-3 (MMP3), which was used as an indirect biomarker of cartilage degradation, was 36% lower in the HGH group (P = .05; d = -1.34). HGH did not appear to be associated with changes in muscle volume or patient-reported outcome scores.

Conclusion: HGH improved quadriceps strength and reduced MMP3 levels in patients undergoing ACLR. On the basis of this pilot study, further trials to more comprehensively evaluate the ability of HGH to improve muscle function and potentially protect against OA in patients undergoing ACLR are warranted.

Registration: NCT02420353 ( ClinicalTrials.gov identifier).

Keywords: anterior cruciate ligament; human growth hormone; muscle atrophy; orthobiologics; somatropin.


Figures
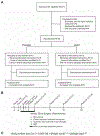
Figure 1.
Figure 1.
Study overview. (A) CONSORT (Consolidated Standards of Reporting Trials) diagram. (B) Approximate timeline of study events. (C) DuBois formula used to calculate the body surface area. HGH, human growth hormone; MRI, magnetic resonance imaging.
Figure 2.
Figure 2.
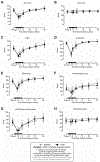
Circulating biomarkers. Changes in circulating concentration values from serum or plasma and the area under the curve (AUC) from 1 week before surgery to 5 weeks after surgery for (A, B) insulin-like growth factor 1 (IGF-1), (C, D) myostatin, (E, F) matrix metalloproteinase–3 (MMP3), and (G, H) hyaluronic acid (HA). Values are shown as mean ± 90% CI. Patients in the human growth hormone (HGH) group are shown in black, and those in the placebo group are shown in gray. The thick black line indicates the treatment window for HGH or placebo, with the preoperative time point occurring before initiating HGH or placebo treatment. Differences for A, C, E, and G were tested using mixed-effects models and for B, D, F, and H using t tests. Significance: .05 ≤ P < .10 comparing HGH with placebo at a given time point; P < .05 comparing HGH with placebo at a given time point; ^.05 ≤ P < .10 comparing the postoperative time point with the preoperative time point within the same treatment group; #P < .05 comparing the postoperative time point with the preoperative time point within the same treatment group.
Figure 3.
Figure 3.
Magnetic resonance imaging volume measurements. Changes in fat-cleared (A) absolute and (B) normalized quadriceps muscle volume and (C) absolute and (D) normalized hamstring muscle volume. Values are shown as mean ± 90% CI. Patients in the human growth hormone (HGH) group are shown in black, and those in the placebo group are shown in gray. The thick black line indicates the treatment window for HGH or placebo, with the preoperative time point occurring before initiating HGH or placebo treatment. Differences were tested using mixed-effects models. Significance: .05 ≤ P < .10 comparing HGH with placebo at a given time point; *P < .05 comparing HGH with placebo at a given time point; ^.05 ≤ P < .10 comparing the postoperative time point with the preoperative time point within the same treatment group; #P < .05 comparing the postoperative time point with the preoperative time point within the same treatment group.
Figure 4.
Figure 4.
Strength measurements. Changes in peak (A) absolute and (B) normalized isometric knee extension at 90° of knee flexion, (C) absolute and (D) normalized isokinetic knee extension from 90° to 0° of knee flexion, (E) absolute and (F) normalized isometric knee flexion at 90° of knee flexion, and (G) absolute and (H) normalized isokinetic knee flexion from 0° to 90° of knee flexion. Values for B, D, F, and H are normalized to the muscle group in the contralateral uninjured leg before surgery. Values are shown as mean ± 90% CI. Patients in the human growth hormone (HGH) group are shown in black, and those in the placebo group are shown in gray. The thick black line indicates the treatment window for HGH or placebo, with the preoperative time point occurring before initiating HGH or placebo treatment. Differences were tested using mixed-effects models. Significance: .05 ≤ P < .10 comparing HGH with placebo at a given time point; P < .05 comparing HGH with placebo at a given time point; ^.05 ≤ P < .10 comparing the postoperative time point with the preoperative time point within the same treatment group; #P < .05 comparing the postoperative time point with the preoperative time point within the same treatment group.
Figure 5.
Figure 5.
Patient-reported outcomes. Changes in patient-reported outcome scores. Higher scores correspond to improved functional status. (A) Veterans RAND 12-Item Health Survey (VR-12) physical component summary (PCS), (B) VR-12 mental component summary (MCS), (C) International Knee Documentation Committee (IKDC) form, and Knee injury and Osteoarthritis Outcome Score (KOOS) subscales for (D) activities of daily living (ADL), (E) pain, (F) quality of life, (G) sport and recreation function, and (H) other symptoms. Values are shown as mean ± 90% CI. Patients in the human growth hormone (HGH) group are shown in black, and those in the placebo group are shown in gray. The thick black line indicates the treatment window for HGH or placebo, with the preoperative time point occurring before initiating HGH or placebo treatment. Differences were tested using mixed-effects models. Significance: .05 ≤ P < .10 comparing HGH with placebo at a given time point; P < .05 comparing HGH with placebo at a given time point; ^.05 ≤ P < .10 comparing the postoperative time point with the preoperative time point within the same treatment group; #P < .05 comparing the postoperative time point with the preoperative time point within the same treatment group.

Similar articles

Cited by

References

    1. Allen DB, Backeljauw P, Bidlingmaier M, et al. GH safety workshop position paper: a critical appraisal of recombinant human GH therapy in children and adults. Eur J Endocrinol. 2016;174(2):P1–P9. - PMC - PubMed
    1. Anderson AF, Irrgang JJ, Kocher MS, Mann BJ, Harrast JJ; Committee I. The International Knee Documentation Committee Subjective Knee Evaluation Form: normative data. Am J Sports Med. 2006; 34(1):128–135. - PubMed
    1. Arentson-Lantz EJ, English KL, Paddon-Jones D, Fry CS. Fourteen days of bed rest induces a decline in satellite cell content and robust atrophy of skeletal muscle fibers in middle-aged adults. J Appl Physiol. 2016;120(8):965–975. - PMC - PubMed
    1. Bidlingmaier M, Friedrich N, Emeny RT, et al. Reference intervals for insulin-like growth factor-1 (IGF-I) from birth to senescence: results from a multicenter study using a new automated chemiluminescence IGF-I immunoassay conforming to recent international recommendations. J Clin Endocrinol Metab. 2014;99(5):1712–1721. - PubMed
    1. Boesen AP, Dideriksen K, Couppe C, et al. Tendon and skeletal muscle matrix gene expression and functional responses to immobilisation and rehabilitation in young males: effect of growth hormone administration. J Physiol (Lond). 2013;591(pt 23):6039–6052. - PMC - PubMed

Publication types

Associated data