. 2021 Jun;17(6):1479-1499.
doi: 10.1080/15548627.2020.1767371. Epub 2020 May 26.

Autophagy and post-ischemic conditioning in retinal ischemia

Affiliations

Autophagy and post-ischemic conditioning in retinal ischemia

Biji Mathew et al. Autophagy. 2021 Jun.

Abstract

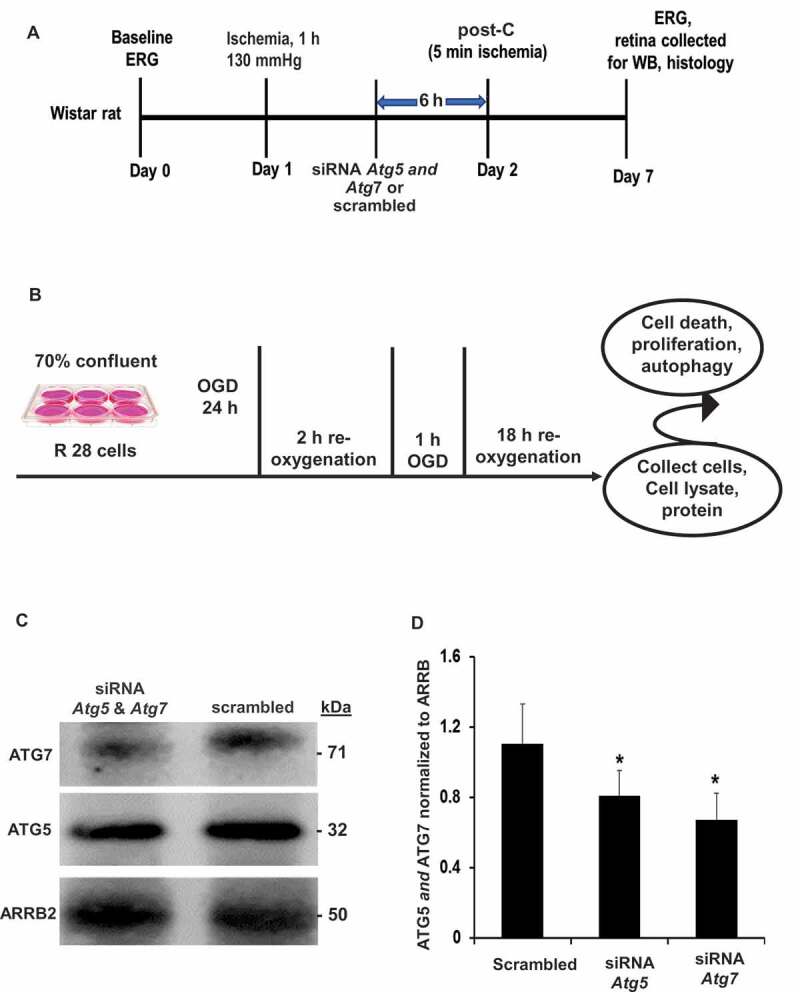
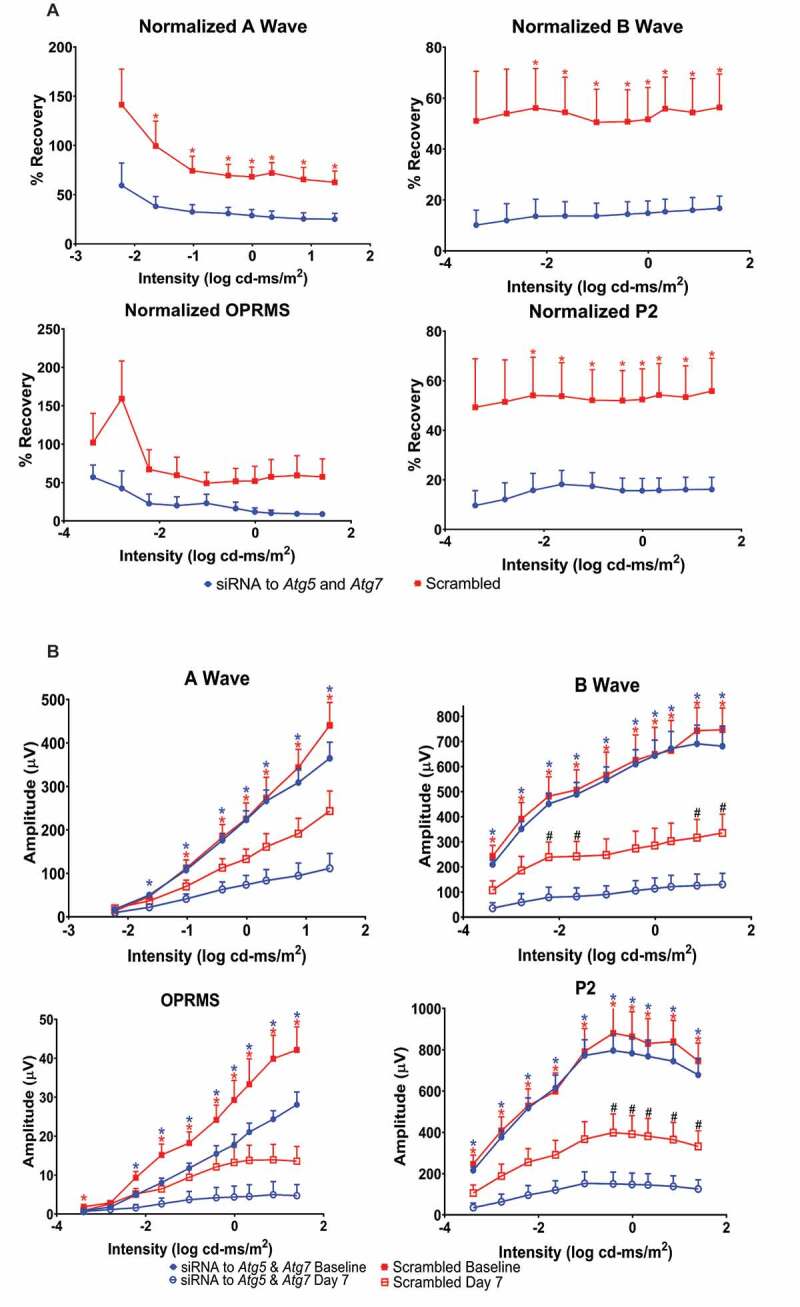
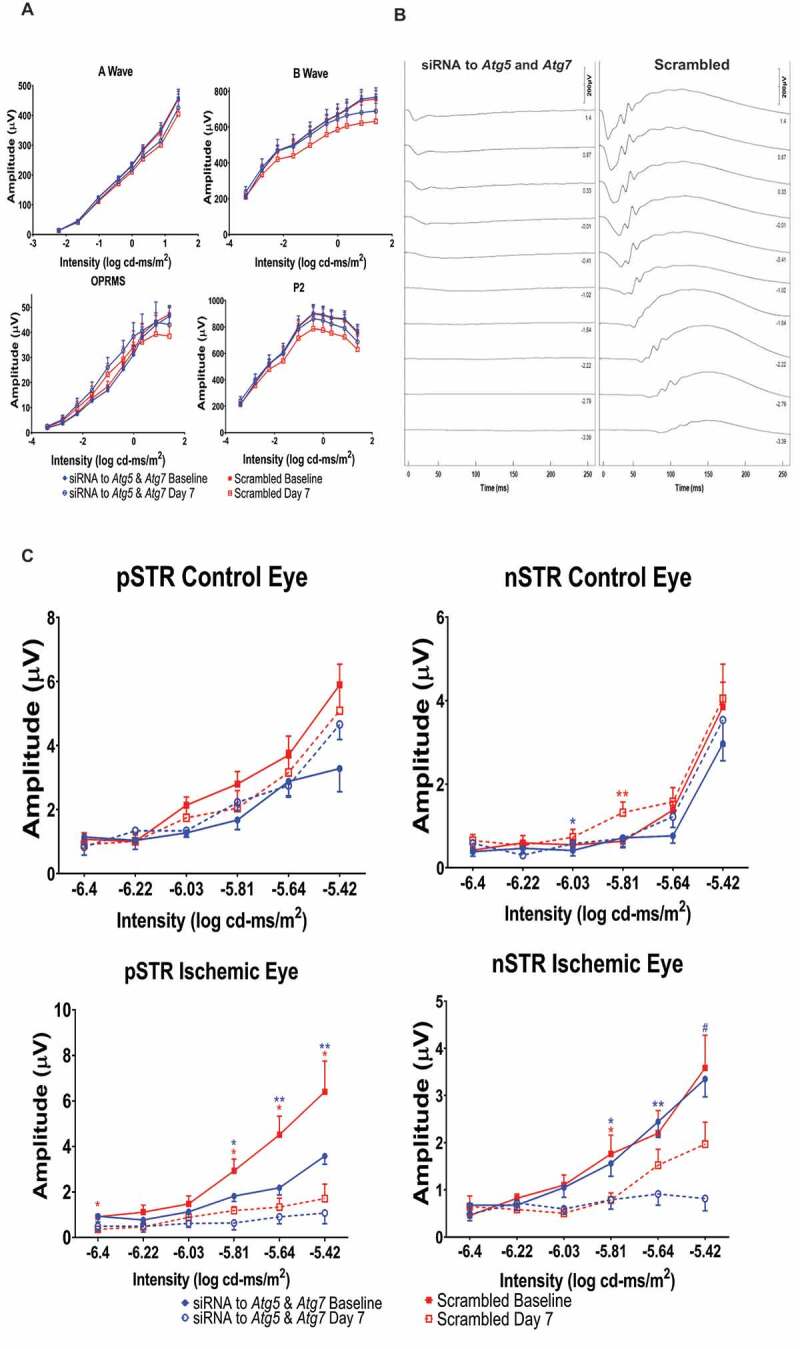
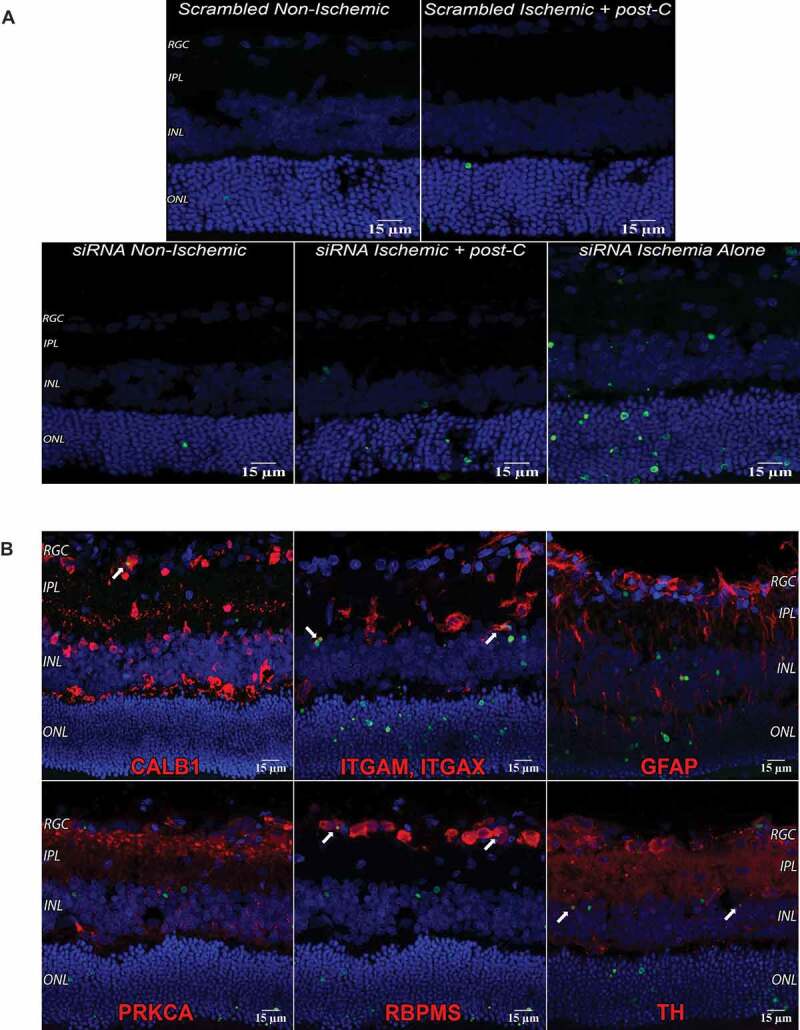
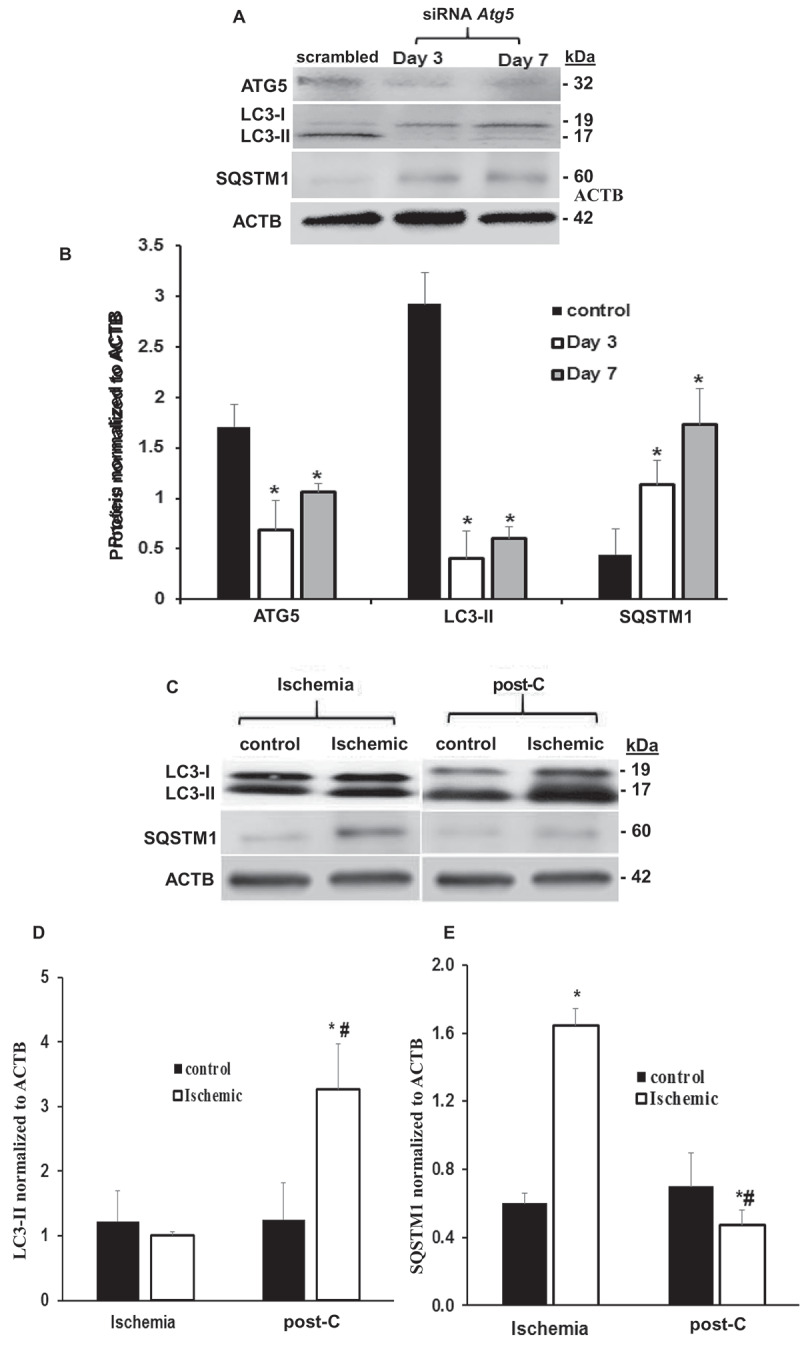
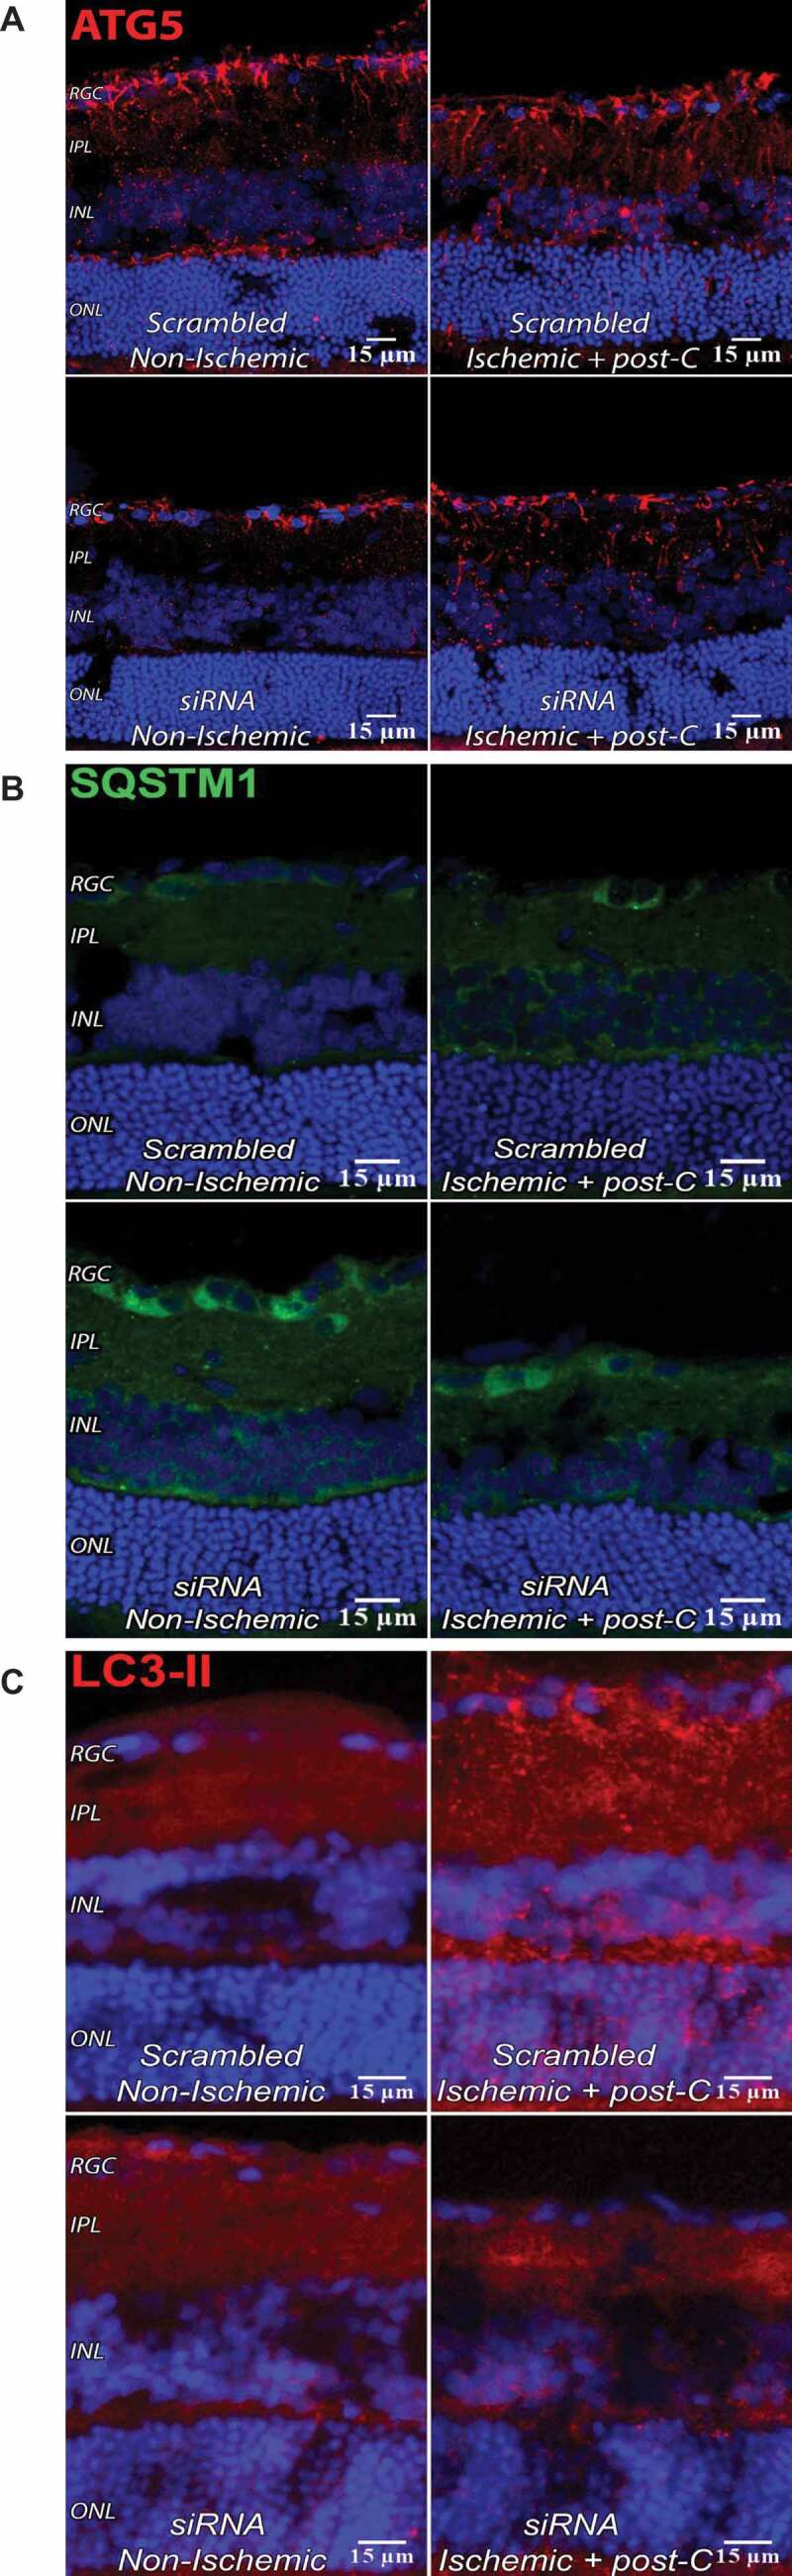
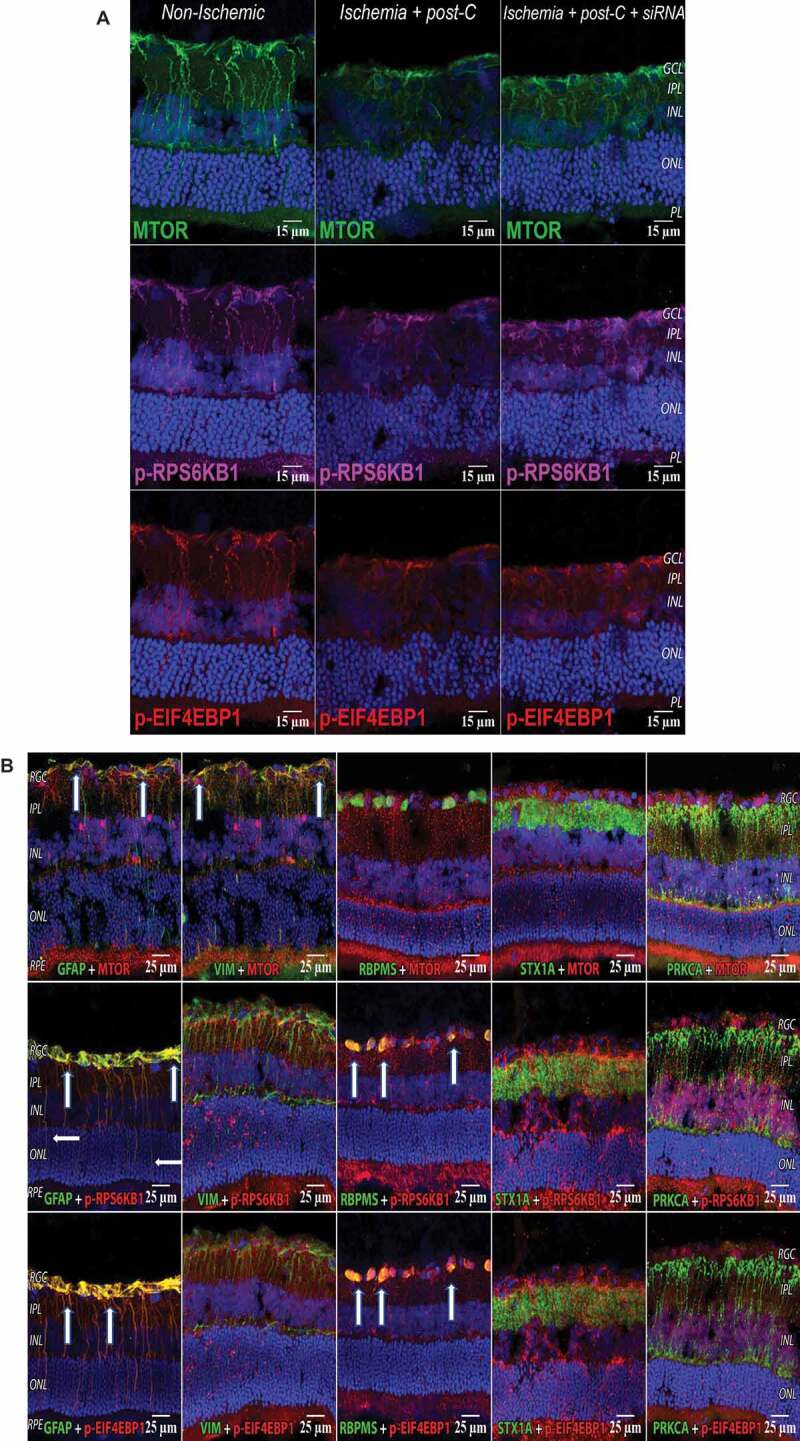
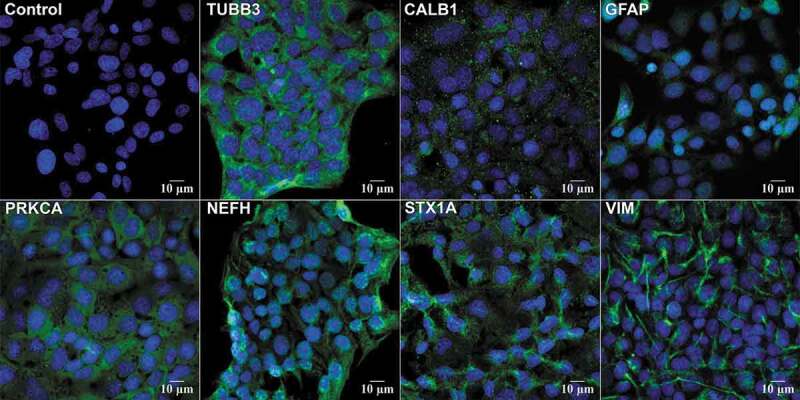
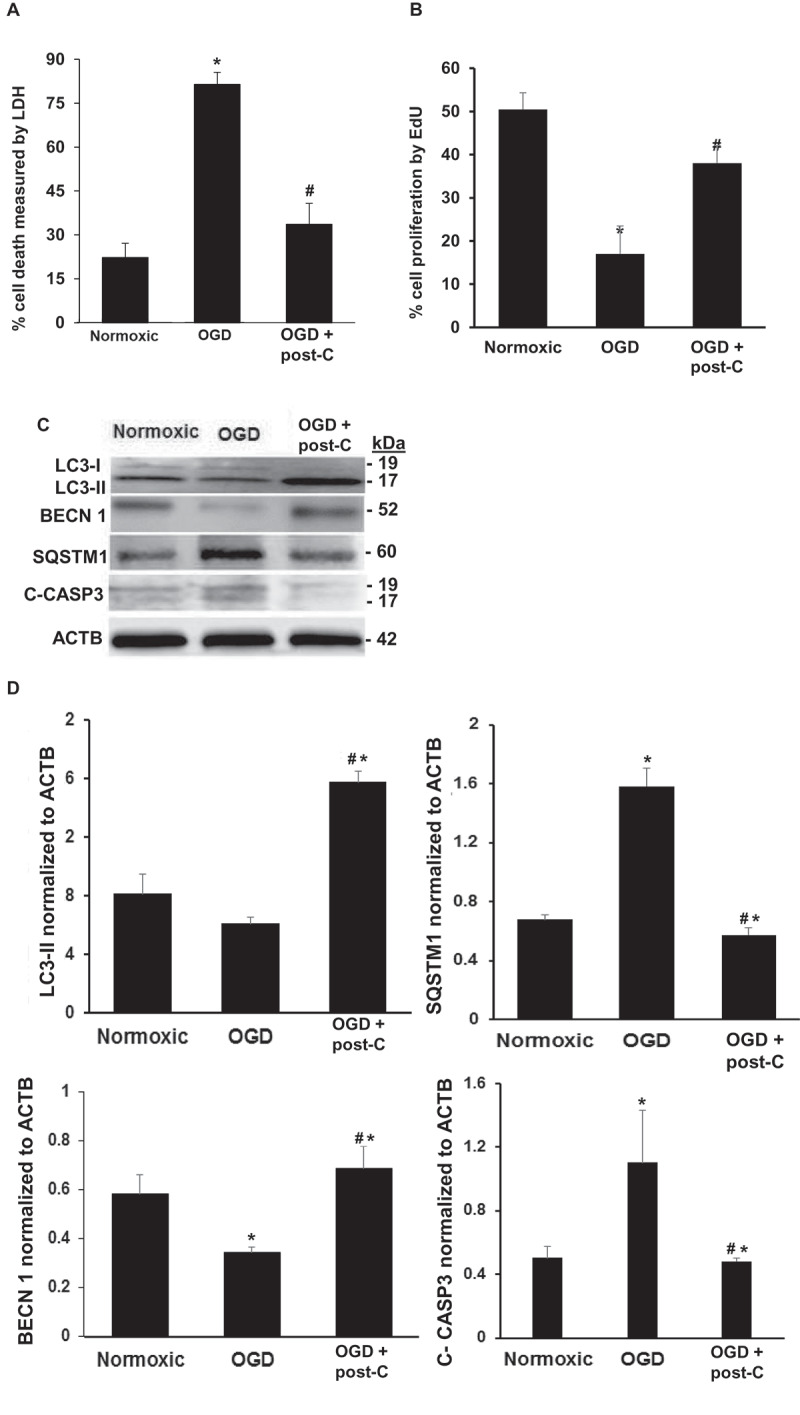
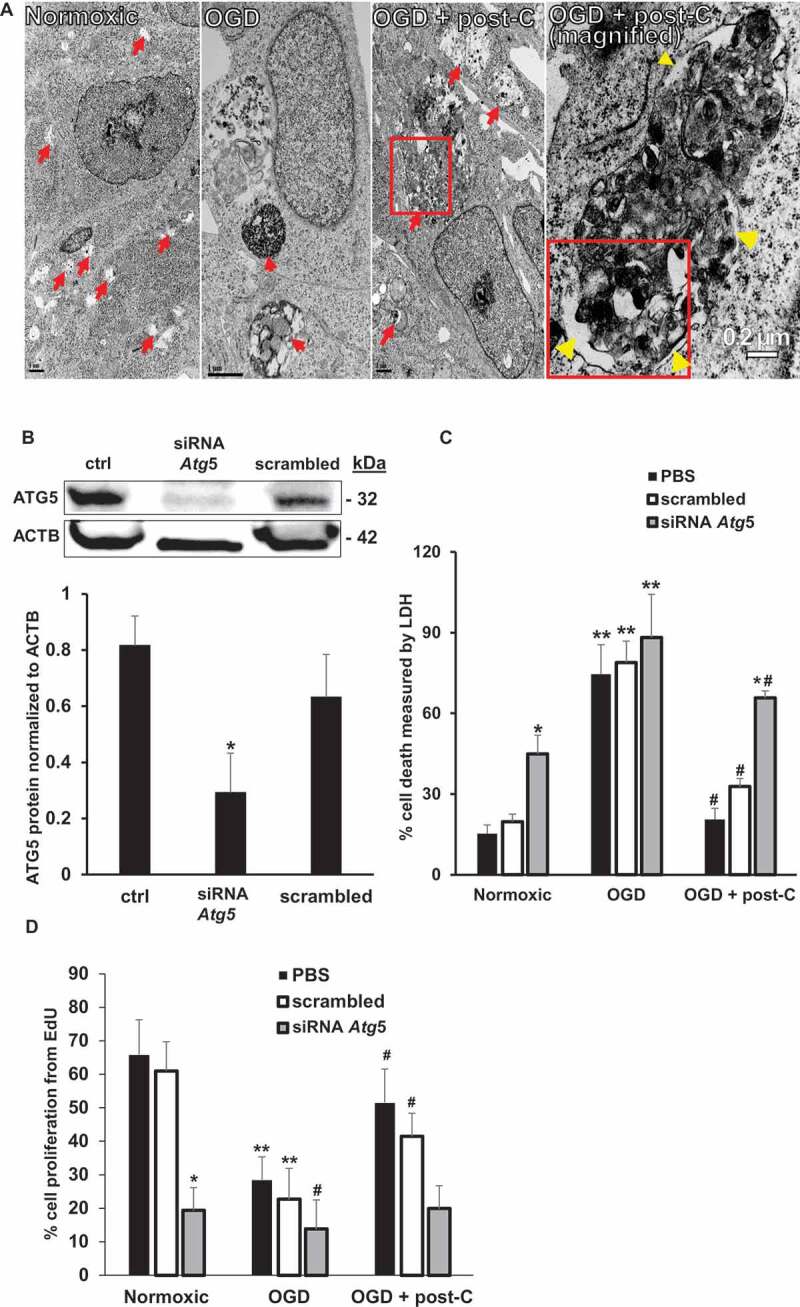
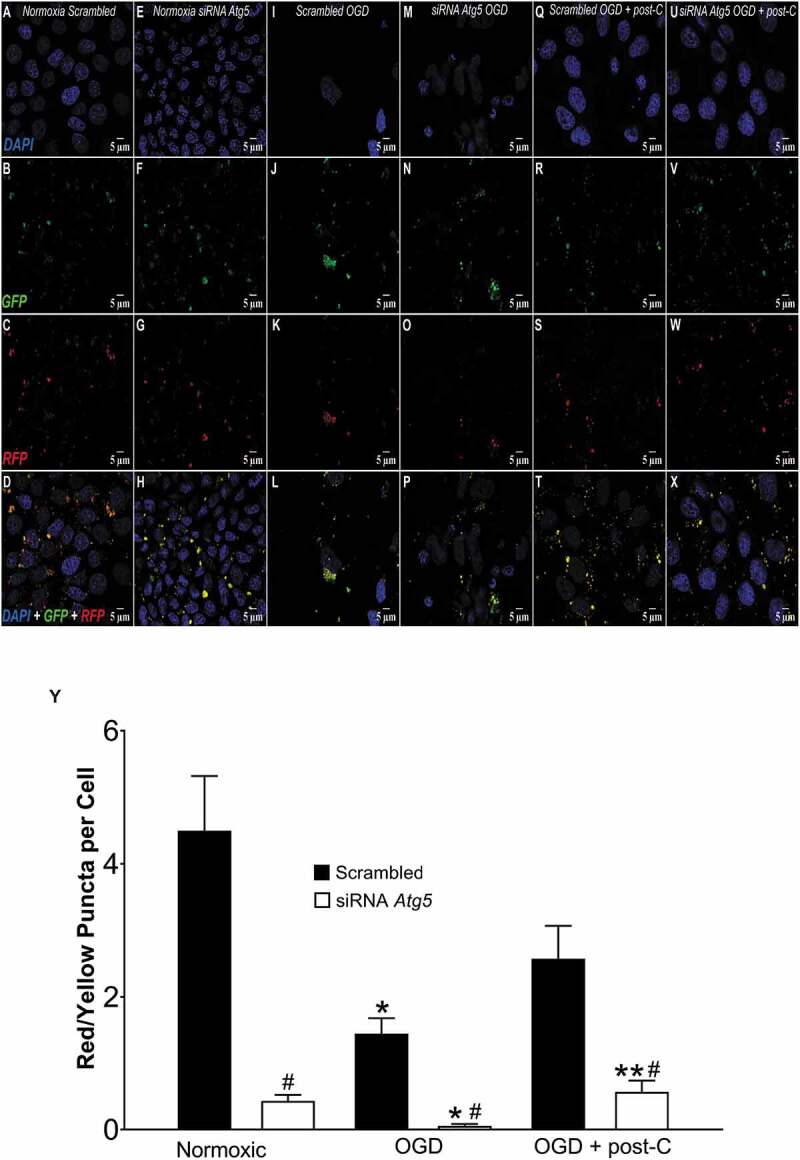
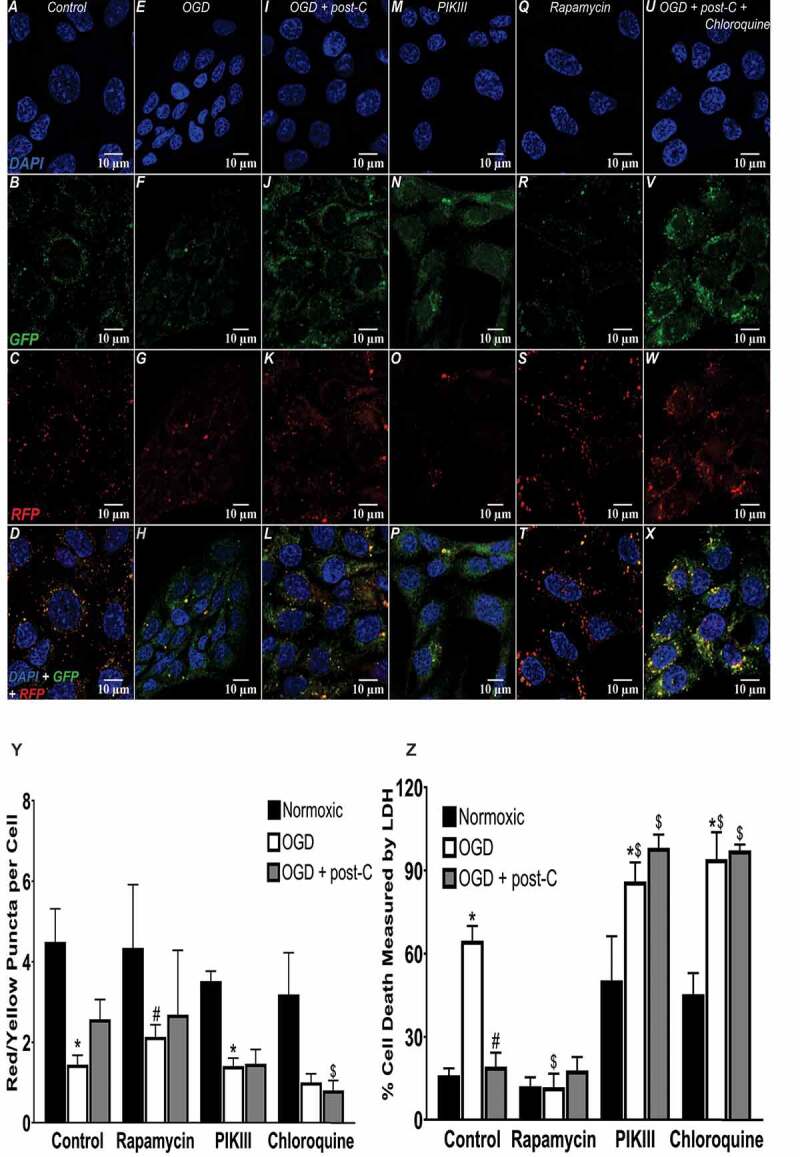
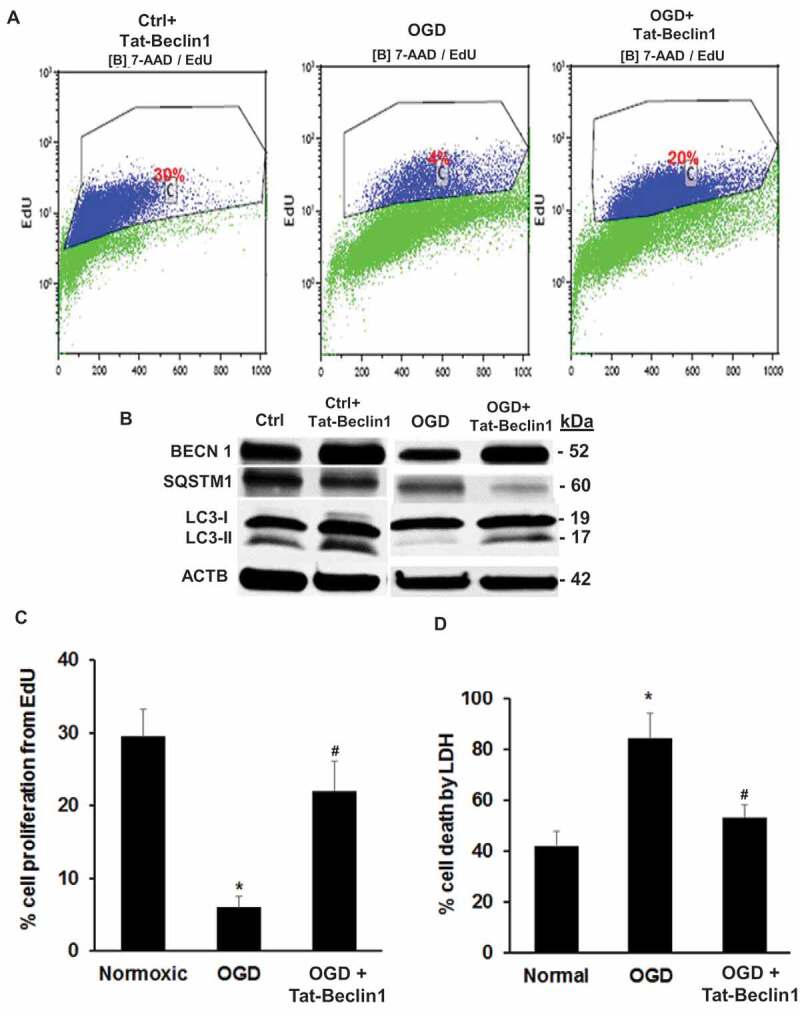
Retinal ischemia is a major cause of vision loss and a common underlying mechanism associated with diseases, such as diabetic retinopathy and central retinal artery occlusion. We have previously demonstrated the robust neuroprotection in retina induced by post-conditioning (post-C), a brief period of ischemia, 24 h, following a prolonged and damaging initial ischemia. The mechanisms underlying post-C-mediated retinal protection are largely uncharacterized. We hypothesized that macroautophagy/autophagy is a mediator of post-C-induced neuroprotection. This study employed an in vitro model of oxygen glucose deprivation (OGD) in the retinal R28 neuronal cell line, and an in vivo rat model of retinal ischemic injury. In vivo, there were significant increases in autophagy proteins, MAP1LC3-II/LC3-II, and decreases in SQSTM1/p62 (sequestosome 1) in ischemia/post-C vs. ischemia/sham post-C. Blockade of Atg5 and Atg7 in vivo decreased LC3-II, increased SQSTM1, attenuated the functional protective effect of post-C, and increased histological damage and TUNEL compared to non-silencing siRNA. TUNEL after ischemia in vivo was found in retinal ganglion, amacrine, and photoreceptor cells. Blockade of Atg5 attenuated the post-C neuroprotection by a brief period of OGD in vitro. Moreover, in vitro, post-C attenuated cell death, loss of cellular proliferation, and defective autophagic flux from prolonged OGD. Stimulating autophagy using Tat-Beclin 1 rescued retinal neurons from cell death after OGD. As a whole, our results suggest that autophagy is required for the neuroprotective effect of retinal ischemic post-conditioning and augmentation of autophagy offers promise in the treatment of retinal ischemic injury.Abbreviations: BECN1: Beclin 1, autophagy related; DAPI: 4',6-diamidino-2-phenylindole; DR: diabetic retinopathy; EdU: 5-ethynyl-2'-deoxyuridine; ERG: Electroretinogram; FITC: Fluorescein isothiocyanate; GCL: Ganglion cell layer; GFAP: Glial fibrillary acidic protein; INL: Inner nuclear layer; IPL: Inner plexiform layer; MAP1LC3/LC3: Microtubule-associated protein 1 light chain 3; OGD: Oxygen-glucose deprivation; ONL: Outer nuclear layer; OP: Oscillatory potential; PFA: Paraformaldehyde; PL: Photoreceptor layer; post-C: post-conditioning; RFP: Red fluorescent protein; RGC: Retinal ganglion cell; RPE: Retinal pigment epithelium; RT-PCR: Real-time polymerase chain reaction; SEM: Standard error of the mean; siRNA: Small interfering RNA; SQSTM1: Sequestosome 1; STR: Scotopic threshold response; Tat: Trans-activator of transcription; TUNEL: Terminal deoxynucleotidyl transferase dUTP nick end labeling.

Keywords: ATG proteins; LC3; MTOR; SQSTM1/p62; TUNEL; autophagic flux; macroautophagy/autophagy; post-ischemic conditioning; retina.


Conflict of interest statement

No potential conflict of interest was reported by the authors.

Figures

Figure 1.
Figure 1.
Schematic representation of experimental protocol. (A) in vivo rat (B) in vitro R28 cell line ischemia and post-C model. (C, D) Representative western blot image and densitometry demonstrating the silencing effect on ATG5 and ATG7 in vivo with intravitreal administration of siRNA. Results were normalized for protein loading using ARRB2. Mean ± SEM; N = 4 per group; * = p < 0.05 for siRNA to Atg5 and Atg7 vs. scrambled. ERG: electroretinogram; OGD: oxygen-glucose deprivation; siRNA Atg: interfering RNA to Atg; WB: western blot
Figure 2.
Figure 2.
Autophagy is required for functional retinal recovery by post-C after ischemia in vivo. Stimulus intensity response in post-conditioned ischemic rat retinae injected with Atg5 and Atg7 siRNA. (A) Normalized ERG amplitude data for a- and b-waves, oscillatory potentials (OP; shown as OPRMS, OP Root Mean Square) and P2 over a range of flash intensities (x-axis, log cd-ms/m2). Y-axis = calculated % recovery of amplitudes relative to baseline. Data were recorded at baseline (prior to ischemia) and 7 d after post-C (post-C was 24 h after ischemia) and shown as mean ± SEM. N = 9 per group; * = p < 0.05 for non-silencing scrambled vs. siRNA to Atg5 and Atg7. Description of data points appears at bottom of the graph. (B) Absolute ERG amplitude data for ischemic eyes for a- and b-waves, OP and P2 over a range of flash intensities (log cd-ms/m2) shown on the x-axis. Y-axis is absolute amplitude (µV); mean ± SEM, and N = 9 per group. Blue * indicates p < 0.05 for baseline vs. day 7 ischemic eyes in siRNA-treated group. Red * indicates p < 0.05 for baseline vs. day 7 ischemic eyes in scrambled-treated group. # indicates significant difference between ischemic eyes for siRNA vs. scrambled groups. Description of data points appears at bottom of the graph
Figure 3.
Figure 3.
ERG absolute values, representative traces, and the scotopic threshold responses. (A) Stimulus-intensity responses for the absolute values of amplitudes of a- and b-waves, OP, and P2 in the non-ischemic control eyes. ERGs recorded at baseline and 7 d after ischemia and post-C. Y-axis is absolute amplitude (µV), and x-axis is the stimulus intensity (log cd-ms/m2). Description of data points appears at bottom of the graph. Data are shown as mean ± SEM.(B) Representative ERG tracings for ischemic groups. Time after flash in milliseconds (ms) on x-axis. Scale bar for amplitude in top right corners. (C) Stimulus intensity responses for the scotopic threshold response (STR), showing the positive STR (pSTR) and negative STR (nSTR) in rats subjected to retinal ischemia and post-conditioning and the eyes injected with siRNA for Atg5 and Atg7 or scrambled. STRs were recorded from the control and ischemic eyes at baseline and 7 d after post-C. Absolute amplitude appears on the y-axis (see Methods) and the 6 flash intensities (log cd-ms/m2) are on the x-axis. Description of data points appears at bottom of the graph. Data are shown as mean ± SEM; blue * for p < 0.05 for siRNA group, and red ** p < 0.05 for scrambled group. N = 9 for both groups. Symbols for bottom ischemic eye graphs: blue * indicates p < 0.05, and blue ** is p < 0.01 between baseline and day 7 ischemic eyes of the siRNA-injected group; red * indicates p < 0.05 between baseline and day 7 ischemic eyes of the scrambled groups, blue # indicates p < 0.01 between the siRNA and scrambled groups
Figure 4.
Figure 4.
TUNEL and autophagy in the retina. (A) TUNEL, Atg5 silencing, and ischemia. The 14 µm cryosections were prepared from retinas taken 24 h after post-C (that is, 48 h after ischemia). DAPI: blue, TUNEL: green, and examined using confocal microscopy. Clockwise from top left: scrambled, non-ischemic, scrambled, ischemia + post-C, siRNA with ischemia alone, siRNA + ischemia + post-C, and siRNA, non-ischemic. These are representative images from N = 3 per group; magnification 40x. (B) TUNEL in specific cells in the retina after ischemia. DAPI: blue, TUNEL: green, and markers for retinal cells are red. White arrows (top left panel) show yellow overlap of CALB1 and TUNEL, in what is likely a displaced amacrine cell. ITGAM and ITGAX double labeling (white arrows, top middle panel) are microglia or monocytes engulfing TUNEL cells in the INL, and TH (tyrosine hydroxylase) double labeling (white arrows, bottom-right panel) shows TUNEL in amacrine cells in the INL. RBPMS (RNA binding protein with multiple splicing) double labeling shows TUNEL in RGCs (white arrows, bottom middle panel). No co-labeling was found with GFAP, or PRKCA. TUNEL is also visible in the photoreceptor layer. These are representative images from N = 3 per group; magnification 40x
Figure 5.
Figure 5.
Atg5 silencing and post-C induction of autophagy in vivo. (A and B) Representative western blot images and densitometry bar graphs demonstrating decreased autophagy in Atg5-silenced retinae as decreased LC3-II and increased SQSTM1 post-silencing days 3 and 7. Mean ± SEM; n = 4 per group. * = p < 0.05 comparing control scrambled siRNA- to Atg5 siRNA-silenced group. ACTB was loading control. (C) Representative western blot image demonstrating increased LC3-II and decreased SQSTM1 protein levels in ischemia + post-C retinae vs. ischemia + sham post-C in vivo collected 7 d after post-C. (D and E) Densitometry analysis of protein levels of LC3-II and SQSTM1 in ischemia + post-C retinae vs. ischemia + sham post-C. mean ± SEM; n = 6 per group. * = p < 0.05 comparing within groups, non-ischemic to ischemic paired eyes; # = p < 0.05 comparing ischemia + sham post-C vs. ischemia + post-C eyes between groups
Figure 6.
Figure 6.
Impact of Atg5 silencing in vivo. Immunostaining for ATG5, SQSTM1, and LC3-II with Atg5 silencing in vivo. (A-C) are 7 µm retinal cryosections at 4 d after ischemia (i.e., 3 d after siRNA administration), examined using confocal microscopy; magnification 40x. (A) siRNA to Atg5 reduced levels of ATG5 in immunostained sections. DAPI: blue; ATG5: red. Representative images from N = 3 per group. (B) siRNA to Atg5 increased levels of SQSTM1 on immunostained sections. DAPI: blue. SQSTM1 (green staining) is in the RGC layer and INL and was increased by Atg5 siRNA under baseline conditions and with ischemia + post-C. Representative images from N = 3 per group. (C) siRNA to Atg5 reduced levels of LC3 on immunostained sections. DAPI: blue and LC3-II: red. Most of the LC3-II was located in the inner retinal layers and increased in the ONL with ischemia. These are representative images from N = 3 per group
Figure 7.
Figure 7.
MTOR pathway in retina with ischemia and post-C. (A) Changes in immunostaining for the MTOR pathway (from left to right) in normal, ischemia + post-C + scrambled, and ischemia + post-C + Atg5 siRNA. Retinal cryosections were prepared 24 h after post-C (that is, 48 h after ischemia), and examined using confocal microscopy. From top to bottom are staining for MTOR, p-RPS6KB1, and p-EIF4EBP1. These are representative images from N = 3 per group. Orientation is shown on far right; magnification 40x. (B) Localization of MTOR pathway proteins in retinal cells. These cryosections are all taken from the same group, ischemia + post-C + scrambled Atg5 siRNA, at 24 h after post-C (that is, 48 h after ischemia). Nuclei were stained blue using DAPI. From top to bottom are staining (red) for MTOR, p-RPS6KB1, and p-EIF4EBP1. From left to right (staining green) are: GFAP (Muller cells); VIM (for astrocytes); RBPMS (retinal ganglion cells); STX1A (amacrine cells); PRKCA (bipolar cells). For GFAP, white arrows indicate yellow overlap of MTOR (red), p-RPS6KB1: red; and p-EIF4EBP1: red with GFAP: green, in Muller cell endplates and projections. For VIM, white arrows indicate yellow overlap of MTOR (red) and VIM (green) in the superficial inner retina. For RBPMS, white arrows indicate yellow overlap of p-RPS6KB1: red, and p-EIF4EBP1: red with RBPMS: green in retinal ganglion cells. There was no evident overlap with the MTOR pathway for STX1A (amacrine cells), and PRKCA (bipolar cells). Orientation on far left. RGC = retinal ganglion cells, IPL = inner plexiform layer, INL = inner nuclear layer, ONL = outer nuclear layer, RPE = retinal pigment epithelium. Representative images from N = 3 per group; magnification 40x
Figure 8.
Figure 8.
Neuronal markers in R28 cells. R28 cells were stained with primary antibodies to retinal cell protein markers (Table 3) and imaged using confocal microscopy. DAPI (blue) stains the cell nuclei. All other markers were imaged using green secondary antibody. Clockwise, starting from top left: control IgA, TUBB3 staining cytoplasm and axons of retinal neurons; CALB1 (retinal horizontal cells); GFAP (Muller glial cells); VIM (astrocytes); STX1A (amacrine neurons) showing cytoplasmic staining; NFH (neurofilament); PRKCA (retinal bipolar neurons) showing cytoplasmic staining. These are representative images from N = 4; magnification 63x
Figure 9.
Figure 9.
Post-C attenuates cell death, enhances cell proliferation, induces autophagy, and prevents apoptosis in R28 retinal neuronal cells subjected to OGD in vitro. (A) Simulated post-C robustly decreased cell death (Y-axis, % cell death, LDH assay) in retinal R28 cells in vitro subjected to OGD. mean ± SEM; n = 6 per group. * = p < 0.05 OGD vs. normoxic conditions; # = p < 0.05 OGD + post-C vs. OGD alone. (B) Simulated post-C increased cell proliferation (Click-iT EdU) in retinal R28 cells in vitro subjected to OGD. mean ± SEM; n = 6 per group. * = p < 0.05 OGD vs. normoxic conditions; # = p < 0.05 OGD + post-C vs. OGD alone. (C) Representative western blot images showing altered levels of LC3-II, SQSTM1, BECN1, and C-CASP3 (cleaved caspase-3) in R28 cells subjected to OGD and post-C. OGD produced minimal change in LC3-II, but when post-C was added, there was a significant increase in LC3-II. SQSTM1 levels were increased with OGD and restored to levels similar to normoxia conditions by post-C. BECN1 levels decreased with OGD and increased when post-C was added to OGD. C-CASP3 was increased by OGD, and this increase was attenuated with post-C. (D) Bar graphs of densitometry analysis of protein levels of LC3-II, SQSTM1, BECN1, and C-CASP3, normalized to ACTB. mean ± SEM; n = 4 per group. * = p < 0.05 vs. normoxia; # = p < 0.05 OGD vs. OGD + post-C
Figure 10.
Figure 10.
Blockade of Atg5 attenuates post-C-mediated neuroprotection in R28 cells subjected to OGD in vitro. (A) EM evidence of autophagy induction by post-C in R28 retinal neuronal cells. Electron micrographic images of autophagosomes in R28 cells subjected to normoxia, OGD and OGD + post-C. Red arrows point to autophagosomes. With OGD, autophagosomes appeared densely packed with cellular material. When post-C was added, the autophagosomes were larger in size, and less densely packed compared to OGD. Yellow arrowheads in the magnified image (far-right) inside and outside the boxed area indicate double membranes. Scale bar = 1 µm except for right-most image at 0.2 µm. (B) Representative western blot illustrating the silencing efficiency of Atg5 siRNA in R28 cells. The cells were treated with PBS (“control”), siRNA to Atg5, or scrambled. mean ± SEM; n = 4 per group; * = p < 0.05 siRNA Atg5 vs. control or scrambled. ACTB was loading control. (C) Atg5 silencing and cell death with normoxia, OGD, and OGD + post-C measured by LDH assay. mean ± SEM; n = 5 per treatment; * = p < 0.05 for scrambled or control vs. siRNA within groups; ** = p < 0.05 normoxia vs. OGD for each treatment; # = p < 0.05 OGD vs. OGD + post-C. (D) Atg5 silencing significantly altered proliferation in all three groups measured by EdU assay. mean ± SEM; n = 5 per treatment; * = p < 0.05 for scrambled or control vs. siRNA within groups; ** = p < 0.05 normoxia vs. OGD for each treatment; # = p < 0.05 OGD vs. OGD + post-C
Figure 11.
Figure 11.
Post-C induced autophagic flux and its blockade by Atg5 siRNA in vitro. (A-X) Representative immunofluorescence images comparing autophagic flux in R28 cells subjected to (from left to right) normoxia, OGD, and, OGD + post-C using tandem RFP-GFP-LC3 sensor. In each experiment, top to bottom are DAPI, GFP, RFP, and merged images, all displayed at 63x via confocal imaging. In this assay, yellow puncta represent autophagosomes and red puncta are autolysosomes. (A-D) Normoxic R28 cells + scrambled. (E-H) Normoxic R28 cells + Atg5 siRNA. (I-L) R28 cells subjected to OGD + scrambled. (M-P): R28 cells subjected to OGD + Atg5 siRNA. (Q-T) R28 cells subjected to OGD+ post-C + scrambled. (U-X) R28 cells subjected to OGD + post-C + Atg5 siRNA. (Y): Quantification of flux (red/yellow puncta per cell, mean ± SEM) N = 4. * = p < 0.05 vs normoxia; # = p < 0.05 vs scrambled; ** = p < 0.05 vs OGD + siRNA
Figure 12.
Figure 12.
Autophagic flux, stimulants, and antagonists in simulated ischemia in vitro. (A-X) Representative immunofluorescence images comparing autophagic flux in R28 cells subjected to OGD + post-C using tandem RFP-GFP-LC3 reagent, PIK-III and chloroquine as negative control autophagy inhibitors, and rapamycin to stimulate autophagy, as a positive control. In each experiment, top to bottom are DAPI, GFP, RFP, and merged, all displayed at 63x. (Y) Quantitation of flux (red/yellow puncta per cell): mean ± SEM; N = 4. * = P < 0.05 vs normoxia; # = p < 0.05 vs. control OGD; $ = p < 0.05 vs. control OGD + post-C. mean ± SEM; N = 6. * = p < 0.05 normoxia vs. OGD within groups. # = p < 0.05 for OGD alone vs. OGD + post-C, $ = p < 0.05 for matched groups vs. control (far-left bars of each set)
Figure 13.
Figure 13.
Activating autophagy with Tat-Beclin 1 prevents cell death from OGD in R28 retinal neurons in vitro. (A) Representative flow cytometry histograms, showing that OGD decreased proliferation and Tat-Beclin 1 restored proliferation in cells subjected to OGD. (B) Western blotting indicating the increase in LC3-II and decrease in SQSTM1 in cultures subjected to OGD and treated with Tat-Beclin 1, whereas there was minimal effect in normoxic cultures. (C and D). Bar graphs showing R28 cell proliferation and cell death in groups treated with Tat-Beclin 1 and subjected to OGD. Tat-Beclin 1 robustly attenuated the decreased proliferation (C) and cell death (D) from OGD. mean ± SEM; n = 4 per treatment. * = P < 0.05 normoxic vs OGD; # = P < 0.05 OGD vs OGD +Tat-Beclin 1

References

    1. Duh EJ, Sun JK, Stitt AW.. Diabetic retinopathy: current understanding, mechanisms, and treatment strategies. JCI Insight. 2017;2(14):ii: 93751. - PMC - PubMed
    1. Pardue MT, Allen RS. Neuroprotective strategies for retinal disease. Prog Ret Eye Res. 2018;65:50–76. . - PMC - PubMed
    1. Dreixler JC, Poston JN, Shaikh AR, et al. Delayed post-ischemic conditioning significantly improves the outcome after retinal ischemia. Exp Eye Res. 2011;92(6):521–527. . - PMC - PubMed
    1. Dreixler JC, Sampat A, Shaikh AR, et al. Protein kinase B (Akt) and mitogen-activated protein kinase p38alpha in retinal ischemic post-conditioning. J Mol Neurosci. 2011;45:309–320. - PMC - PubMed
    1. Kadzielawa K, Mathew B, Stelman CR, et al. Gene expression in retinal post-ischemic conditioning. Graef Archiv Clin Exp Ophthalmol. 2018;256:935–949. - PMC - PubMed

Publication types