

The Prevalence of Dyslexia: A New Approach to Its Estimation
- PMID: 32452713
- PMCID: PMC8183124
- DOI: 10.1177/0022219420920377
The Prevalence of Dyslexia: A New Approach to Its Estimation
Abstract
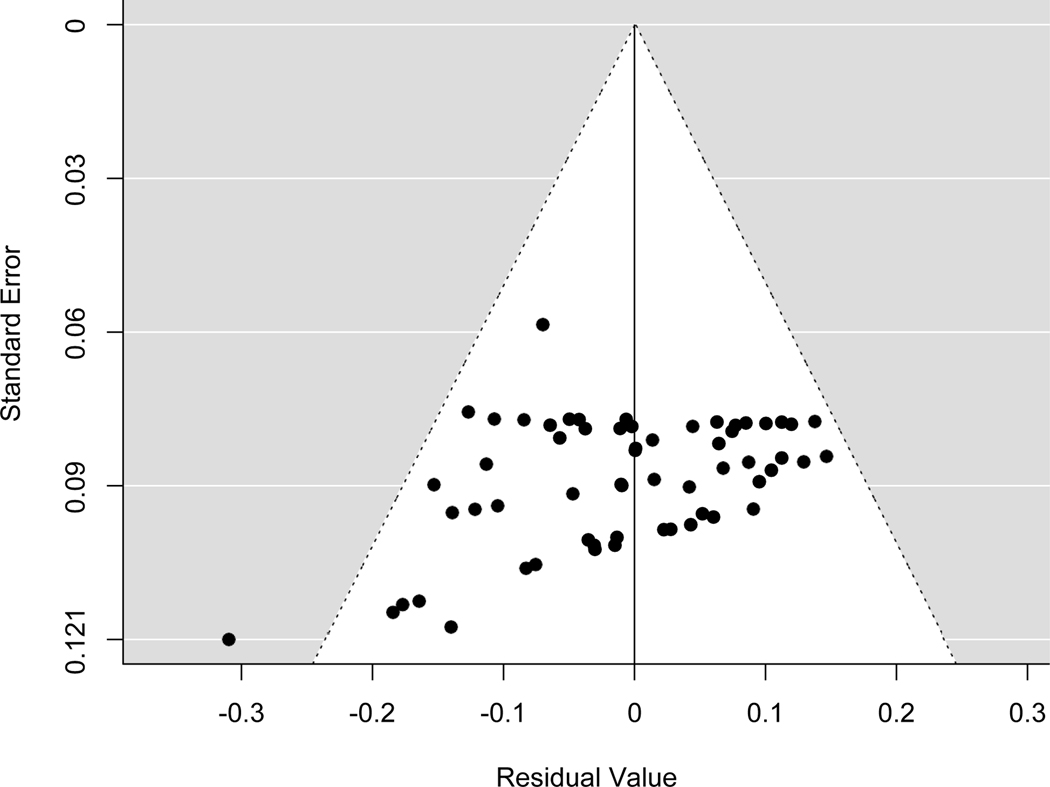
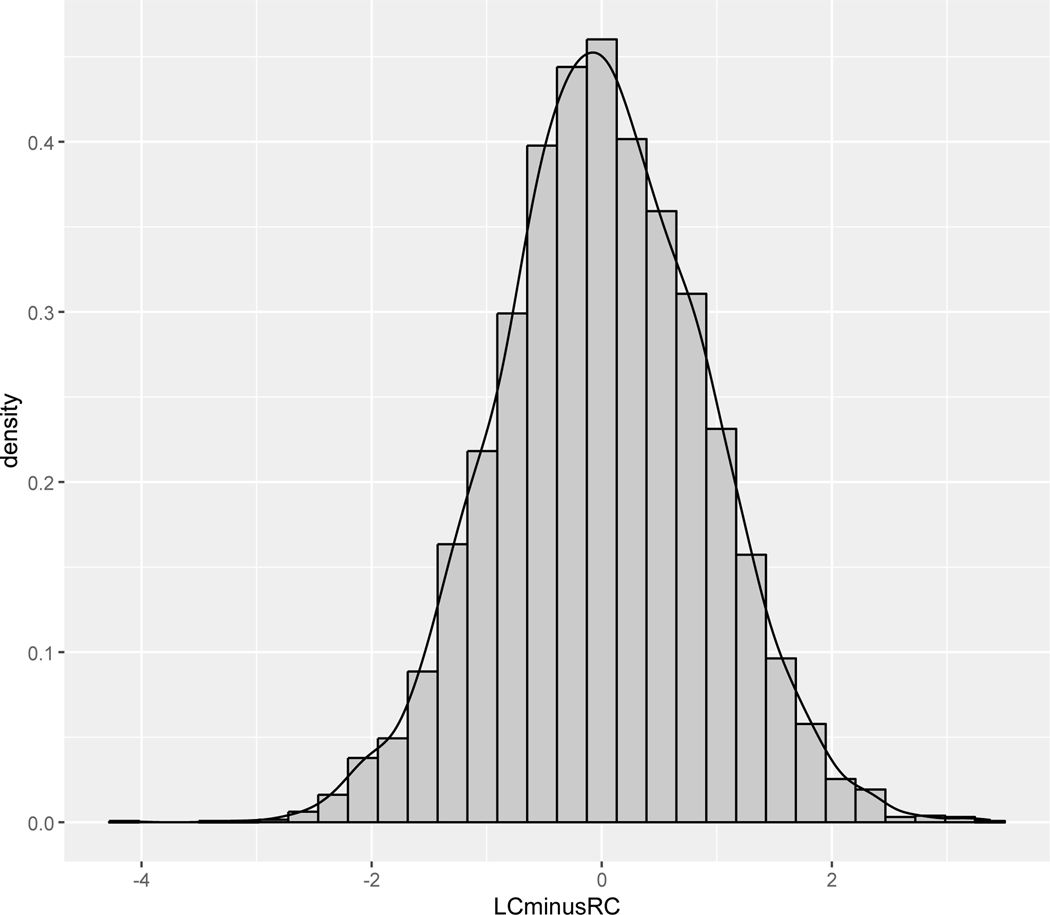
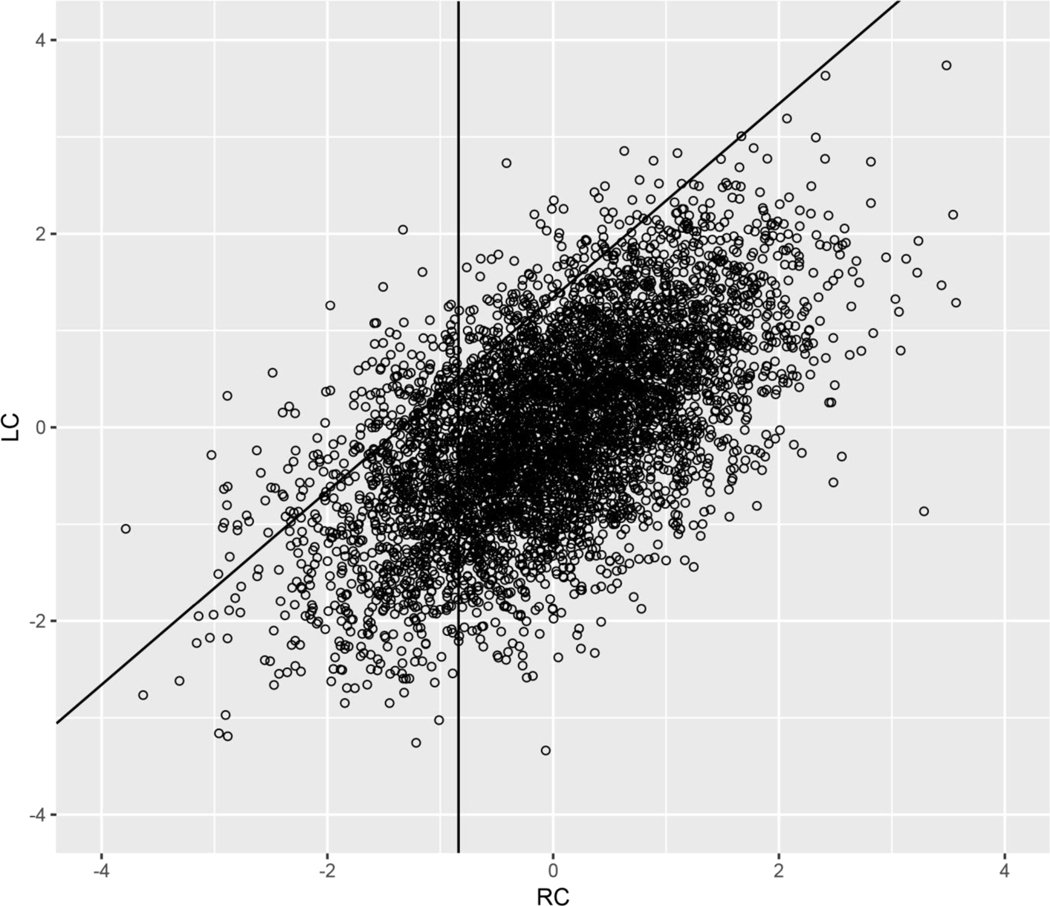
How prevalent is dyslexia? A definitive answer to this question has been elusive because of the continuous distribution of reading performance and predictors of dyslexia and because of the heterogeneous nature of samples of poor readers. Samples of poor readers are a mixture of individuals whose reading is consistent with or expected based on their performance in other academic areas and in language, and individuals with dyslexia whose reading is not consistent with or expected based on their other performances. In the present article, we replicate and extend a new approach for determining the prevalence of dyslexia. Using model-based meta-analysis and simulation, three main results were found. First, the prevalence of dyslexia is better represented as a distribution that varies as a function of severity as opposed to any single-point estimate. Second, samples of poor readers will contain more expected poor readers than unexpected or dyslexic readers. Third, individuals with dyslexia can be found across the reading spectrum as opposed to only at the lower tail of reading performance. These results have implications for screening and identification, and for recruiting participants for scientific studies of dyslexia.
Keywords: Bayesian models; diagnosis; dyslexia; prevalence; reading disability.
Figures
References
-
- Becker BJ, & Aloe AM (2019). Model-based meta-analysis and related approaches. In Cooper HM, Hedges LV, & Valentine JC (Eds.), The handbook of research synthesis and meta-analysis (pp. 339–363). New York: Russell Sage.
-
- Beford-Fuell C, Geiger S, Moyse S, & Turner M. (1995). Use of listening comprehension in the identification and assessment of specific learning difficulties. Educational Psychology in Practice, 10(4), 207–214. https://DOI. 10.1080/0266736950100402 - DOI
Publication types
MeSH terms
Grants and funding
LinkOut - more resources
Full Text Sources
