. 2020 Aug 3;217(8):e20190133.
doi: 10.1084/jem.20190133.

NK cell receptor NKG2D enforces proinflammatory features and pathogenicity of Th1 and Th17 cells

Affiliations

NK cell receptor NKG2D enforces proinflammatory features and pathogenicity of Th1 and Th17 cells

Marina Babic et al. J Exp Med. .

Abstract

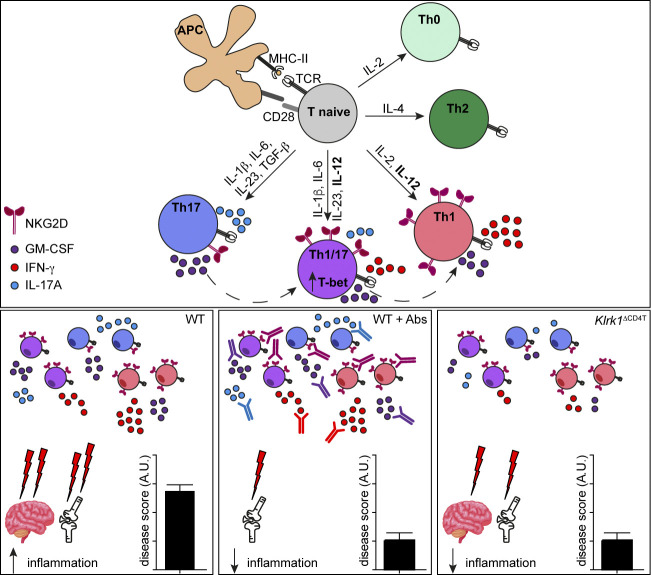
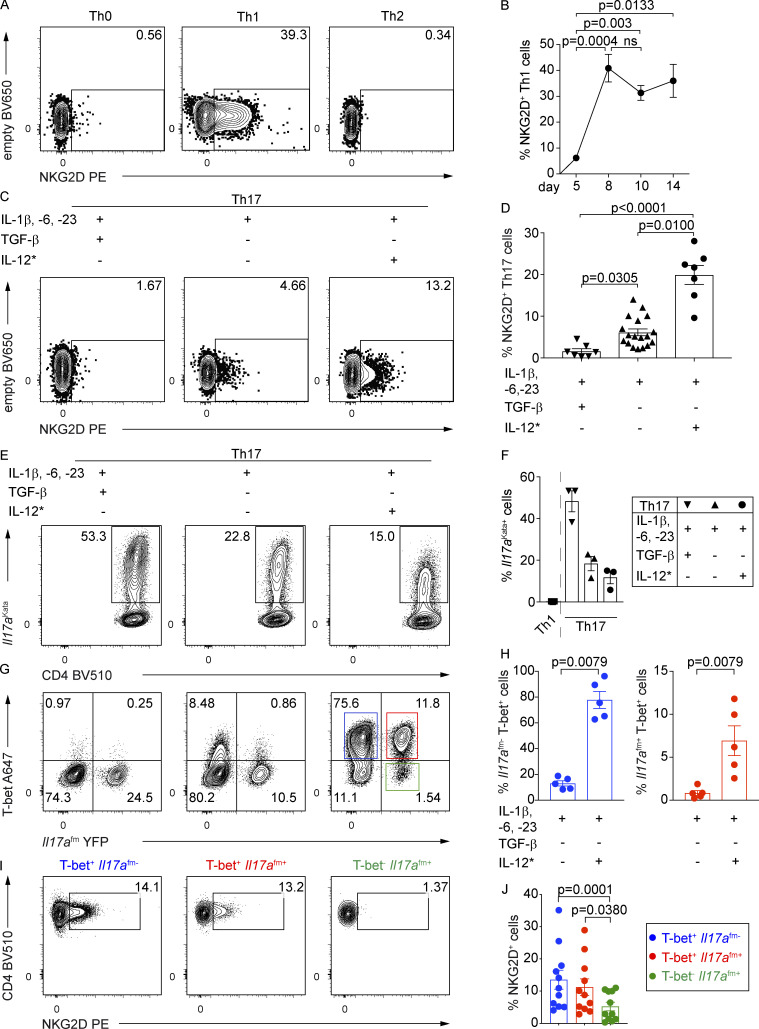
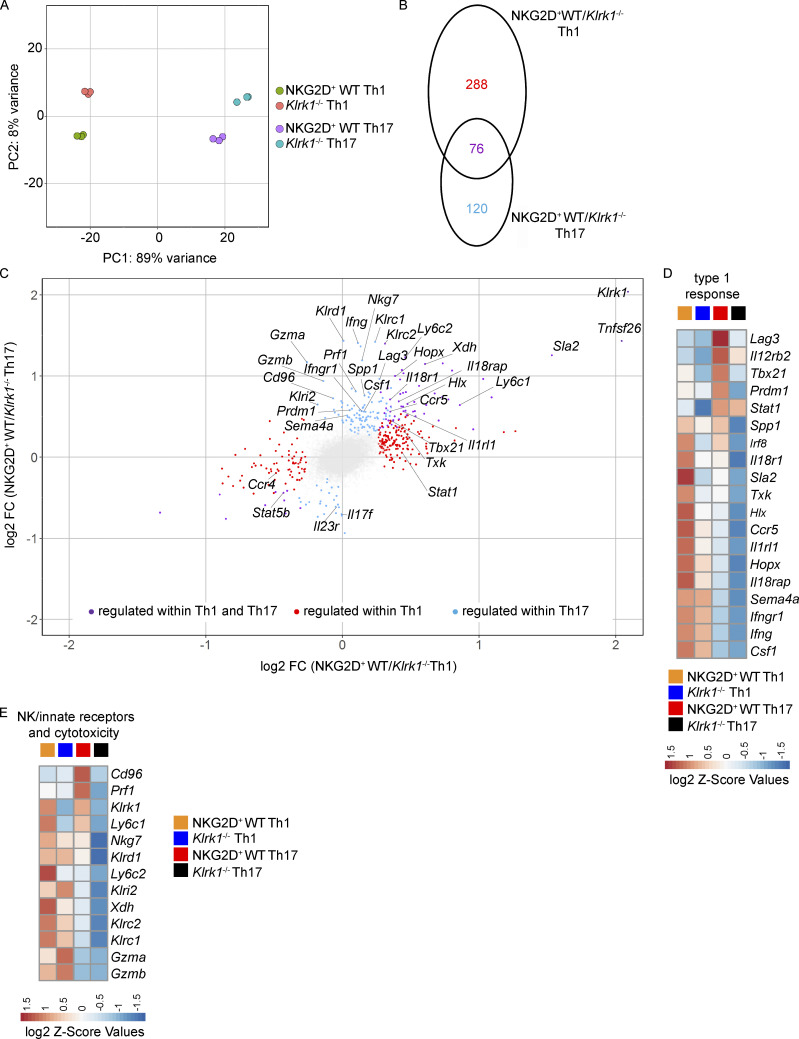
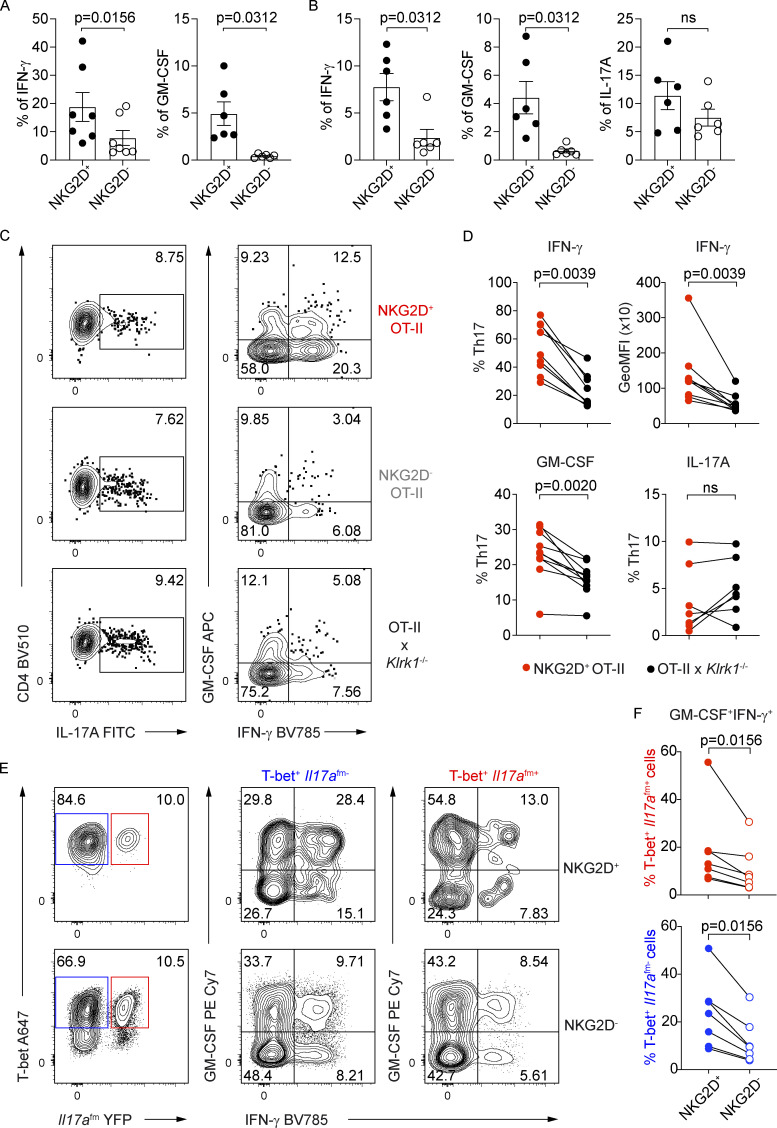
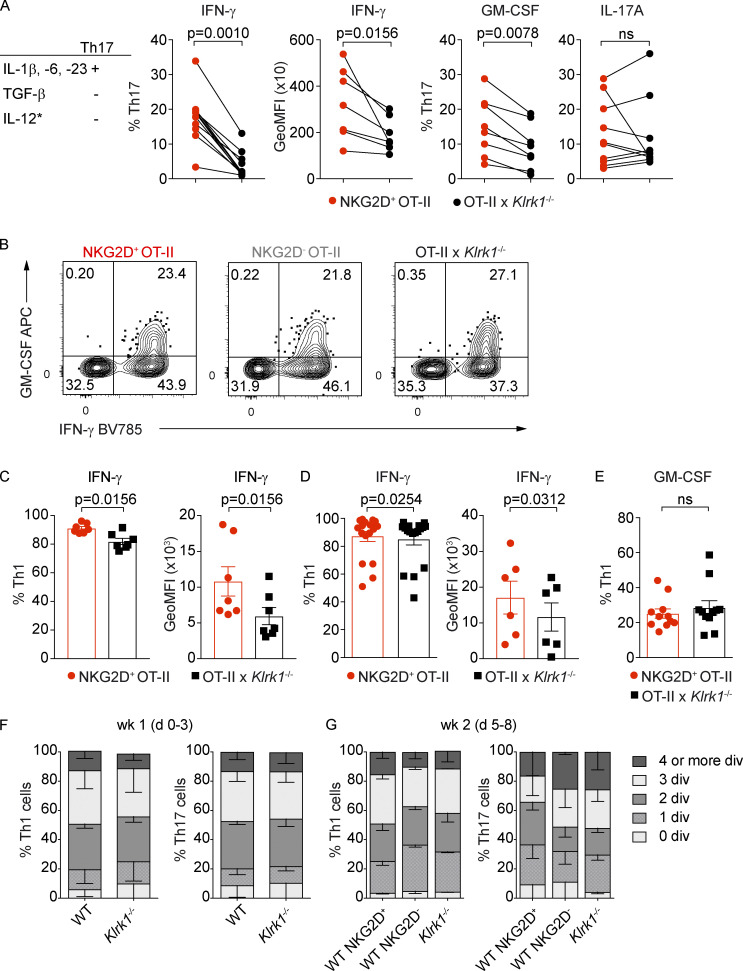
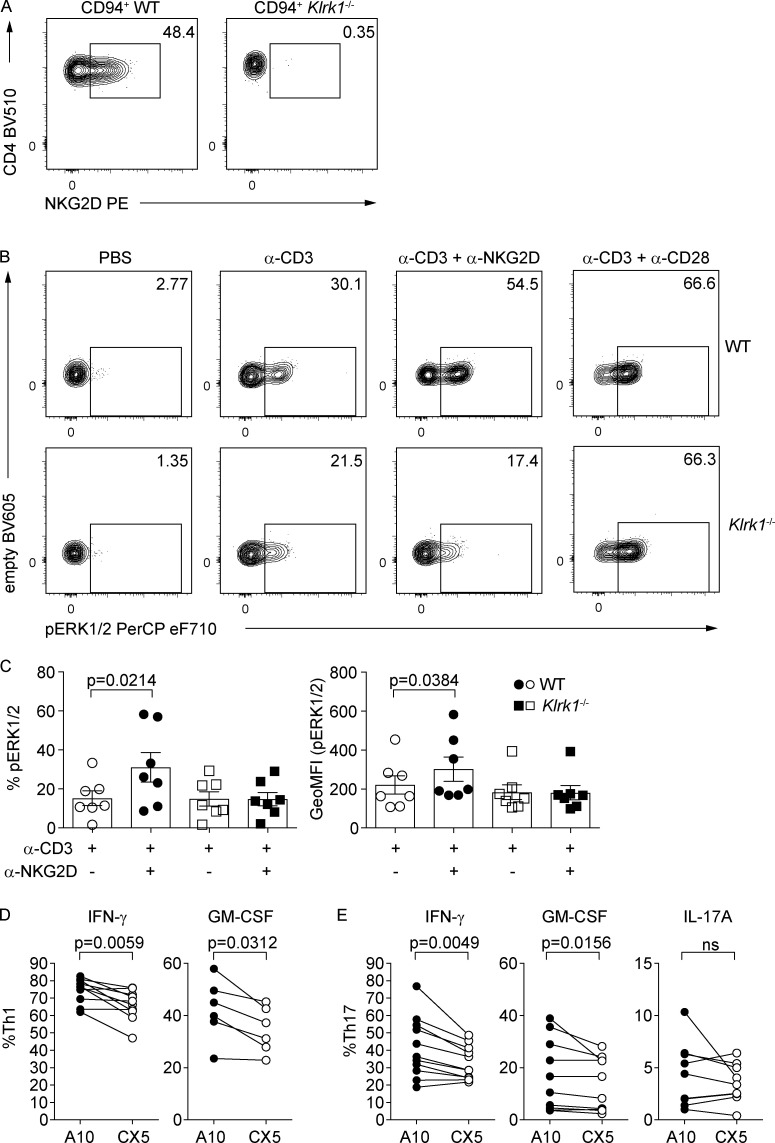
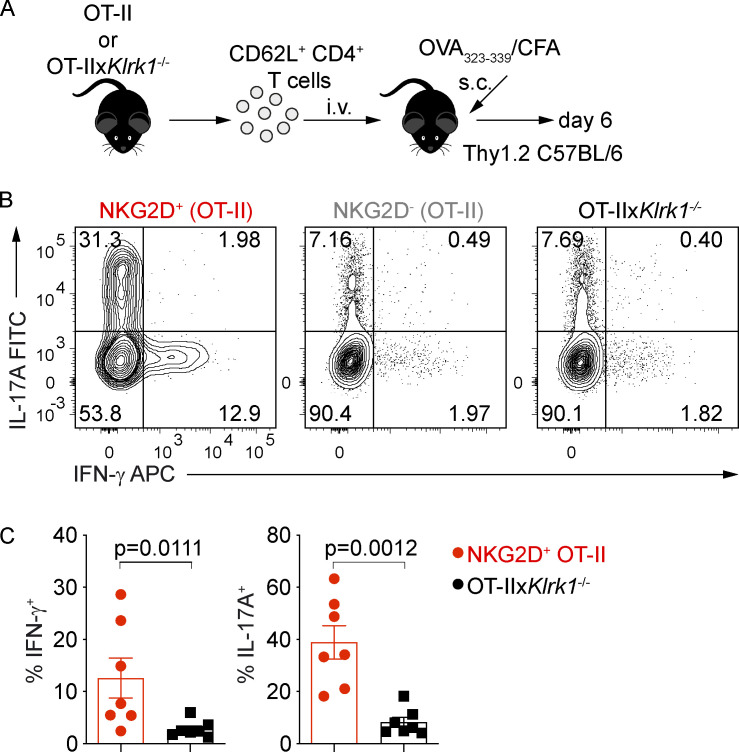
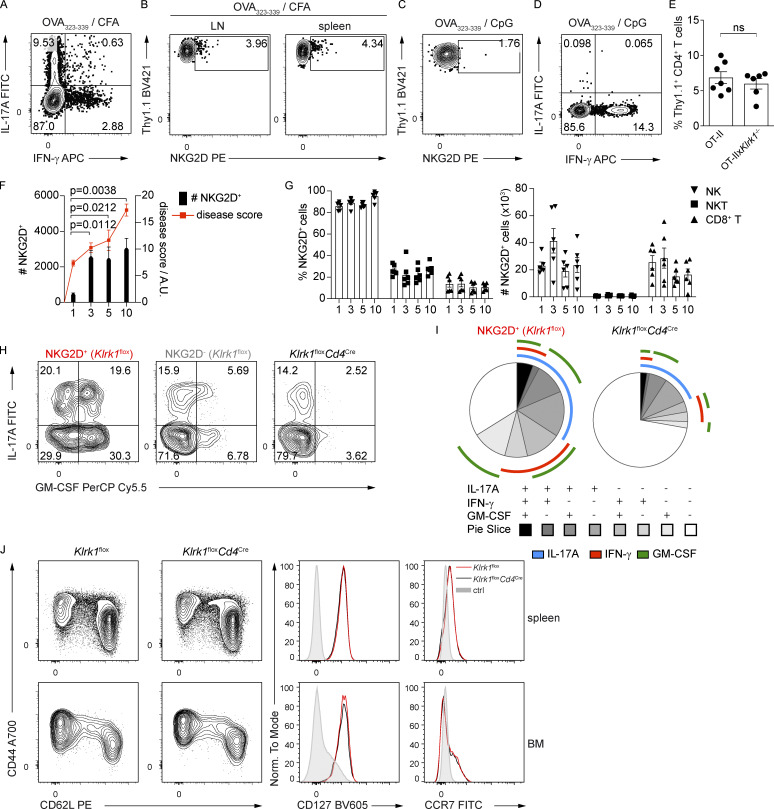
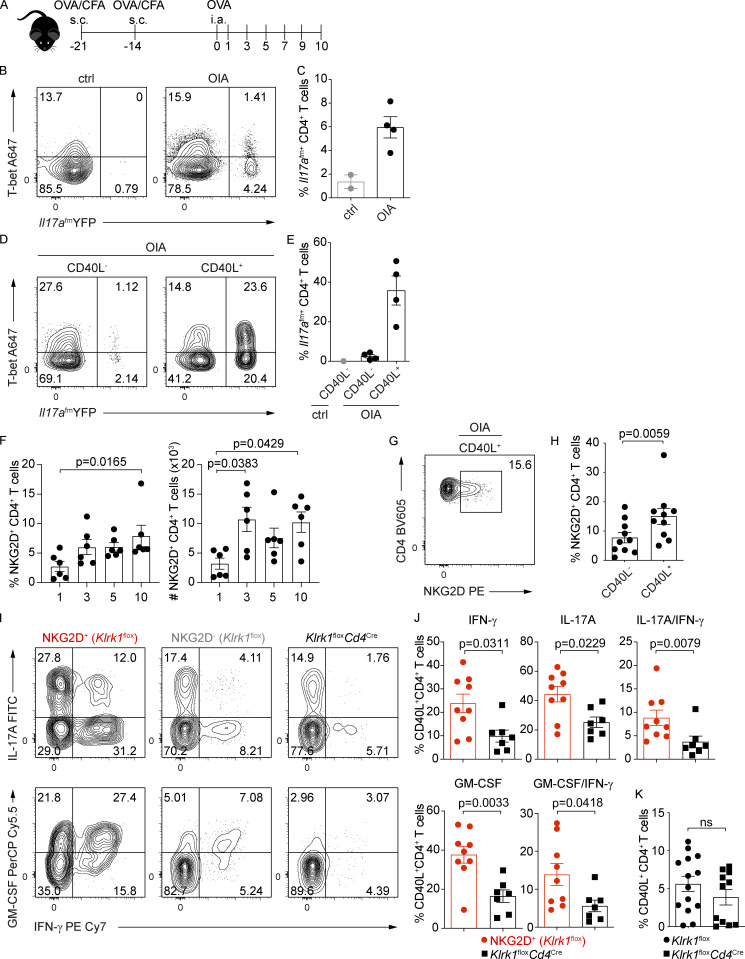
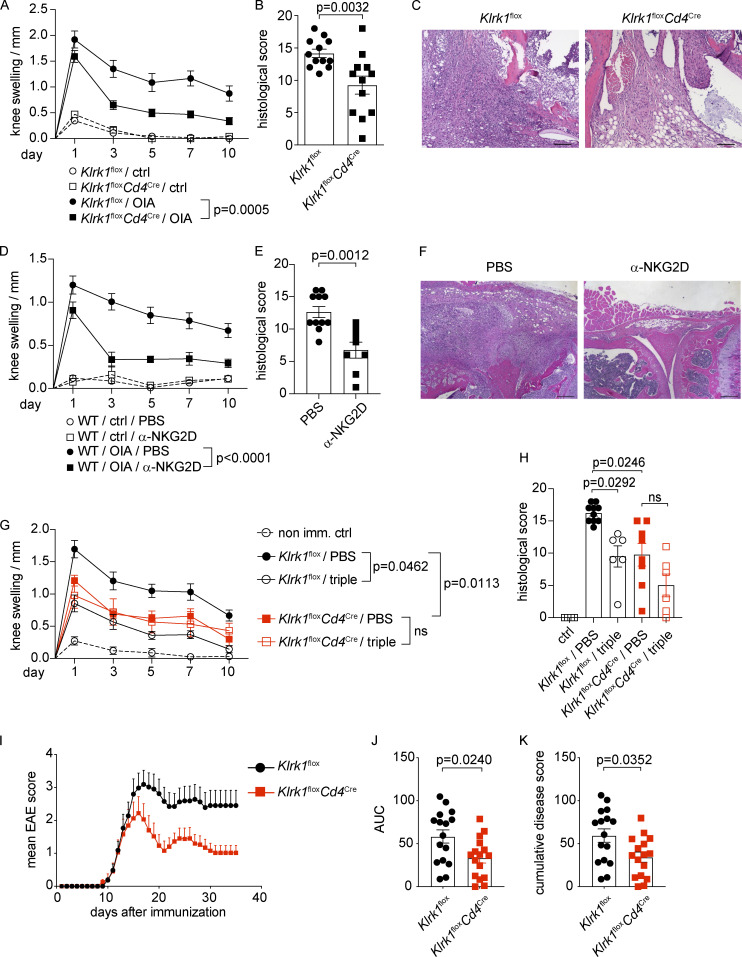
NKG2D is a danger sensor expressed on different subsets of innate and adaptive lymphocytes. Despite its established role as a potent activator of the immune system, NKG2D-driven regulation of CD4+ T helper (Th) cell-mediated immunity remains unclear. In this study, we demonstrate that NKG2D modulates Th1 and proinflammatory T-bet+ Th17 cell effector functions in vitro and in vivo. In particular, NKG2D promotes higher production of proinflammatory cytokines by Th1 and T-bet+ Th17 cells and reinforces their transcription of type 1 signature genes, including Tbx21. Conditional deletion of NKG2D in T cells impairs the ability of antigen-specific CD4+ T cells to promote inflammation in vivo during antigen-induced arthritis and experimental autoimmune encephalomyelitis, indicating that NKG2D is an important target for the amelioration of Th1- and Th17-mediated chronic inflammatory diseases.


Conflict of interest statement

Disclosures: The authors declare no competing interests exist.

Figures

None
Graphical abstract
Figure 1.
Figure 1.
NKG2D is expressed on antigen-experienced CD4+ T cells in steady-state C57BL/6 mice. (A) Representative FC analysis of NKG2D expression on single-cell suspensions from the spleen of C57BL/6 mice. (B) Representative FC analysis of CD44 and CD62L expression on NKG2D+ and NKG2D CD4+ T cells in the spleen. (C) Frequency of CD44+ CD62L T cells; quantification from B; n = 8; Wilcoxon test. (D) Representative FC analysis of NKG2D expression on CD44+ CD4+ T cell from single-cell suspensions of C57BL/6 mice. (E) Frequency of NKG2D+ CD44+ CD4+ T cells in indicated organs, spleen (n = 29), BM (n = 15), siLP (n = 15), colon lamina propria (cLP; n = 7), liver (n = 6), and lung (n = 7). (F and K) Representative FC analysis of CXCR3 (F) and CCR6 (K) expression on CD4+ CD44+ NKG2D (black line) or NKG2D+ (red line) in spleen and siLP, respectively. Shaded histogram represents live CD19+ (F) or live CD8+ (K) cells; n = 6. (G and L) Representative FC analysis of T-bet expression in spleen (G) and RORγt and T-bet expression in siLP (L) in CD4+ CD44+ NKG2D or NKG2D+ T cells. (H and M) Frequency of T-bet+ CD44+ CD4+ T cells in spleen (H), quantification from G (n = 11) and T-bet+ or RORγt+ CD44+ CD4+ T cells in siLP (M), quantification from L (n = 12); Wilcoxon test. ns, not significant. (I) Representative FC analysis of IL18R1 and ZsGreen (Tbx21) expression on CD4+ CD44+ NKG2D and CD4+ CD44+ NKG2D+ in spleen of Tbx21-ZsGreen mice (n = 3). (J) Frequency of splenic NKG2D+ CD44+ CD4+ T cells from WT (n = 15) and Tbx21/ mice (n = 13); Mann–Whitney U test. In C, E, H, J, and M, each symbol represents a mouse, lines represent mean ± SEM, and data are pooled from at least three independent experiments.
Figure S1.
Figure S1.
NKG2D is expressed on antigen-experienced CD4+ T cells in steady-state C57BL/6 mice. (A) FC gating strategy for the characterization of NKG2D+ CD4+ T cells in C57BL/6 mice (spleen shown). Lineage (Lin) includes CD19, FcεRI, Gr-1, and F4/80. (B) Representative FC analysis of indicated surface marker expression on NKG2D+ (red line) and NKG2D (black line) CD44+ CD4+ T cells in the spleen. Shaded histogram represents live CD19+ cells (n = 3). (C) Representative FC analysis of DNAM-1 and CD94 expression on splenic CD4+ CD44+ NKG2D (black line) and CD4+ CD44+ NKG2D+ (red line). Shaded histogram represents live CD19+ cells (n = 6). (D) FC analysis of selected surface marker expression on NKG2D+ (red line) and NKG2D (black line) CD44+ CD4+ T cells in spleen. Shaded histogram represents NK cells (n = 3). (E) Representative FC analysis of NKG2D expression on CD44+ CD4+ T cells from spleen of WT, Tyrobp−/−, Hcst−/−, and Klrk1−/− mice. (F) Frequency of NKG2D+ CD44+ CD4+ T cells, quantification of E. Each symbol represents a mouse; line represents the mean ± SEM (n = 3). Data are pooled from two independent experiments. (G) Representative FC analysis of indicated marker expression on NKG2D+ and NKG2D CD44+ CD4+ T cells in the siLP of Tbx21-ZsGreen mice (n = 3). (H) Representative FC analysis of FoxP3 and CD25 expression on NKG2D+ (red) and NKG2D (gray) CD4+ T cells from the spleen of WT mice (n = 3). In A–D, G, and H, data are representative of at least two independent experiments.
Figure S2.
Figure S2.
NKG2D is induced de novo on naive CD4+ T cells under Th1- and Th17-polarizing conditions. (A) Thy1.2+ OT-II and Thy1.2 OT-IIxKlrk1−/− naive CD4+ T cells were cocultured and polarized toward different Th lineages as described in Materials and methods. (B) Frequency of NKG2D+ Th1 cells generated from WT (α-CD3) or OT-II (OVA323–339) mice in the presence or absence of APCs. Data shown are mean ± SEM, n = 15 (pCD3), n = 6 (sCD3/APC), and n = 16 (OVA323–339/APC). (C) Frequency of NKG2D+ Th1 cells in response to increasing doses of OVA323–339. Data shown are mean ± SEM; line connects the mean (n = 5). (D) Frequency of NKG2D+ Th1 cells in response to increasing doses of IL-12. Data shown are mean ± SEM (n = 6). (E) Frequency of NKG2D+ Th1 cells derived from WT or Stat4−/− mice in response to increasing doses of α-CD3. Mean ± SEM is shown; line connects the means (n = 3). (F) Frequency of NKG2D+ CD4+ T cells after gating on CXCR3+ CD44+ population. Each symbol represents a mouse. Data shown are mean ± SEM; n = 6 (WT) and n = 5 (Stat4−/−). Mann–Whitney U test. ns, not significant. (G) Frequency of NKG2D+ Th17 polarized as indicated, at different time points of the culture. Data show mean ± SEM (n = 3–7). Asterisk (*) indicates that IL-12 was added in the second week of the culture. (H) Frequency of NKG2D+ Th17 polarized as indicated. Data show mean ± SEM (n = 7). (I) qPCR analysis of Tbx21 expression in Th1 and Th17 cells sorted as NKG2D+ or Klrk1−/− cells and in naive CD4+ T cells. Values are normalized to housekeeping genes Eef1a1 and Ube2g1. Each symbol represents an individual culture. Data show mean ± SEM; n = 10 (Th1), n = 12 (Th17; -TGF-β), and n = 3 (Th17; -TGF-β + IL-12*). (J) Representative FC analysis of CD94 expression on NKG2D+ and Klrk1−/− Th1 or Th17 (-TGF-β + IL-12*) cells on day 10 of culture (n = 6). (K) qPCR analysis of Rorc expression in Th1 and Th17 cells sorted as NKG2D+ or Klrk1−/− cells and in naive CD4+ T cells. Values are normalized to housekeeping genes Eef1a1 and Ube2g1. Each symbol represents an individual culture. Data show mean ± SEM; n = 10 (Th1), n = 11 (Th17; -TGF-β), and n = 3 (Th17; -TGF-β + IL-12*). In A–K, data are representative of at least three independent experiments.
Figure 2.
Figure 2.
NKG2D is induced de novo on naive CD4+ T cells under Th1- and Th17-polarizing conditions. (A) Representative FC analysis of NKG2D expression on Th0, Th1, or Th2 cells on day 10 of culture (n = 6). (B) Frequency of NKG2D+ Th1 cells, differentiated using plate-bound α-CD3 stimulation, at indicated time points of the polarizing culture. Data shown are mean ± SEM (n = 5–15), Kruskal–Wallis test with multiple comparison correction. ns, not significant. (C) Representative FC analysis of NKG2D expression on Th17 cells, polarized as indicated, on day 10. Asterisk (*) indicates that IL-12 was added in the second week of culture. (D) Frequency of NKG2D+ Th17 cells, polarized as indicated, as measured on day 8 or 10 of culture; black inverted triangle (n = 7), black triangle (n = 18), and black circle (n = 7). Each symbol represents an individual culture replicate; lines represent mean ± SEM. Kruskal–Wallis test with multiple comparison correction. (E and F) Representative FC analysis (E) and frequency of Il17aKata expression in Th17 cells (F), from Il17afm(YFP) × Il17aKata double reporter mice–derived naive CD4+ T cells, polarized as indicated, at day 10 of culture (n = 3). Each symbol represents an individual culture replicate; lines represent mean ± SEM. (G) Representative FC analysis of T-bet and Il17a(fm)YFP expression in Th17 cells, polarized as in E. (H) Frequency of Il17afm-T-bet+ and Il17afm+T-bet+ cells among Th17 cells polarized as indicated (n = 5). Data shown as mean ± SEM; Mann–Whitney U test. (I) Representative FC analysis of NKG2D expression in Th17 cell subsets, polarized with IL-1β, IL-6, IL-23, and IL-12*, indicated in G; blue square, T-bet+fm; red square, T-bet+fm+; green square, T-betfm+ cells. (J) Frequency of NKG2D+ Th17 cells, quantification of I. Each symbol represents an individual culture replicate; data shown as mean ± SEM (n = 11). Kruskal–Wallis test with multiple comparison correction. In A–J, data are pooled from at least three independent experiments.
Figure 3.
Figure 3.
NKG2D is associated with reinforced type 1 response gene signature in in vitro–generated Th1 and Th17 cells. (A–E) Transcriptome analysis of Th1 and Th17 (IL-1β, -6, -23, and IL-12*) cells sorted as NKG2D+ or Klrk1−/−. (A) Principal component analysis of Th cell subsets based on differentially expressed genes for each of the comparisons (filtered for padj < 0.05, Mann–Whitney U test). Each dot represents an independent culture (n = 3). (B and C) Venn diagram showing number of transcripts (filtered for padj < 0.05; B) and scatter plot showing transcripts of genes differentially expressed in NKG2D+ and Klrk1−/− cells (filtered for padj < 0.05 and FC >1.2; C) preferentially in Th1 (red), Th17 (blue), or both Th1 and Th17 lineages (purple). Gray dots represent the genes below the selected threshold. (D and E) Z-score heat maps showing relative expression of selected genes in the four T cell subsets. Selected genes are filtered for padj < 0.05 and FC >1.2 in at least one comparison.
Figure 4.
Figure 4.
NKG2D+ Th17 and Th1 cells are enriched in IFN-γ and GM-CSF producers. (A and B) Frequency of IFN-γ+ and GM-CSF+ CD44+ CD4+ T cells in spleen (A) and of IFN-γ+, GM-CSF+, and IL-17A+ CD44+ CD4+ T cells in siLP (B) of C57BL/6 mice (n = 6–7), Wilcoxon test. Each symbol represents a mouse; lines represent mean ± SEM; data are pooled from at least three independent experiments. (C) Representative FC analysis of intracellular cytokine expression in Th17 cells, polarized with IL-1β, IL-6, IL-23, or IL-12*, on day 10 after sorting for NKG2D+ OT-II, NKG2D OT-II, and OT-IIxKlrk1−/− and PMA/Iono restimulation. (D) Frequency of indicated cytokine-producing cells and per-cell content of IFN-γ among Th17 cells, quantification of C. GeoMFI, geometric mean fluorescence intensity; ns, not significant. (E) Representative FC analysis of Il17afm(YFP), T-bet, and intracellular cytokine expression in NKG2D+ and NKG2D Th17 cells, polarized as in C. (F) Frequency of Th17 cell subsets, expressing indicated cytokines, quantification of E. In D and F, each symbol represents the individual culture replicate; lines connect matching samples from individual cocultures (n = 7–10); Wilcoxon test. Data are pooled from at least three independent experiments.
Figure S3.
Figure S3.
NKG2D modulates the cytokine production of CD4+ Th cells in vitro. (A) Frequency of indicated cytokine-producing cells and per-cell content of IFN-γ among Th17 polarized with IL-1β, IL-6, or IL-23. Each symbol represents the individual coculture replicate; line connects matching samples (n = 7–10); Wilcoxon test. Data are pooled from at least three individual experiments. GeoMFI, geometric mean fluorescence intensity. (B) Representative FC analysis of intracellular cytokine expression in Th1 cells on day 10 after sorting for NKG2D+ OT-II, NKG2D OT-II, and OT-IIxKlrk1−/− and PMA/Iono restimulation. (C and D) Frequency of IFN-γ+ and per-cell content of IFN-γ in NKG2D+ (red) and Klrk1−/− (black) 1-wk (C) or 2-wk (D) differentiated Th1 cells. Each symbol represents an individual culture; line represents mean ± SEM, n = 7 (C), n = 17 (%), or 6 (GeoMFI; D). Wilcoxon test. Data are pooled from at least three individual experiments. (E) Frequency of GM-CSF+ among NKG2D+ (red) and Klrk1−/− (black) Th1 cells. Each symbol represents an individual culture from at least three independent experiments; line represents mean ± SEM; n = 10. (F and G) Frequency of cells undergoing 0, 1, 2, 3, 4, and more divisions (div.) among WT and Klrk1−/− Th1 or Th17 cells (day 3) or among NKG2D+ WT, NKG2D WT and Klrk1−/− Th1 or Th17 cells (day 8). Th17 cells were polarized as in A. Data shown are mean ± SEM; n = 3; pooled from at least two independent experiments.
Figure 5.
Figure 5.
NKG2D signaling promotes IFN-γ and GM-CSF expression. (A) Representative FC analysis of NKG2D on WT or Klrk1−/− Th1 cells after gating on CD94+ cells on day 10 of culture. (B) Representative FC analysis of ERK1/2 phosphorylation after antibody cross-linking of CD3, CD3 and NKG2D (clone A10), or CD3 and CD28 in WT and Klrk1−/− Th1 cells. (C) Frequency of pERK1/2+ Th1 cells (left) and per-cell content (right) of pERK1/2, quantification of B. Data shown are pooled from individual cocultures; line shows mean ± SEM (n = 7); Friedman test with Dunn´s multiple comparison test. GeoMFI, geometric mean fluorescence intensity. (D and E) Th1 and Th17 (IL-1β, IL-6, IL-23, or IL-12*) cells were sorted as NKG2D+ using A10 (activating; black circles) or CX5 (blocking; open circles) α-NKG2D antibody, cross-linked by plate-bound secondary antibody in the presence of α-CD3 for 6 h, and analyzed by FC for intracellular cytokine expression. Frequency of IFN-γ+ (n = 10) and GM-CSF+ Th1 (n = 6; D) and IFN-γ+ (n = 11), GM-CSF+ (n = 10), and IL-17A+ (n = 9) Th17 (E). Each symbol represents the value of the individual coculture; lines connect matching samples; Wilcoxon test. ns, not significant. Data are pooled from at least three independent experiments.
Figure 6.
Figure 6.
NKG2D marks proinflammatory Th17 cells in vivo. (A) Schematic representation of the experimental workflow during antigen/adjuvant immunizations. (B and C) Representative FC analysis (B) and quantification of intracellular cytokine expression (C) in transferred OT-II cells gated as NKG2D+ and NKG2D, or Klrk1−/− OT-II cells, from draining lymph nodes of recipient mice at day 6 after immunization with OVA323–339/CFA and after restimulation with PMA/Iono. Each symbol represents a mouse. Line represents mean ± SEM (n = 7), Mann–Whitney U test. Data are pooled from two independent experiments.
Figure S4.
Figure S4.
NKG2D modulates the cytokine production in CD4+ T cells in vivo and promotes immunopathology in antigen-induced arthritis. (A) Representative FC analysis of intracellular cytokine expression in transferred OT-II cells, from draining lymph nodes of recipient mice at day 6 after immunization with OVA323–339/CFA and after restimulation with PMA/Iono (n = 7). Data are representative of two independent experiments. (B) Representative FC analysis showing NKG2D expression on transferred WT OT-II+ CD4+ T cells 6 d after OVA323–339/CFA immunization, n = 7. Data are representative of two independent experiments. (C and D) Representative FC analysis of NKG2D expression (C) and intracellular cytokine expression (D) in OT-II+ CD4+ T cells in dLN after OVA323–339/CpG immunization (n = 5). Data are representative of two independent experiments. (E) Frequency of recovered OT-II and OT-IIxKlrk1−/− transferred cells, from dLN of recipient mice at day 6 after immunization with OVA323–339/CFA. Data show mean ± SEM; n = 7 (OT-II) and 6 (OT-IIxKlrk1−/−). ns, not significant. Data are pooled from two independent experiments. (F) Graph representing absolute numbers of NKG2D+ CD40L+ CD4+ T cells (black bars) in the dLN of mice and histological disease score (red dots) in the knee joints of mice at indicated time points after arthritis induction. Bar graph data are mean ± SEM (n = 6), Kruskal–Wallis test; red line connects means of score values (n = 6). Data are pooled from two independent experiments. A.U., arbitrary units. (G) Frequency and absolute numbers of NKG2D-expressing cells analyzed on indicated cell subsets from dLN during the course of OIA; data represent mean ± SEM; n = 6 for each time point. Data are pooled from two independent experiments. (H) Representative FC analysis of intracellular cytokine expression in OVA-restimulated NKG2D+ and NKG2D CD40L+ CD4+ T cells in Klrk1flox mice and CD40L+ CD4+ T cells in Klrk1floxCd4Cre mice from dLN at day 10 after the OIA induction. Data are representative of three independent experiments. (I) SPICE charts depict combinatorial expression of IL-17A, IFN-γ, and GM-CSF in NKG2D+ CD40L+ CD4+ T cells in dLN of Klrk1flox mice and CD40L+ CD4+ T cells in Klrk1floxCd4Cre mice, at day 10 after OIA induction (n = 9, Klrk1flox; n = 7, Klrk1floxCd4Cre). Data are pooled from two independent experiments. (J) Representative FC analysis of CD44, CD62L, CD127, and CCR7 expression on CD4+ T cells from the spleen and BM of Klrk1flox (red line) and Klrk1floxCd4Cre (black line) mice. Shaded histogram represents live CD19+ cells (n = 3). Data are representative of two independent experiments.
Figure 7.
Figure 7.
NKG2D-expressing antigen-specific CD4+ T cells accumulate in vivo during OIA. (A) Schematic representation of the experimental workflow during OIA. Mice were s.c. immunized with catOVA/CFA. Disease was induced with i.a. injection of catOVA (OIA). Control animals received only i.a. injection of catOVA (ctrl). Cells from draining LN were analyzed on day 10 after disease induction and after in vitro restimulation with catOVA. (B and C) Representative FC analysis (B) and quantification of the frequency of Il17a(fm)+ cells among CD44+ CD4+ T cells (C) in control and OIA animals 10 d after disease induction. (D and E) Representative FC analysis (D) and quantification of the frequency of Il17a(fm)+ cells (E) among CD44+ CD40L CD4+ T cells in control and CD44+ CD40L and CD44+ CD40L+ CD4+ T cells in OIA animals 10 d after disease induction. In C and E, each symbol represents an individual mouse; data shown as mean ± SEM; n = 2 for control and n = 4 for OIA animals. Data are pooled from two independent experiments. (F) Frequency and absolute numbers of NKG2D+CD44+CD4+ T cells in the dLN of mice with OIA at indicated time points after disease induction. Data show mean ± SEM from two independent experiments (n = 6); Kruskal–Wallis test with multiple comparison correction. (G) Representative FC analysis of NKG2D expression on CD44+ CD40L+ CD4+ T cells from Klrk1flox mice 10 d after disease induction. (H) Frequency of NKG2D-expressing CD44+ CD4+ T cells among indicated subsets in mice with OIA (n = 10); Wilcoxon test. Line shows mean ± SEM pooled from three independent experiments. (I and J) Representative FC analysis (I) and quantification of intracellular cytokine expression in NKG2D+ and NKG2D CD40L+ CD4+ T cells of Klrk1flox mice (n = 9) and CD40L+ CD4+ T cells from Klrk1floxCd4Cre mice (n = 7; J); Mann–Whitney U test. Each symbol represents an individual mouse; data show mean ± SEM from three independent experiments. (K) Frequency of CD40L+ CD4+ T cells in Klrk1flox (n = 14) and Klrk1floxCd4Cre (n = 11) mice; Mann–Whitney U test. ns, not significant. Each symbol represents an individual mouse; data show mean ± SEM from three independent experiments.
Figure 8.
Figure 8.
NKG2D promotes immunopathology in antigen-induced arthritis and EAE. (A–H) C57BL/6, Klrk1flox or Klrk1floxCd4Cre were s.c. immunized with catOVA/CFA. Disease was induced with i.a. injection of catOVA (OIA). Control animals received only i.a. injection of catOVA (ctrl). (A) Knee swelling measurement analysis at indicated time points after induction of the disease (n = 12). (B) Disease score analysis in arthritis-induced mice 10 d after induction of the disease (n = 12); Mann–Whitney U test. (C) Representative H&E staining of the knee joint area. Scale bar 100 µm. (D and E) Knee swelling measurement analysis (D) and disease score analysis (E) in PBS-treated (n = 11) or α-NKG2D blocking antibody–treated (n = 8) arthritis-induced C57BL/6 mice 10 d after induction of the disease; Mann–Whitney U test. (F) Representative H&E staining of the knee joint area. Scale bar 200 µm. (G and H) Knee swelling measurement analysis (G) and disease score analysis (H) in PBS-treated or α-IL-17A/α-GM-CSF/α-IFN-γ blocking antibody–treated arthritis-induced Klrk1flox (n = 10/6) or Klrk1floxCd4Cre (n = 8/6) mice; Kruskal–Wallis test with multiple comparison test. In A, D, and G: ctrl, nonimmunized mice; OIA, OVA/CFA immunized (imm.) mice; value for each individual mouse is a difference in the knee thickness between the injected and noninjected knee. Data show mean ± SEM, pooled from at least two independent experiments. Two-way ANOVA with multiple comparison test. ns, not significant. In B, E, and H, each symbol represents an individual mouse; lines represent mean ± SEM. Data are pooled from at least two individual experiments. (I–K) Clinical scores of EAE in Klrk1flox or Klrk1floxCd4Cre mice (n = 16), Mann–Whitney U test. AUC, area under the curve. Data are pooled from three independent experiments.

References

    1. Allez M., Tieng V., Nakazawa A., Treton X., Pacault V., Dulphy N., Caillat-Zucman S., Paul P., Gornet J.M., Douay C., et al. 2007. CD4+NKG2D+ T cells in Crohn’s disease mediate inflammatory and cytotoxic responses through MICA interactions. Gastroenterology. 132:2346–2358. 10.1053/j.gastro.2007.03.025 - DOI - PubMed
    1. Andersson A.K., Sumariwalla P.F., McCann F.E., Amjadi P., Chang C., McNamee K., Tornehave D., Haase C., Agersø H., Stennicke V.W., et al. 2011. Blockade of NKG2D ameliorates disease in mice with collagen-induced arthritis: a potential pathogenic role in chronic inflammatory arthritis. Arthritis Rheum. 63:2617–2629. 10.1002/art.30460 - DOI - PubMed
    1. Babic M., and Romagnani C.. 2018. The Role of Natural Killer Group 2, Member D in Chronic Inflammation and Autoimmunity. Front. Immunol. 9:1219 10.3389/fimmu.2018.01219 - DOI - PMC - PubMed
    1. Bakker A.B., Hoek R.M., Cerwenka A., Blom B., Lucian L., McNeil T., Murray R., Phillips L.H., Sedgwick J.D., and Lanier L.L.. 2000. DAP12-deficient mice fail to develop autoimmunity due to impaired antigen priming. Immunity. 13:345–353. 10.1016/S1074-7613(00)00034-0 - DOI - PubMed
    1. Bending D., De la Peña H., Veldhoen M., Phillips J.M., Uyttenhove C., Stockinger B., and Cooke A.. 2009. Highly purified Th17 cells from BDC2.5NOD mice convert into Th1-like cells in NOD/SCID recipient mice. J. Clin. Invest. 119:565–572. 10.1172/JCI37865 - DOI - PMC - PubMed

Publication types

MeSH terms