. 2020 Sep 25;48(17):9886-9898.
doi: 10.1093/nar/gkaa439.

Native de novo structural determinations of non-canonical nucleic acid motifs by X-ray crystallography at long wavelengths

Affiliations

Native de novo structural determinations of non-canonical nucleic acid motifs by X-ray crystallography at long wavelengths

Yashu Zhang et al. Nucleic Acids Res. .

Abstract

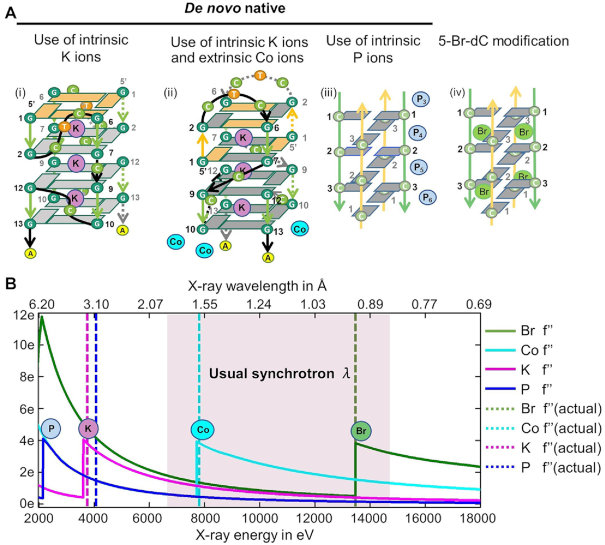
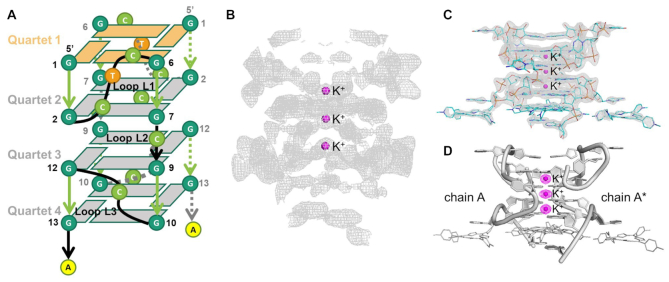
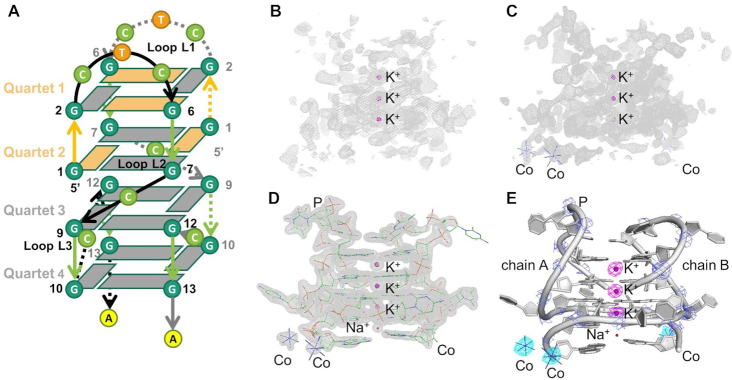
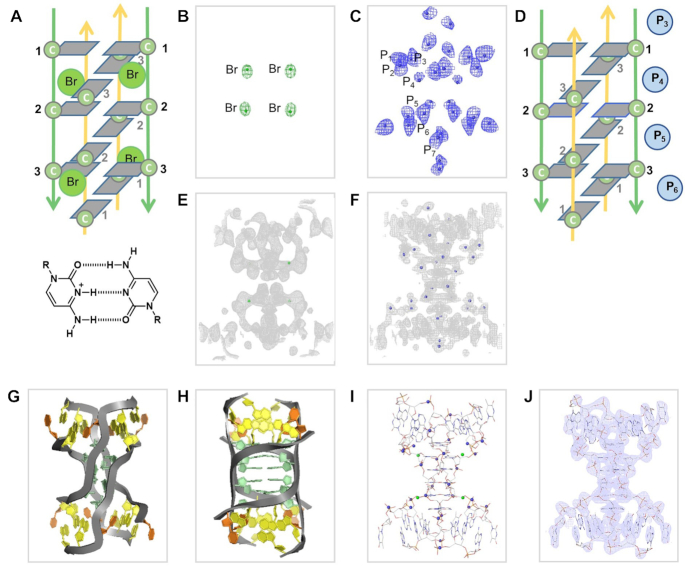
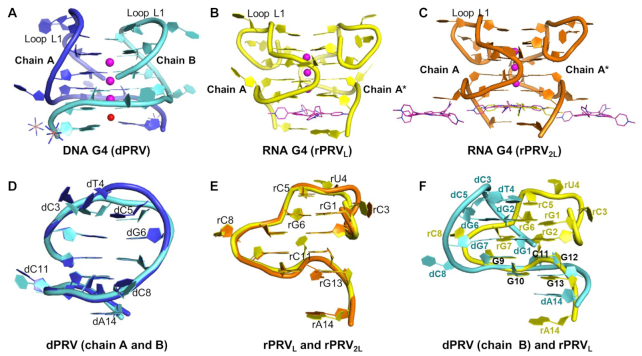
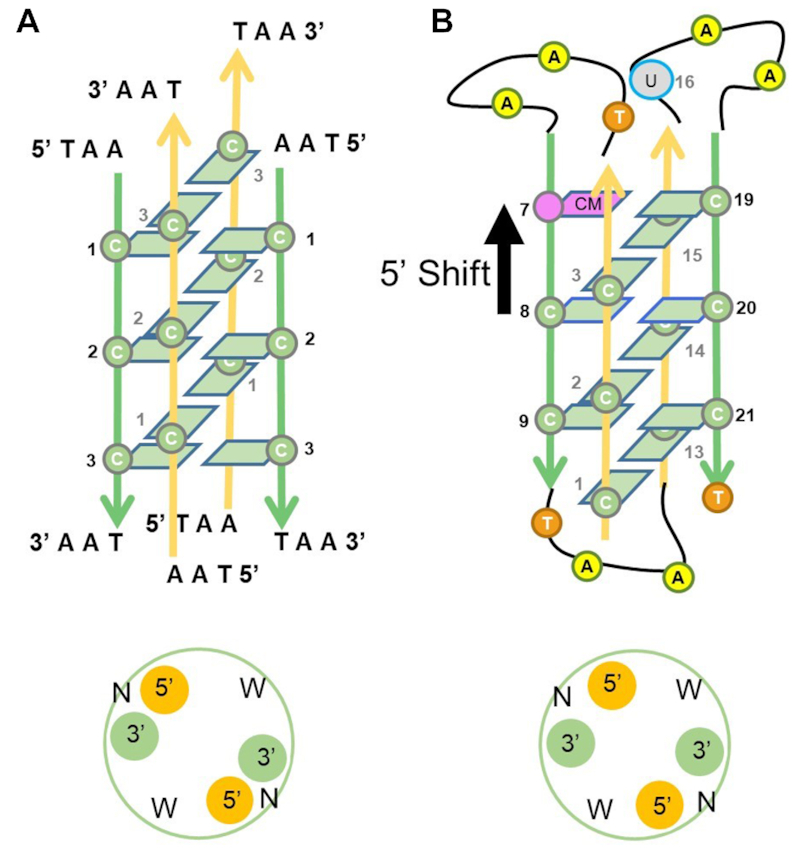
Obtaining phase information remains a formidable challenge for nucleic acid structure determination. The introduction of an X-ray synchrotron beamline designed to be tunable to long wavelengths at Diamond Light Source has opened the possibility to native de novo structure determinations by the use of intrinsic scattering elements. This provides opportunities to overcome the limitations of introducing modifying nucleotides, often required to derive phasing information. In this paper, we build on established methods to generate new tools for nucleic acid structure determinations. We report on the use of (i) native intrinsic potassium single-wavelength anomalous dispersion methods (K-SAD), (ii) use of anomalous scattering elements integral to the crystallization buffer (extrinsic cobalt and intrinsic potassium ions), (iii) extrinsic bromine and intrinsic phosphorus SAD to solve complex nucleic acid structures. Using the reported methods we solved the structures of (i) Pseudorabies virus (PRV) RNA G-quadruplex and ligand complex, (ii) PRV DNA G-quadruplex, and (iii) an i-motif of human telomeric sequence. Our results highlight the utility of using intrinsic scattering as a pathway to solve and determine non-canonical nucleic acid motifs and reveal the variability of topology, influence of ligand binding, and glycosidic angle rearrangements seen between RNA and DNA G-quadruplexes of the same sequence.


Figures

Figure 1.
Figure 1.
Data collected at the different element edge can be used to determine phases for G4 and i-motif structures. (A) Folding topology observed for G4 (i and ii) and i-motif (iii and iv) structures determined together highlighting anomalous scattering elements used in this investigation. (B) Calculated anomalous contribution f″ to the scattering factor as function of energy at the K+ and Co K-absorption edge of DNA G4 (dPRV), at the K+ K-absorption edge of RNA G4 with ligand (rPRV2L), and the Br and near K-absorption edge that includes P of i-motif (tel-i-motif). Dashed lines represent the wavelengths at which datasets were collected.
Figure 2.
Figure 2.
Schematic and ribbon images showing the HA locations and subsequent anomalous difference map, initial SAD map calculated using positions of the anomalous scatters, together with density-modification procedures, and 2Fobs– Fcalc maps, for rPRV2L. (A) Overall topology with direction of backbone, parallel (green) and anti-parallel (orange), and glycosidic torsion angles anti- (gray) and syn- (orange) highlighted. (B) SAD map, in gray (2σ), based on phases derived from HA positions determined from K+ ions, (C) 2Fo – Fc map, contoured at 2σ, shows the accuracy of the anomalous difference measurements. (D) Ribbon diagram crystal structure rPRV2L with chain A and chain B shown as cartoon style (gray), overlain composite of K+ (Fanom(calc) map (magenta, 2σ, 3.7 keV)).
Figure 3.
Figure 3.
Schematic and ribbon images showing the HA locations and subsequent anomalous difference map (Fanom(calc)), initial SAD map calculated using positions of the anomalous scatters, together with density-modification procedures, and 2Fobs – Fcalc maps for dPRV. (A) Overall topology with direction of backbone, parallel (green) and anti-parallel (orange), and glycosidic torsion angles anti- (gray) and syn- (orange) highlighted. (B) SAD map in gray (1.5σ) based on phases derived from HA positions determined from K+ ions, (C) SAD map (gray, 1.5σ) based on phases derived from HA positions determined from Co3+ and K+ ions. (D) (2Fo – Fc) map contoured at 2σ shows the accuracy of the data collected on beamline I23. (E) Ribbon diagram of dPRV crystal structure with chain A and chain B shown as cartoon style (gray) and K+ ions (magenta), Co (III) hexamine (cyan), Na+ ions (red) and P (blue) atoms as small spheres. Strong anomalous difference peaks corresponding to the K+ (magenta, 2σ, 3.7 keV), Co3+ (cyan, 2σ, 7.8 keV) ions and P (blue, 2σ, 3.7 keV) atoms.
Figure 4.
Figure 4.
Schematic and ribbon images showing the HA locations and subsequent anomalous difference Fourier (Fanom(calc)) maps, initial SAD map calculated using positions of the anomalous scatters, together with density-modification procedures, and 2Fobs– Fcalc maps, for tel-i-motif. Overall topology with direction of backbone, parallel (green) and anti-parallel (yellow), and glycosidic torsion angles anti- (gray) and syn- (orange) highlighted. (A) Positions of C3Br substitutions within the tel-i-motif. (B) Fanom(calc) map (green) showing Br heavy atoms, 13.47 keV data (Br absorption edge). (C) Fanom(calc) map (blue) showing P atoms positions, 4.01 keV data. (D) Schematic showing P atoms within tel-i-motif. (E) SAD map in gray (2σ) based on phases derived from Br positions. (F) SAD map in gray (2σ) based on phases derived from P positions. (g-h) Ribbon images showing overall tel-i-motif topology, backbone (gray), cytosine (green), adenine (yellow), thymine (orange). (I) Stick representation showing phosphorus scattering positions (blue) and bromine (green). (J) Final 2Fobs– Fcalc maps, for tel-i-motif and final model.
Figure 5.
Figure 5.
Comparison of PRV RNA and DNA structures drawn as cartoons. (A) DNA G4 (dPRV), (B) RNA G4 (rPRVL), (C) RNA G4 (rPRV2L), (D) Structure alignment of dPRV between chains A and B, (E) Structure alignment between rPRVL and rPRV2L, (F) Structure alignment between dPRV (chain B) and rPRVL. Potassium ions are shown as magenta spheres. Sodium ion is shown as red sphere. Chains A and B are shown as different colors. TMPyP4 ligands are shown as magenta sticks and brown for the alternative conformations.
Figure 6.
Figure 6.
Comparison of topologies between the X-ray determined one-repeat d(TAACCCTAA) (tel-i-motif) and the NMR determined four-repeat human telomeric modified sequence d(CCCTAA(5mC) CCTAACCCUAACCCT), folded as an i-motif (1EL2). Direction of backbone shown parallel (green), and anti-parallel (yellow). (A) Changes in groove widths are shown with strand orientations, Narrow (N) and Wide (W). (B) Sequence mutations are shown with cytosine to 5-methylcytosine substitution (pink), at position 7, and the thymine to uracil substitution (gray), at position 16. The arrow indicates a shift of C:C+ base pairs in the 5′ direction.

References

    1. Cammas A., Millevoi S.. RNA G-quadruplexes: emerging mechanisms in disease. Nucleic Acids Res. 2017; 45:1584–1595. - PMC - PubMed
    1. Niu K., Zhang X., Deng H., Wu F., Ren Y., Xiang H., Zheng S., Liu L., Huang L., Zeng B. et al. .. BmILF and i-motif structure are involved in transcriptional regulation of BmPOUM2 in Bombyx mori. Nucleic Acids Res. 2018; 46:1710–1723. - PMC - PubMed
    1. Tucker W.O., Shum K.T., Tanner J.A.. G-quadruplex DNA aptamers and their ligands: structure, function and application. Curr. Pharm. Des. 2012; 18:2014–2026. - PubMed
    1. Abou A.H., Garavis M., Gonzalez C., Damha M.J.. i-Motif DNA: structural features and significance to cell biology. Nucleic Acids Res. 2018; 46:8038–8056. - PMC - PubMed
    1. Wang Y., Patel D.J.. Solution structure of a parallel-stranded G-quadruplex DNA. J. Mol. Biol. 1993; 234:1171–1183. - PubMed

Publication types