. 2020 Sep;9(9):498-508.
doi: 10.1002/psp4.12514. Epub 2020 Jul 8.

Importance of Stability Analysis When Using Nonlinear Semimechanistic Models to Describe Drug-Induced Hematotoxicity

Affiliations

Importance of Stability Analysis When Using Nonlinear Semimechanistic Models to Describe Drug-Induced Hematotoxicity

Chiara Fornari et al. CPT Pharmacometrics Syst Pharmacol. 2020 Sep.

Abstract

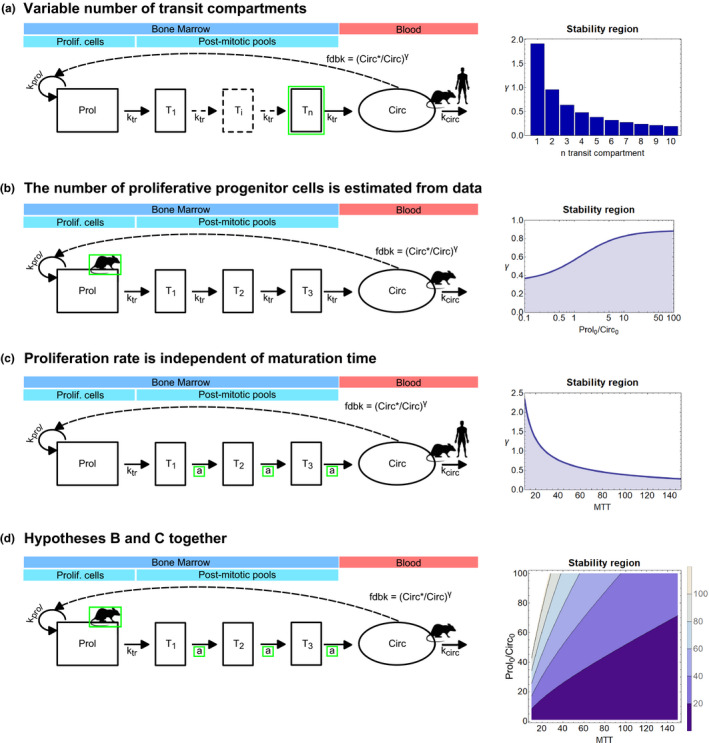
Stability analysis, often overlooked in pharmacometrics, is essential to explore dynamical systems. The model developed by Friberg et al.1 to describe drug-induced hematotoxicity is widely used to support decisions across drug development, and parameter values are often identified from observed blood counts. We use stability analysis to study the parametric dependence of stable and unstable solutions of several Friberg-type models and highlight the risks associated with system instability in the context of nonlinear mixed effects modeling. We emphasize the consequences of unstable solutions on prediction performance by demonstrating nonbiological system behaviors in a real case study of drug-induced thrombocytopenia. Ultimately, we provide simple criteria for identifying parameters associated with stable solutions of Friberg-type models. For instance, in the original Friberg model, we find that stability depends only on the parameter that governs the feedback from peripheral cells to progenitors and provide the exact range of values that results in stable solutions.


Conflict of interest statement

C.F., C.P., J.W.T.Y., J.T.M., and T.A.C. are AstraZeneca employees. J.W.T.Y., T.A.C., and C.P. are shareholders of AstraZeneca. All other authors declared no competing interests for this work.

Figures

Figure 1
Figure 1
Schematic representation of the semimechanistic model of drug‐induced bone marrow toxicity developed by Friberg et al. 1 The rat and the human symbols that are superimposed to the variable representing the circulating cells in the blood show that the model can be applied to both clinical and preclinical data sets where drug‐induced myelosuppression is quantified by peripheral cell counts. Circ, circulating cells in the blood; fdbk, feedback; k circ, rate of clearance from blood; k prol, proliferation rate; k tr, maturation rate; Prol, proliferative cells; Prolif, proliferative; T1, Transit_1 cells; T2, Transit_2 cells; T3, Transit_3 cells.
Figure 2
Figure 2
The stability of the homeostatic equilibrium X* (Eq. 3) of the Friberg model 1 changes according to the values of the parameter γ that governs the feedback from the peripheral blood cells to the bone marrow progenitors values. Bifurcation diagram: on crossing the bifurcation point γ*, the homeostatic steady state (solid black line) becomes unstable (dotted black line), and a family of periodic limit cycle solutions appears (solid red and green lines show the maximum and minimum of the oscillations, respectively, in the log scale) (a). γ* is called a supercritical Hopf bifurcation point, and it is characterized by a change in stability of the steady state X* as γ crosses the bifurcation line. This bifurcation plot was generated with the Oscill8 Dynamical Systems Toolset. 14 Circulating cells over time (b). Phase plane showing circulating cells vs. proliferative cells (c). Each number (1–3) corresponds to a different value of the parameter γ, and plots can be grouped in the following three scenarios: b1–c1 γ < γ*, stable homeostatic equilibrium: Oscillations from the steady state decay quickly over time and an open trajectory converging to the equilibrium point appears in the phase plane. b2–c2 γ ~ γ*: A small amplitude limit cycle solution is born in the vicinity of the stable homeostatic equilibrium. b3–c3 γ > γ*, unstable homeostatic equilibrium: Growing oscillations wind away from the steady state, but they are attracted by stable limit cycles, resulting in periodic oscillations over time, which correspond to a close trajectory in the phase plane. The values of the model parameters used to generate trajectories are the following: baseline of 1 × 109 cells/L (Circ*), mean transit time of 125 hours, no drug effect, and γ values are reported above each plot. Initial conditions for the number of circulating cells (Circ): 0.2 × 109 cells/L while all the other variables were set equal to Circ* (1 × 109 cells/L) at time 0. Initial conditions are illustrated by the blue point in each phase plane plot, and they correspond to small perturbations of the steady state. Circ, circulating cells in the blood.
Figure 3
Figure 3
Stability regions of drug‐induced cytopenia models that were built on the original Friberg model. 1 The first column shows model diagrams, and the stability regions are on the right. Within each diagram, modifications from the classical Friberg model 1 are highlighted in green. Also, the data required to parameterize each model are identified by the rat or human symbol, and they are superimposed to the corresponding type of cells. Model A: Variable number of transit compartments. Model B: The number of proliferative progenitor cells is estimated from the data. Model C: Proliferation rate is independent of maturation time. Model D: Hypotheses from models B and C together. More details on these models and their stability regions are reported in Table  1 . Circ, circulating cells in the blood; fdbk, feedback; k circ, rate of clearance from blood; k prol, proliferation rate; k tr, maturation rate; MTT, mean transit time; Prol, proliferative cells; Prolif, proliferative; Ti, Transit_i cells; TN, Transit_N cells; T1, Transit_1 cells; T2, Transit_2 cells; T3, Transit_3 cells.
Figure 4
Figure 4
Simulations of AZD5153‐induced thrombocytopenia with an unstable model result in unreliable predictions. Two AZD5153 dosing regimens were simulated: 1.5 mg/kg daily for 10 days (first column) and 1 mg/kg twice daily, 3 days on, 4 days off (second column). Blue points represent AZD5153 data, 24 whereas black lines show model simulations converging to the homeostatic equilibrium (continuous line, γ = 0.4) and to the limit cycle (dotted line, γ = 0.72), respectively. Predictions are shown for the same doses and time points as in the observed data (a). Predictions are shown for the same doses tested in the preclinical studies but over a longer time period than the one sampled in the data (b). Simulations generated with γ = 0.72 do not converge to the homeostatic equilibrium, i.e., system homeostasis is lost. Predictions are shown of repeated cycles of treatments that represent new and untested regimens (c). Simulations generated with γ = 0.72 predicted exacerbated toxicity, but this is only a consequence of the oscillatory nature of the trajectories, which are attracted by a stable limit cycle and therefore do not converge to the homeostatic equilibrium. Parameter values used in the simulations are reported in Table  2 . All simulations started with baseline values for all cell populations (i.e., at the homeostatic equilibrium). b.i.d., twice a day; Plt, platelets; q.d., one a day.

References

    1. Friberg, L.E. , Henningsson, A. , Maas, H. , Nguyen, L. & Karlsson, M.O. Model of chemotherapy‐induced myelosuppression with parameter consistency across drugs. J. Clin. Oncol. 20, 4713–4721 (2002). - PubMed
    1. Strogatz, S.H. Nonlinear Dynamics and Chaos (Avalon Publishing, New York, 2016).
    1. Kuznetsov, Y.A. Elements of Applied Bifurcation Theory (Springer, New York, 1998).
    1. Murray, J.D. Mathematical Biology: I. An Introduction, 3rd edn (Springer, New York, 2002).
    1. Murray, J.D. Mathematical Biology II: Spatial Models and Biomedical Applications (Springer, New York, 2003).

MeSH terms

Substances