. 2020 Jun 18;5(12):e136059.
doi: 10.1172/jci.insight.136059.

Mesenchymal stromal cells induce distinct myeloid-derived suppressor cells in inflammation

Affiliations

Mesenchymal stromal cells induce distinct myeloid-derived suppressor cells in inflammation

Hyun Ju Lee et al. JCI Insight. .

Abstract

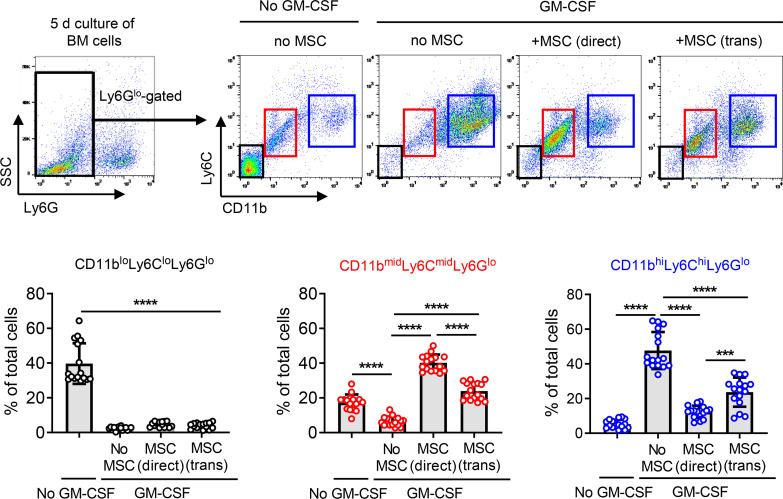
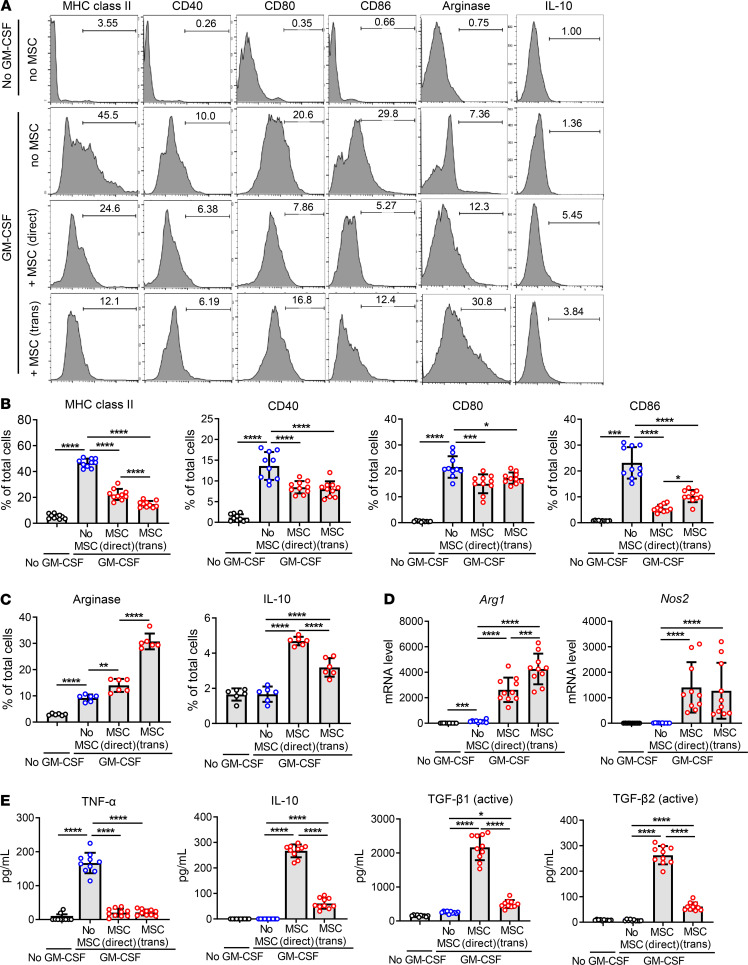
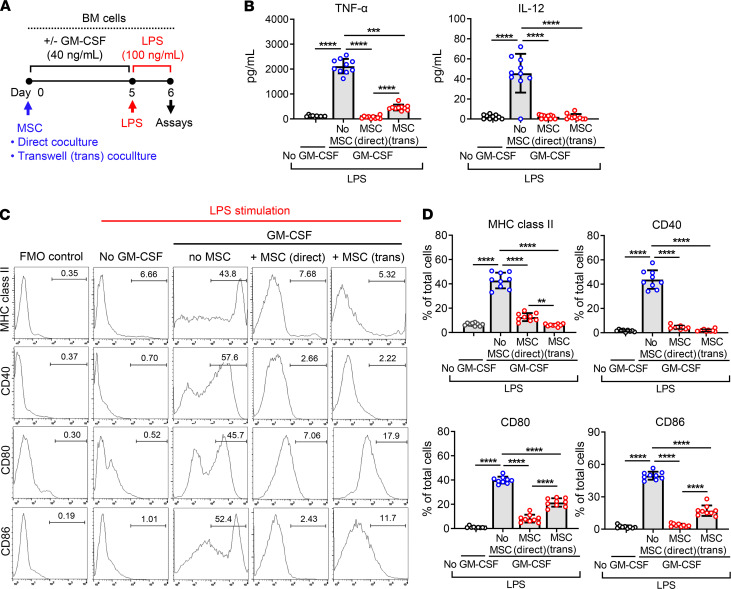
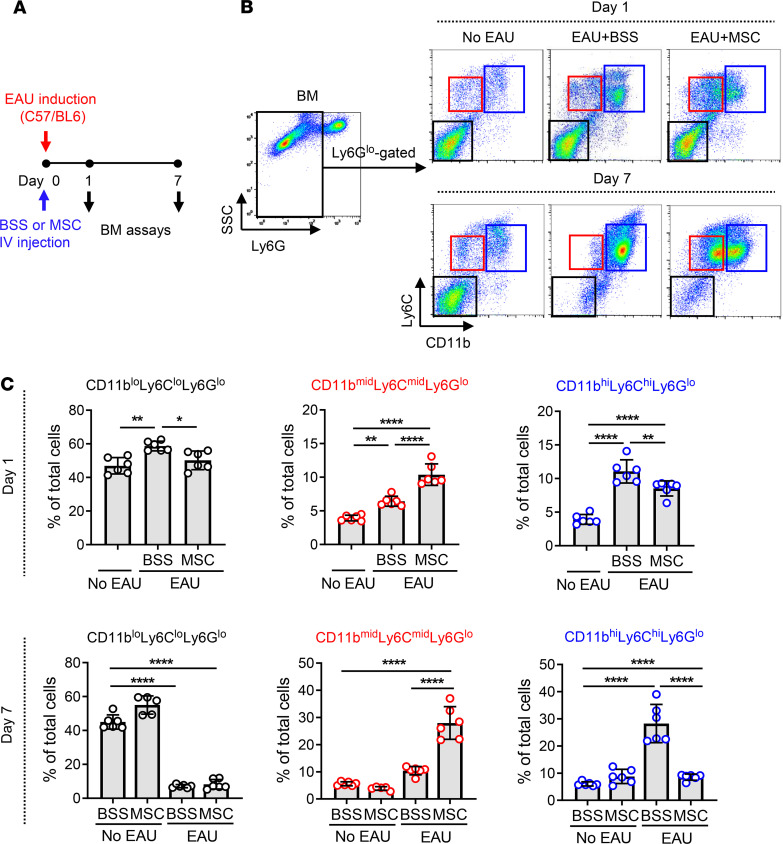
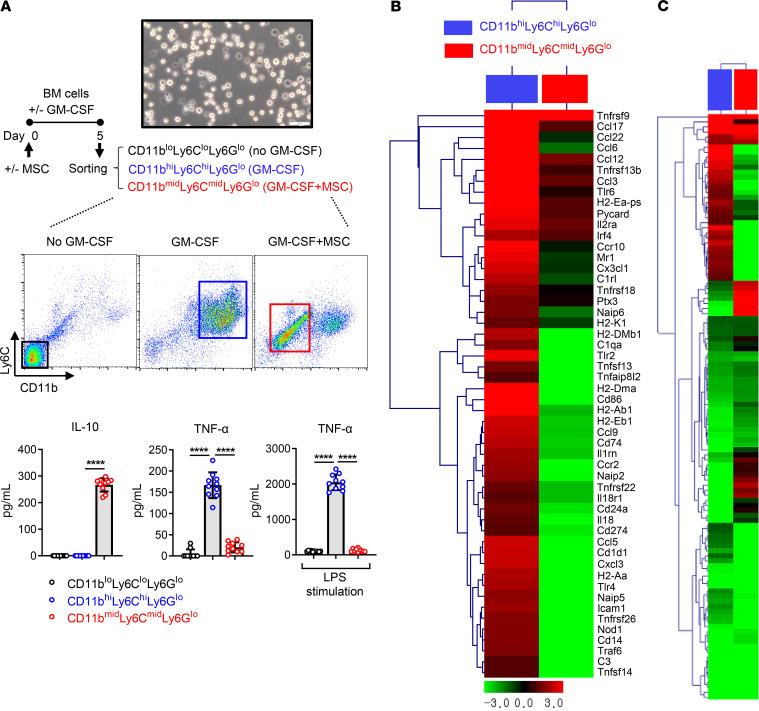
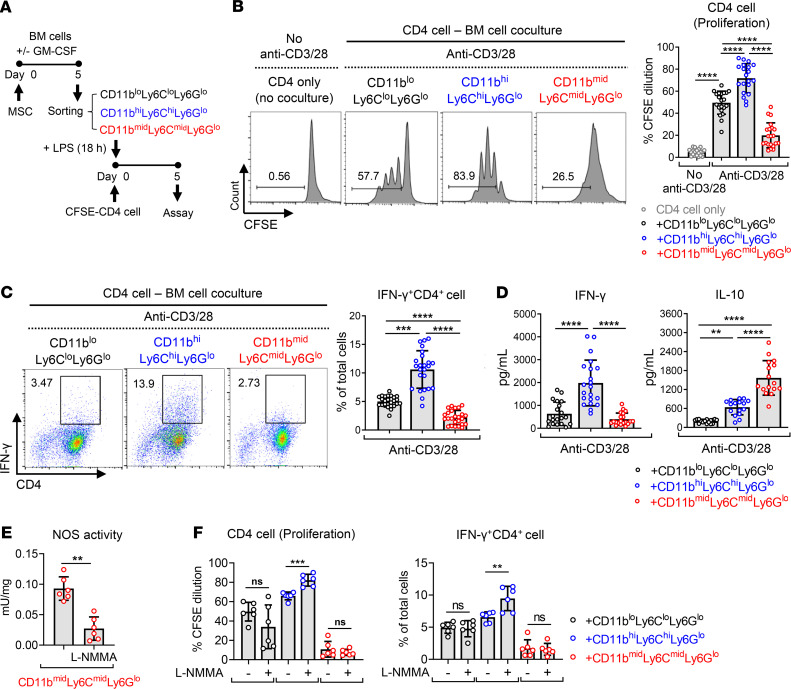
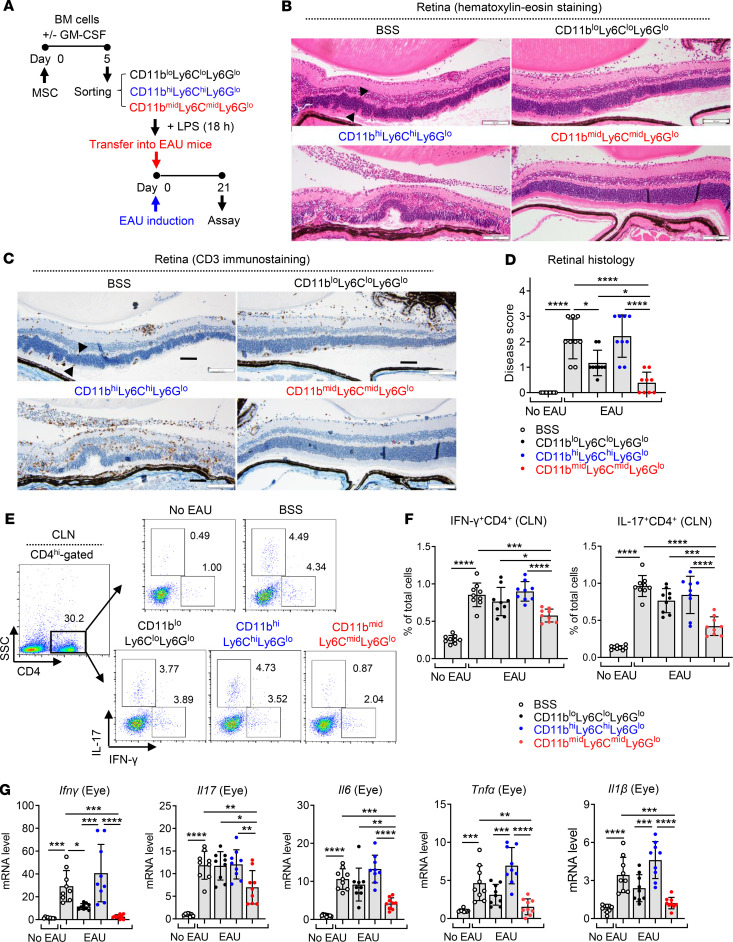
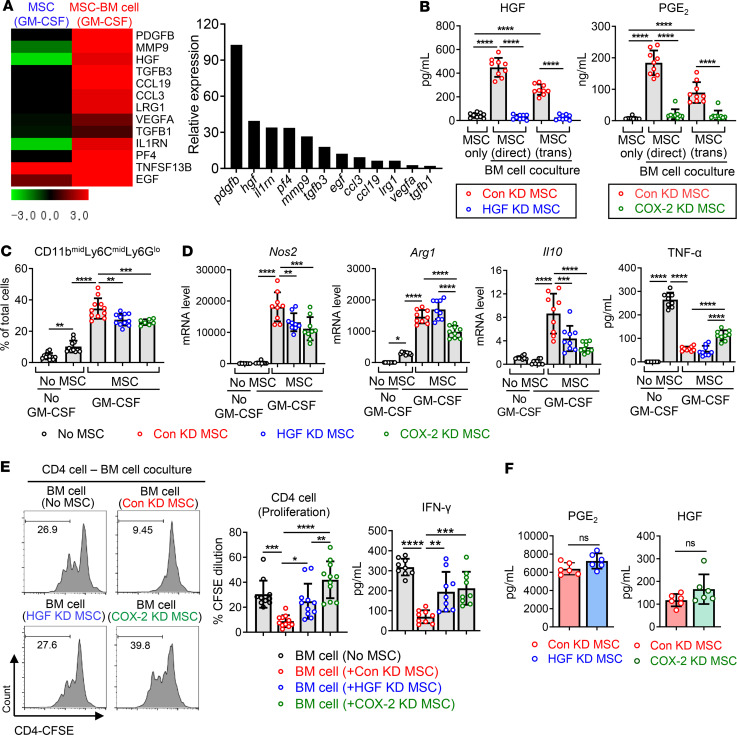
Mesenchymal stem/stromal cells (MSCs) regulate immunity through myeloid-derived suppressor cells (MDSCs), which are a heterogeneous population of immature myeloid cells with phenotypic and functional diversity. Herein, we identified a distinct subset of MDSCs induced by MSCs in the BM under inflammatory conditions. MSCs directed the differentiation of Ly6Glo BM cells from CD11bhiLy6Chi cells to CD11bmidLy6Cmid cells both in cell contact-independent and -dependent manners upon GM-CSF stimulation in vitro and in mice with experimental autoimmune uveoretinitis (EAU). RNA-Seq indicated that MSC-induced CD11bmidLy6CmidLy6Glo cells had a distinct transcriptome profile from CD11bhiLy6ChiLy6Glo cells. Phenotypic, molecular, and functional analyses showed that CD11bmidLy6CmidLy6Glo cells differed from CD11bhiLy6ChiLy6Glo cells by low expression of MHC class II and costimulatory molecules and proinflammatory cytokines, high production of immunoregulatory molecules, lack of change in response to LPS, and inhibition of T cell proliferation and activation. Consequently, adoptive transfer of MSC-induced CD11bmidLy6CmidLy6Glo cells significantly attenuated the development of EAU in mice. Further mechanistic study revealed that suppression of prostaglandin E2 (PGE2) and HGF secretion in MSCs by siRNA transfection partially reversed the effects of MSCs on MDSC differentiation. Altogether, data demonstrate that MSCs drive the differentiation of BM cells toward CD11bmidLy6CmidLy6Glo MDSCs, in part through HGF and COX-2/PGE2, leading to resolution of ocular autoimmune inflammation.

Keywords: Adult stem cells; Autoimmune diseases; Autoimmunity; Immunology; Stem cell transplantation.


Conflict of interest statement

Conflict of interest: The authors have declared that no conflict of interest exists.

Figures

Figure 1
Figure 1. MSCs direct differentiation of BM cells into CD11bmidLy6CmidLy6Glo cells under inflammatory stimulation.
BM cells extracted from C57BL/6 mice were cocultured with MSCs in direct coculture or Transwell system under GM-CSF stimulation (40 ng/mL) for 5 days and assayed. After gating BM cells on Ly6G, Ly6Glo cells were assessed for CD11b and Ly6C expression by flow cytometry. Representative cytograms and the percentages of CD11bloLy6CloLy6Glo cells, CD11bmidLy6CmidLy6Glo cells, and CD11bhiLy6ChiLy6Glo cells of total BM cells are presented. Data (mean ± SD) are from 4 independent sets of experiments (n = 4 in each group per set). A dot depicts data from 1 biological sample. ***P < 0.001, ****P < 0.0001 by 1-way ANOVA and Tukey’s multiple-comparison test.
Figure 2
Figure 2. MSCs drive differentiation of BM cells into antiinflammatory phenotypes under inflammatory stimulation.
(A–C) BM cells cocultured with MSCs in direct coculture or Transwell system were stimulated by GM-CSF (40 ng/mL) for 5 days and assayed. Representative flow cytometry histograms (A) and quantitative results for the surface expression of MHC class II, CD40, CD80, and CD86 in BM cells (B) and for the intracellular expression of arginase and IL-10 (C). (D) Real-time RT-PCR assay for Arg1 encoding arginase and Nos2 encoding inducible nitric oxide synthase. Shown are data scaled to BM cells not treated with GM-CSF or cocultured with MSCs. (E) ELISA for TNF-α, IL-10, active TGF-β1, and active TGF-β2 in the cell-free coculture supernatant. Data (mean ± SD) are from 3 independent sets of experiments (n = 2–4 in each group per set. Each biological sample was assayed in 3 technical replicates for RT-PCR and ELISA). A dot depicts data from 1 biological sample. *P < 0.05, **P < 0.01, ***P < 0.001, ****P < 0.0001 by 1-way ANOVA and Tukey’s multiple-comparison test.
Figure 3
Figure 3. LPS responsiveness of MSC-differentiated BM cells.
(A) Experimental scheme of LPS stimulation assay. After 5-day coculture with MSCs in direct or Transwell coculture system under GM-CSF incubation (40 ng/mL), BM cells were challenged with LPS (100 ng/mL) for 18 hours and assayed by ELISA and flow cytometry. (B) ELISA for secreted levels of TNF-α and IL-12 in the cell-free culture supernatant. (C and D) Representative flow cytometry histograms and quantitative results for MHC class II, CD40, CD80, and CD86 expression in BM cells. The fluorescence minus one control (FMO control) was used for each marker. Data (mean ± SD) are from 3 independent sets of experiments (n = 3–4 in each group per set. Each biological sample was assayed in 3 technical replicates for ELISA). A dot depicts data from 1 biological sample. **P < 0.01, ***P < 0.001, ****P < 0.0001 by 1-way ANOVA and Tukey’s multiple-comparison test.
Figure 4
Figure 4. MSCs induce CD11bmidLy6CmidLy6Glo cells in BM of EAU mice.
(A) Right after EAU immunization, either MSCs or vehicle (Hanks balanced salt solution [BSS]) were injected into the tail veins of mice (day 0). At days 1 and 7, the cells were extracted from the BM and evaluated by flow cytometry. (B and C) Representative and quantitative flow cytometry results for CD11bloLy6CloLy6Glo, CD11bmidLy6CmidLy6Glo, and CD11bhiLy6ChiLy6Glo cells in the BM. A dot indicates data from 1 individual animal (mean ± SD). *P < 0.05, **P < 0.01, ****P < 0.0001 by 1-way ANOVA and Tukey’s multiple-comparison test.
Figure 5
Figure 5. Inflammatory activation status of MSC-induced CD11bmidLy6CmidLy6Glo cells in comparison with CD11bhiLy6ChiLy6Glo cells or CD11bloLy6CloLy6Glo cells.
(A) CD11bloLy6CloLy6Glo cells were sorted from BM cells that had been cultured for 5 days without MSCs in the absence of GM-CSF. CD11bhiLy6ChiLy6Glo cells were isolated from BM cells cultured for 5 days under GM-CSF incubation (40 ng/mL) but without MSC coculture. CD11bmidLy6CmidLy6Glo cells were sorted from GM-CSF–stimulated, MSC-cocultured BM cells. The secreted levels of IL-10 and TNF-α were measured in the cell-free supernatant of each cell culture before and after LPS stimulation (100 ng/mL) for 18 hours. Scale bar: 50 μm. Data (mean ± SD) are from 3 independent sets of experiments (n = 3–4 in each group per set. Each biological sample was assayed in 3 technical replicates). A dot depicts data from 1 biological sample. ****P < 0.0001 by 1-way ANOVA and Tukey’s multiple-comparison test. (B and C) Heatmaps of RNA-Seq on CD11bhiLy6ChiLy6Glo cells, CD11bmidLy6CmidLy6Glo cells, and CD11bloLy6CloLy6Glo cells. The first column (blue box) depicts changes in the gene expression levels in CD11bhiLy6ChiLy6Glo cells relative to CD11bloLy6CloLy6Glo cells. The second column (red box) depicts the gene expression changes in CD11bmidLy6CmidLy6Glo cells relative to CD11bloLy6CloLy6Glo cells. The genes related to inflammation and immune response are shown in B, and the genes related to cell differentiation and immune response are shown in C. The whole data are deposited in ArrayExpress (accession E-MTAB-8975).
Figure 6
Figure 6. MSC-induced CD11bmidLy6CmidLy6Glo cells inhibit T cell proliferation and Th1 differentiation in a nitric oxide–independent manner.
(A) Experimental scheme. CD11bloLy6CloLy6Glo cells, CD11bmidLy6CmidLy6Glo cells, and CD11bhiLy6ChiLy6Glo cells were sorted as in Figure 5A and stimulated with LPS (100 ng/mL) for 18 hours. CD4+ cells were sorted from the spleens of C57BL/6 mice. The sorted CD11bloLy6CloLy6Glo cells, CD11bmidLy6CmidLy6Glo cells, or CD11bhiLy6ChiLy6Glo cells were cocultured in a direct coculture system with CFSE-prelabeled CD4+ cells on anti-CD3– and anti-CD28 antibody–coated plates for 5 days. (B and C) CFSE dilution assay for CD4+ cell proliferation (B) and flow cytometric analysis for IFN-γ+CD4+ cells (C). (D) ELISA for IFN-γ and IL-10 production in the cell-free supernatant of BM cell–CD4+ cell coculture. (E and F) N:(G)-monomethyl-L-arginine (L-NMMA, 5 mM) was added to BM cell–CD4+ cell coculture for the inhibition of nitric oxide synthase (NOS) activity (E), and CD4 cell proliferation and IFN-γ+CD4+ cell differentiation were examined by CFSE assay and flow cytometry (F). Data (mean ± SD) represent 3–8 independent sets of experiments (n = 2–4 in each group per set. Each biological sample was assayed in 3 technical replicates for ELISA). A dot depicts data from 1 biological sample. **P < 0.01, ***P < 0.001, ****P < 0.0001, ns, not significant. One-way ANOVA and Tukey’s multiple-comparison test were used in B, C, D, and F and Mann-Whitney test was used in E.
Figure 7
Figure 7. MSC-induced CD11bmidLy6CmidLy6Glo cells protect against EAU development in mice.
(A) The CD11bloLy6CloLy6Glo, CD11bmidLy6CmidLy6Glo, and CD11bhiLy6ChiLy6Glo cells were sorted as in Figure 5A and stimulated with LPS for 18 hours. Each cell population or the vehicle (Hanks balanced salt solution [BSS]) was injected i.v. into mice immediately after EAU induction (day 0). Twenty-one days later (day 21), the mice were sacrificed and assayed. (B–D) Representative microphotographs of H&E staining, CD3 immunostaining of the retinal cross-sections, and disease score assigned by histological findings. The retinal structure, especially outer nuclear layer, including photoreceptor nuclei (arrowheads), was disorganized and infiltrated with inflammatory cells and CD3+ cells in the CD11bhiLy6ChiLy6Glo cell–treated EAU mice. In contrast, the retinal structure was preserved and few inflammatory cells were observed in mice treated with CD11bmidLy6CmidLy6Glo cells. Scale bar: 100 μm. (E and F) Representative flow cytometry cytograms and quantitative results for IFN-γ+CD4+ cells and IL-17+CD4+ cells in draining cervical lymph nodes (CLN). The numbers presented in cytograms (E) represent the percentage of IFN-γ+ or IL-17+ population of CD4+ cells, and the data shown in quantitative graphs (F) are the percentage of IFN-γ+CD4+ cells or IL-17+CD4+ cells of total CLN cells. (G) Real-time RT-PCR analysis for the proinflammatory cytokines in the eye. Shown are the values of mRNA levels relative to those in normal eyes without EAU. A dot indicates data from 1 individual animal (mean ± SD). Each biological sample was assayed in 3 technical replicates for RT-PCR. *P < 0.05, **P < 0.01, ***P < 0.001, ****P < 0.0001 by 1-way ANOVA and Tukey’s multiple-comparison test.
Figure 8
Figure 8. The knockdown of HGF and COX-2 partially reverses the effects of MSCs on BM cell differentiation.
(A) Heatmaps of RNA-Seq on MSCs cultured alone without GM-CSF, MSCs cultured under GM-CSF stimulation, and MSCs cocultured with BM cells under GM-CSF. Presented are the gene expression levels in MSCs cultured with GM-CSF (the first column) and in MSCs cocultured with BM cells + GM-CSF (the second column), relative to those in MSCs cultured without GM-CSF. The genes that encode secreted proteins and were upregulated by >2-fold in MSCs cocultured with BM cells under GM-CSF in comparison with MSCs cultured alone under GM-CSF are listed. The whole data are deposited in ArrayExpress (accession E-MTAB-8976). (B) MSCs were transfected with control siRNA (Con KD MSC), HGF siRNA (HGF KD MSC), or COX-2 siRNA (COX-2 KD MSC) and cocultured with BM cells in either direct or Transwell coculture system (trans) in the presence or absence of GM-CSF. The cell-free culture supernatants were evaluated for the secretion of HGF and PGE2 using ELISA in order to confirm the knockdown of each gene. (C) The flow cytometry results for CD11bmidLy6CmidLy6Glo cells out of BM cells after 5 days of coculture with MSCs. (D) Real-time RT-PCR for mRNA levels of inducible nitric oxide synthase (Nos2), arginase (Arg1), and Il10 in BM cells. ELISA for TNF-α in the cell-free supernatants of BM cell–MSC coculture. (E) BM cells were cocultured with Con KD MSC, HGF KD MSC, or COX-2 KD MSC for 5 days under GM-CSF stimulation. Then, BM cells were separated and cocultured with CFSE-labeled CD4+ cells on anti-CD3 and anti-CD28 antibody–coated plates. After 5 days, CD4+ cell proliferation was evaluated by CFSE dilution assay and IFN-γ secreted level was measured by ELISA. (F) ELISA for PGE2 and HGF in cultures of HGF KD MSC and COX-2 KD MSC, respectively. Three independent sets of experiments in total were performed. Each set contained 2–4 biological samples in each group, and 1 dot depicts data from 1 biological sample. Each biological sample was assayed in 3 technical replicates for RT-PCR and ELISA (mean ± SD). *P < 0.05, **P < 0.01, ***P < 0.001, ****P < 0.0001, ns, not significant. One-way ANOVA and Tukey’s multiple-comparison test were used in B–E and Mann-Whitney test was used in F.

References

    1. Cheung TS, Dazzi F. Mesenchymal-myeloid interaction in the regulation of immunity. Semin Immunol. 2018;35:59–68. doi: 10.1016/j.smim.2018.01.002. - DOI - PubMed
    1. Veglia F, Perego M, Gabrilovich D. Myeloid-derived suppressor cells coming of age. Nat Immunol. 2018;19(2):108–119. doi: 10.1038/s41590-017-0022-x. - DOI - PMC - PubMed
    1. Vlachou K, et al. Elimination of granulocytic myeloid-derived suppressor cells in lupus-prone mice linked to reactive oxygen species-dependent extracellular trap formation. Arthritis Rheumatol. 2016;68(2):449–461. doi: 10.1002/art.39441. - DOI - PubMed
    1. Kontaki E, Boumpas DT, Tzardi M, Mouzas IA, Papadakis KA, Verginis P. Aberrant function of myeloid-derived suppressor cells (MDSCs) in experimental colitis and in inflammatory bowel disease (IBD) immune responses. Autoimmunity. 2017;50(3):170–181. doi: 10.1080/08916934.2017.1283405. - DOI - PubMed
    1. Zhang H, et al. Myeloid-derived suppressor cells are proinflammatory and regulate collagen-induced arthritis through manipulating Th17 cell differentiation. Clin Immunol. 2015;157(2):175–186. doi: 10.1016/j.clim.2015.02.001. - DOI - PMC - PubMed

Publication types

MeSH terms