. 2020 May 26;16(5):e1008823.
doi: 10.1371/journal.pgen.1008823. eCollection 2020 May.

Glucose transporter 10 modulates adipogenesis via an ascorbic acid-mediated pathway to protect mice against diet-induced metabolic dysregulation

Affiliations

Glucose transporter 10 modulates adipogenesis via an ascorbic acid-mediated pathway to protect mice against diet-induced metabolic dysregulation

Chung-Lin Jiang et al. PLoS Genet. .

Abstract

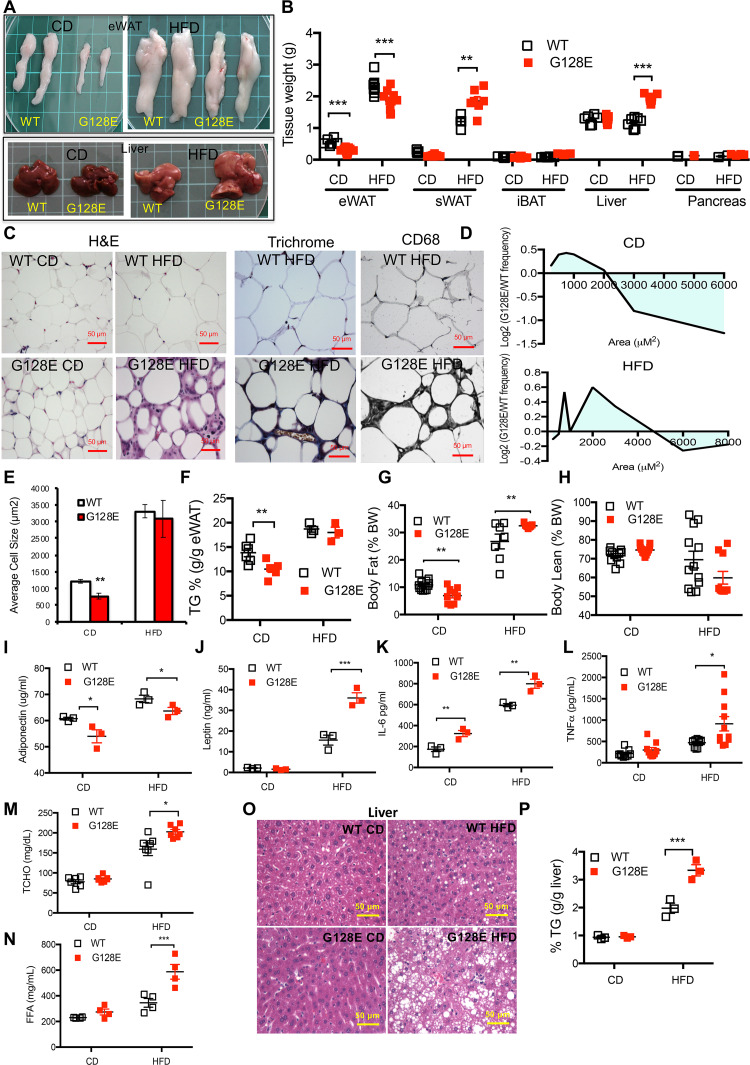
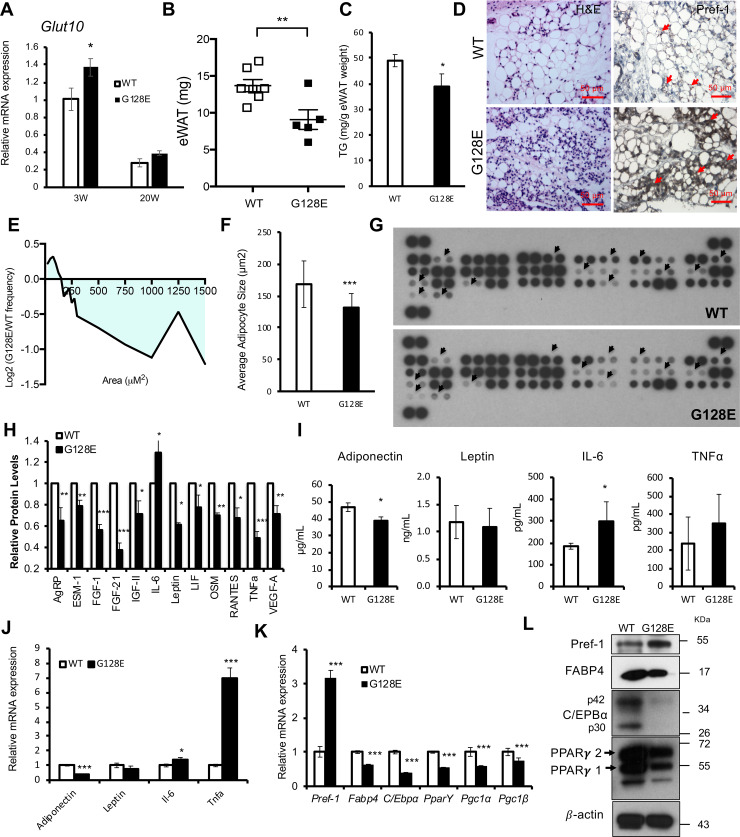
The development of type 2 diabetes mellitus (T2DM) depends on interactions between genetic and environmental factors, and a better understanding of gene-diet interactions in T2DM will be useful for disease prediction and prevention. Ascorbic acid has been proposed to reduce the risk of T2DM. However, the links between ascorbic acid and metabolic consequences are not fully understood. Here, we report that glucose transporter 10 (GLUT10) maintains intracellular levels of ascorbic acid to promote adipogenesis, white adipose tissue (WAT) development and protect mice from high-fat diet (HFD)-induced metabolic dysregulation. We found genetic polymorphisms in SLC2A10 locus are suggestively associated with a T2DM intermediate phenotype in non-diabetic Han Taiwanese. Additionally, mice carrying an orthologous human Glut10G128E variant (Glut10G128E mice) with compromised GLUT10 function have reduced adipogenesis, reduced WAT development and increased susceptibility to HFD-induced metabolic dysregulation. We further demonstrate that GLUT10 is highly expressed in preadipocytes, where it regulates intracellular ascorbic acid levels and adipogenesis. In this context, GLUT10 increases ascorbic acid-dependent DNA demethylation and the expression of key adipogenic genes, Cebpa and Pparg. Together, our data show GLUT10 regulates adipogenesis via ascorbic acid-dependent DNA demethylation to benefit proper WAT development and protect mice against HFD-induced metabolic dysregulation. Our findings suggest that SLC2A10 may be an important HFD-associated susceptibility locus for T2DM.


Conflict of interest statement

The authors have declared that no competing interests exist.

Figures

Fig 1
Fig 1. Glut10G128E mice are predisposed to HFD-induced glucose intolerance and insulin resistance.
Glut10G128E mice and WT mice were fed with a CD or HFD from 5 to 20 weeks of age. Data were collected from the mice at indicated of age or at the conclusion of feeding (20 weeks of age). (A) Representative photograph of mice at 20 weeks of age. Each square on the green mat is 1 cm × 1 cm. (B) Body weights are shown for indicated ages. n = 20−40 mice per group. (C) Fasting glucose, (D) HbA1c levels, and (E) fasting insulin levels were measured at 20 weeks of age. (F) Glucose tolerance test (GTT) was performed in 16-week-old mice and (G) insulin tolerance test (ITT) was performed in 18-week-old animals. Right panels in F and G respectively show the areas under the GTT and ITT curves (AUC). n = 6 mice per group. (H) GTT was performed in WT and Glut10G128E mice on a CD at 24 months of age. n = 6 mice per group. The data are shown as mean ± SEM. *P < 0.05, **P < 0.01, ***P < 0.001.
Fig 2
Fig 2. Glut10G128E mice are susceptible to HFD-induced inflammation and fibrosis in eWAT as well as ectopic lipid deposition.
Glut10G128E mice and WT mice were fed a CD or HFD from 5 to 20 weeks of age. Data were collected from mice at 20 weeks of age. (A) Representative photographs of eWAT and liver from experimental mice. Each square on the green mat is 1 cm × 1cm. (B) Tissue weights. (C) Hematoxylin and eosin (H&E) staining, trichrome staining, and CD68 immunohistochemistry of eWAT sections. (D) The cross-sectional areas of adipose cells in eWAT are presented as the log2 ratio of cells in a particular size range in Glut10G128E mice relative to that in WT mice on a CD or HFD. (E) The average adipocyte size in eWAT. D and E, more than 1000 adipocytes were measured from the eWAT sample from each mouse. n = 6 mice per group. (F) Triglyceride (TG) content in eWAT. (G and H) Body fat and body lean compositions. (I-L) The adiponectin, leptin, IL-6, and TNFα levels in serum. (M) Total cholesterol (TCHO) levels and (N) free fatty acid (FFA) levels in serum. (O) H&E staining of liver sections. (P) Triglyceride (TG) content in liver. Data are shown as the mean ± SEM. *P < 0.05, **P < 0.01, ***P < 0.001.
Fig 3
Fig 3. Glut10G128 mice have compromised eWAT development and altered adipokine profiles at an early age.
(A) GLUT10 mRNA expression in eWAT was analyzed by RT-PCR from Glut10G128E mice and WT mice on a CD at 3 weeks of age (3W) or 20 weeks (20W) of age. n = 6 mice per group. (B-L) Glut10G128E and WT mice were analyzed at 3 weeks of age. (B-F) Glut10G128E mice have compromised eWAT development. (B) Tissue weight and (C) the triglyceride (TG) content of eWAT. n = 6 mice per group. (D) Hematoxylin and eosin (H&E) and Pref-1 immunohistochemistry staining of eWAT sections. (E) The cross-sectional area of adipose cells in eWAT is presented as the log2 ratio of the area of cells in a particular size range in Glut10G128E mice relative to that of the same size range in WT mice. (F) The average adipocyte size in eWAT. E and F, n = 6 mice per group; more than 1000 adipocytes were analyzed in each mouse. (G -J) Glut10G128E mice have altered adipokine profiles. (G) The adipokine levels in serum of Glut10G128E and WT mice were determined by a mouse adipokine protein array. Serum samples from 8 mice per group were pooled. The arrowheads indicate signals with observable changes. (H) Quantification of relative levels of adipokines with observable changes. The average expression from two independent experiments and duplicate data in each array were analyzed separately. (I) Adipokine levels in serum were analyzed by ELISA. n = 4 mice per group. (J) mRNA expression of adipokines in eWAT was analyzed by RT-PCR. n = 6 mice per group. (K-L) Glut10G128E mice have reduced adipogenesis in eWAT. (K) The mRNA expression of adipogenesis-related genes in eWAT was determined by RT-PCR. n = 6 mice per group. (L) Protein expression levels were analyzed by western blotting. Protein samples from 6 mice per group were pooled. Data are shown as the mean ± SEM. *P < 0.05, **P < 0.01, ***P < 0.001.
Fig 4
Fig 4. GLUT10 deficiency cell-autonomously impairs adipogenesis and alters adipokine expression.
(A-C) MEFs were isolated from Glut10G128E and WT mice and induced adipogenic differentiation for 7 days. (A) Representative images show oil red O staining. (B) Quantification of oil red O staining and (C) intracellular triglyceride content (TG) are shown. (D-F) Glut10-knockdown (shGlut10) and control (shLuc) 3T3-L1 cells were induced for adipogenic differentiation for 6 days. (D) Representative images show oil red O staining. (E) Quantification of oil red O staining and (F) intracellular triglyceride (TG) content respectively. (G-M) The relative mRNA expression levels of Glut10 and indicated genes were determined by RT-PCR after induction of adipogenic differentiation for the indicated number of days. n = 3 independent experiments per group. Data are shown as the mean ± SEM. *P < 0.05, **P < 0.01, ***P < 0.001.
Fig 5
Fig 5. GLUT10 modulates intracellular ascorbic acid levels and regulates adipogenesis.
(A) 3T3-L1 preadipocytes were incubated with 75 μM 14C-labeled DHA for 30 min. Intracellular 14C DHA levels (left panel) and intracellular ascorbic acid (AA) levels (right panel) were determined. (B) 3T3-L1 preadipocytes were cultured in medium containing 75 μM AA, and intracellular (left panel), cytoplasmic and nuclear AA levels (right panel) were determined. (C-F) shGlut10 and shLuc 3T3-L1 cells were cultured in normal medium (4 μM AA from serum, mock) or supplemented with 75 μM AA for 2 days. Adipogenic differentiation was induced for 6 days in C and D. Adipogenic differentiation was induced for the indicated number of days in E and F. (C) Representative images of oil red O staining and (D) quantification of the oil red O staining. (E and F) Relative mRNA expression of Cebpa and Pparg was determined by RT-PCR. n = 3 independent experiments per group. Data are shown as the mean ± SEM. *P < 0.05, **P < 0.01, ***P < 0.001.
Fig 6
Fig 6. GLUT10 modulates ascorbic acid-mediated DNA demethylation of Cebpa and Pparg and adipogenesis.
(A-C) shGlut10 and shLuc 3T3-L1 cells were cultured in standard culture medium (4 μM AA from serum) or supplemented with 75 μM AA (AA). (A) Global 5hmC levels were quantified with an ELISA-based assay. (B and C) 5hmC levels in Cebpa and Pparg were quantified by 5hmC immunoprecipitation coupled with qPCR. (D) Schematic diagram depicting the inhibition of ascorbic acid (AA)-mediated TET DNA demethylation by DFO, DMOG or NPA. (E and F) shGlut10 and shLuc 3T3-L1 cells were treated with either DFO (10 μM), DMOG (100 μM), NPA (50 μM), or a vehicle control along with 75 μM AA for 2 days and adipogenic differentiation was induced for 6 days. (E) Representative images of oil red O staining and (F) quantification of the oil red O staining. Data are shown as the mean ± SEM. n = 3 independent experiments per group. *P < 0.05, **P < 0.01, ***P < 0.001.
Fig 7
Fig 7. Model depicts how GLUT10 modulates ascorbic acid levels to protect mice against HFD-induced metabolic dysregulation.
GLUT10 modulates ascorbic acid-mediated DNA demethylation and gene expression of Pparg and Cebpa to regulate adipogenesis, thereby affecting WAT development and metabolism.

References

    1. Replication DIG, Meta-analysis C, Asian Genetic Epidemiology Network Type 2 Diabetes C, South Asian Type 2 Diabetes C, Mexican American Type 2 Diabetes C, Type 2 Diabetes Genetic Exploration by Nex-generation sequencing in muylti-Ethnic Samples C, et al. Genome-wide trans-ancestry meta-analysis provides insight into the genetic architecture of type 2 diabetes susceptibility. Nat Genet. 2014;46(3):234–44. 10.1038/ng.2897 - DOI - PMC - PubMed
    1. Scott RA, Scott LJ, Magi R, Marullo L, Gaulton KJ, Kaakinen M, et al. An Expanded Genome-Wide Association Study of Type 2 Diabetes in Europeans. Diabetes. 2017;66(11):2888–902. Epub 2017/06/02. 10.2337/db16-1253 - DOI - PMC - PubMed
    1. Bonnefond A, Clement N, Fawcett K, Yengo L, Vaillant E, Guillaume JL, et al. Rare MTNR1B variants impairing melatonin receptor 1B function contribute to type 2 diabetes. Nat Genet. 2012;44(3):297–301. Epub 2012/01/31. 10.1038/ng.1053 - DOI - PMC - PubMed
    1. Majithia AR, Flannick J, Shahinian P, Guo M, Bray MA, Fontanillas P, et al. Rare variants in PPARG with decreased activity in adipocyte differentiation are associated with increased risk of type 2 diabetes. Proc Natl Acad Sci U S A. 2014;111(36):13127–32. Epub 2014/08/27. 10.1073/pnas.1410428111 - DOI - PMC - PubMed
    1. Flannick J, Thorleifsson G, Beer NL, Jacobs SB, Grarup N, Burtt NP, et al. Loss-of-function mutations in SLC30A8 protect against type 2 diabetes. Nat Genet. 2014;46(4):357–63. Epub 2014/03/04. 10.1038/ng.2915 - DOI - PMC - PubMed

Publication types

MeSH terms