. 2020 Jul 6;17(7):2555-2569.
doi: 10.1021/acs.molpharmaceut.0c00257. Epub 2020 Jun 11.

Physicochemical Rules for Identifying Monoclonal Antibodies with Drug-like Specificity

Affiliations

Physicochemical Rules for Identifying Monoclonal Antibodies with Drug-like Specificity

Yulei Zhang et al. Mol Pharm. .

Abstract

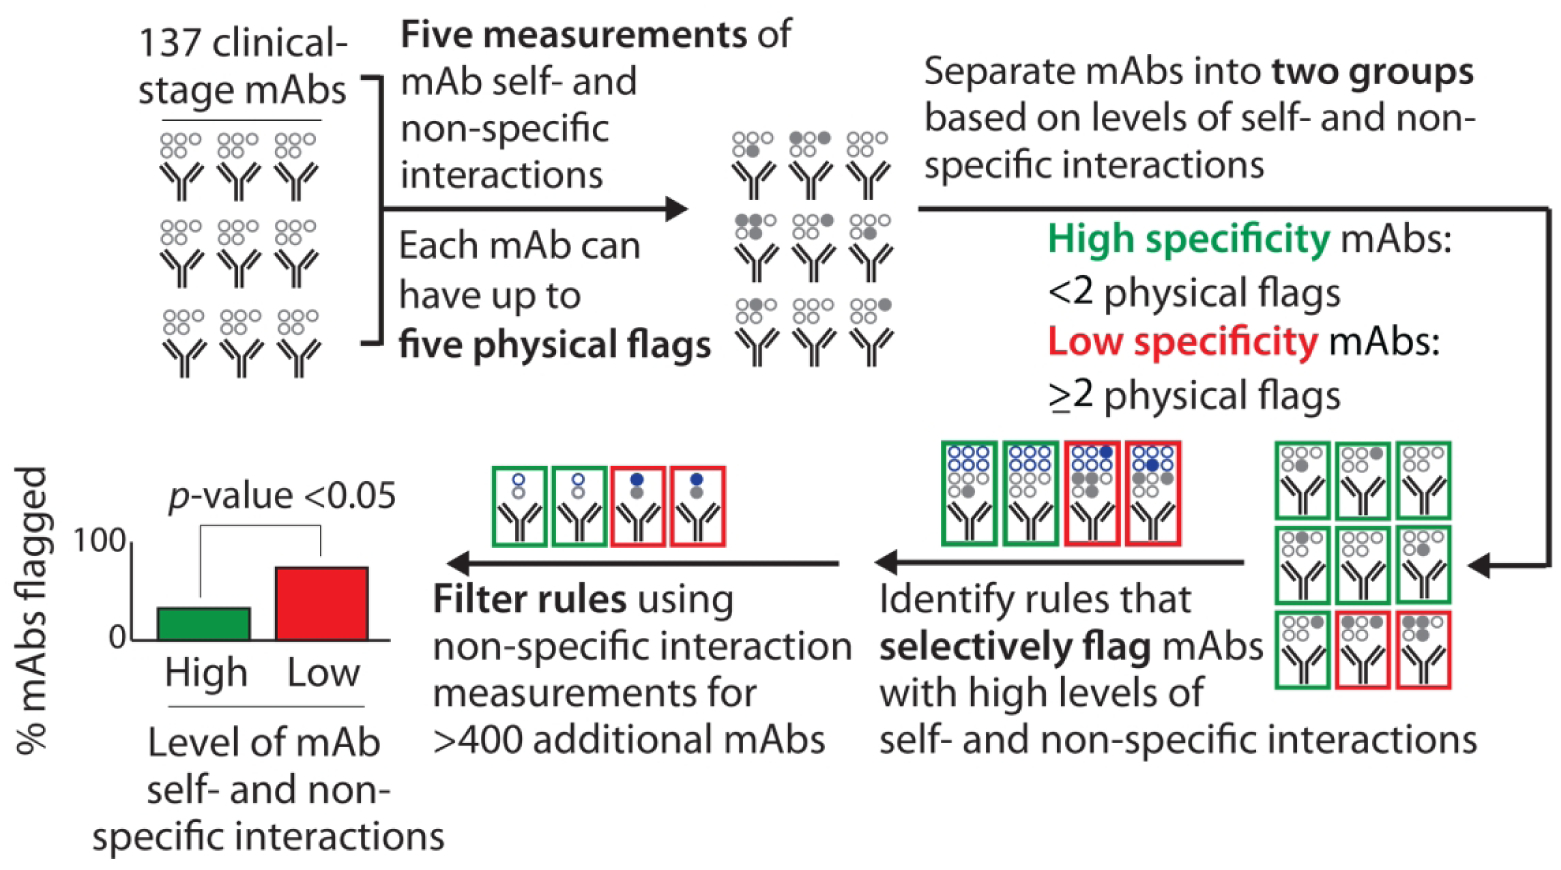
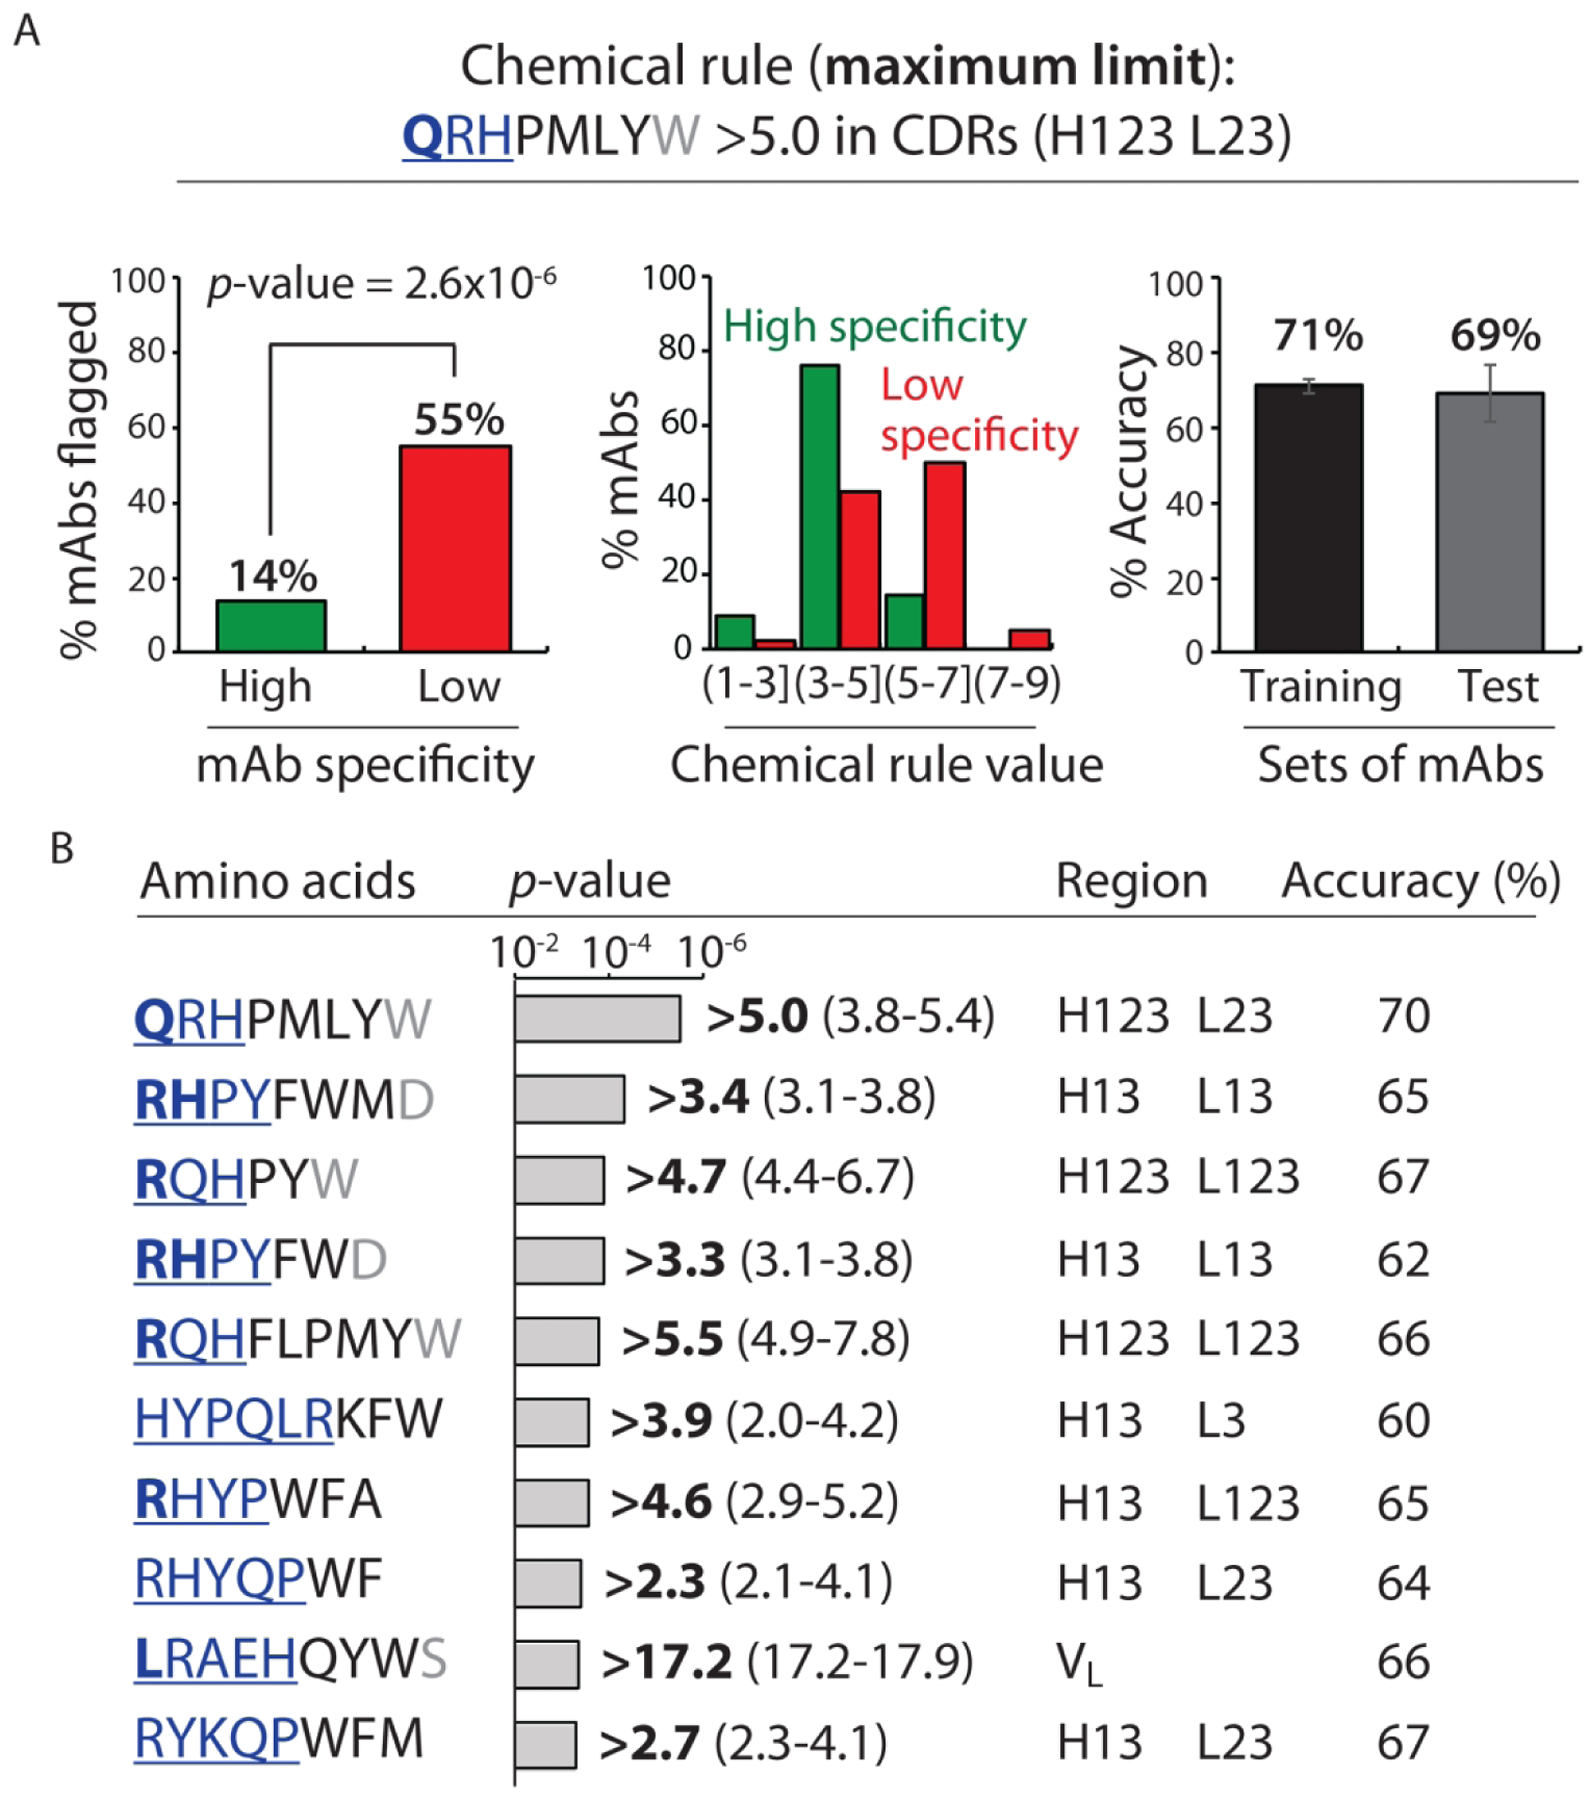
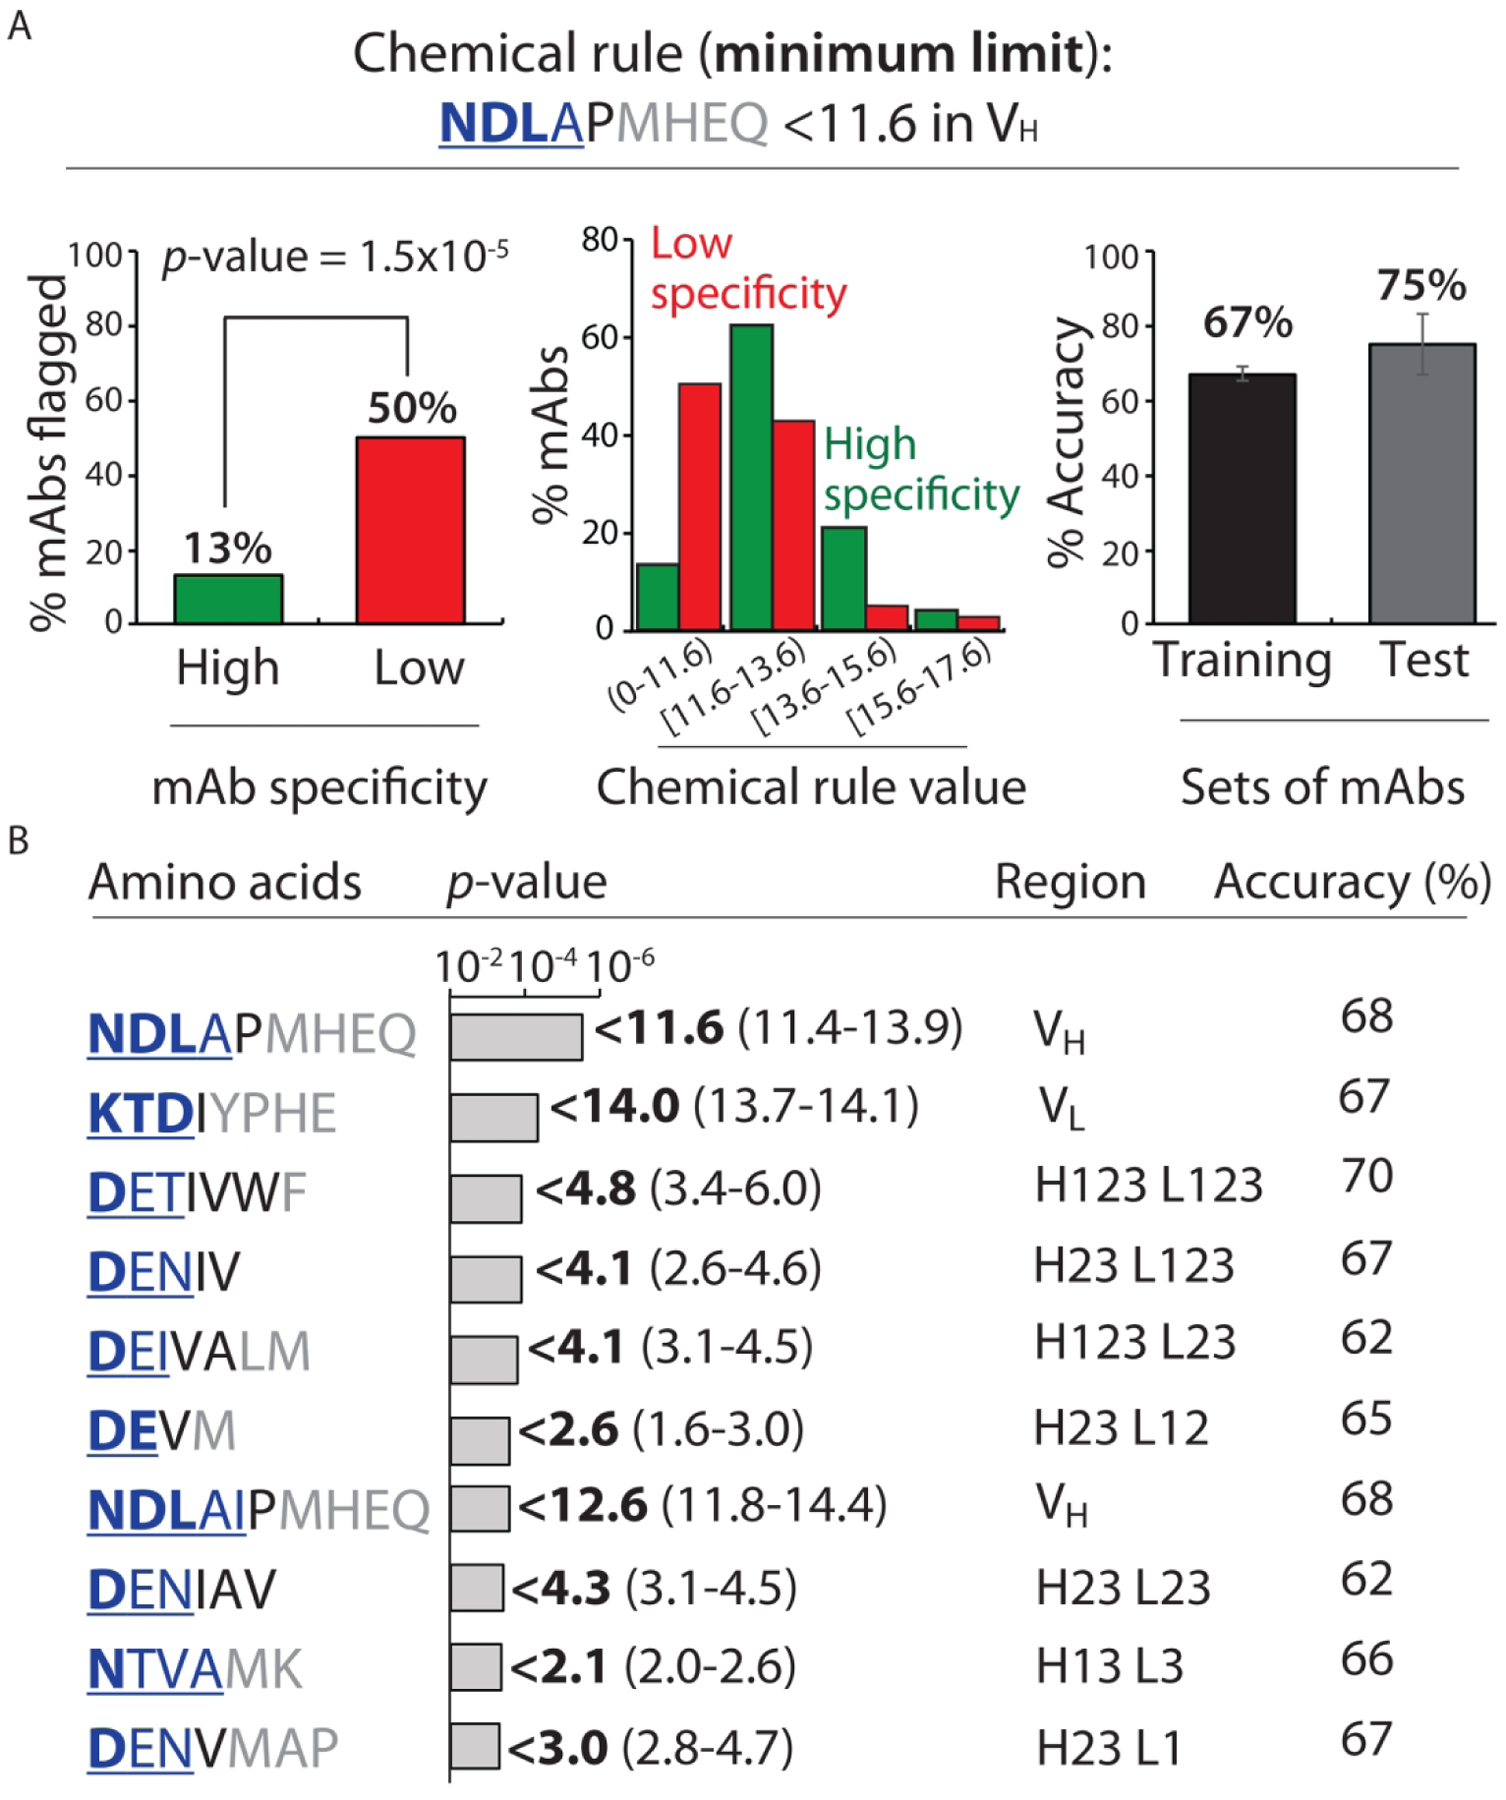
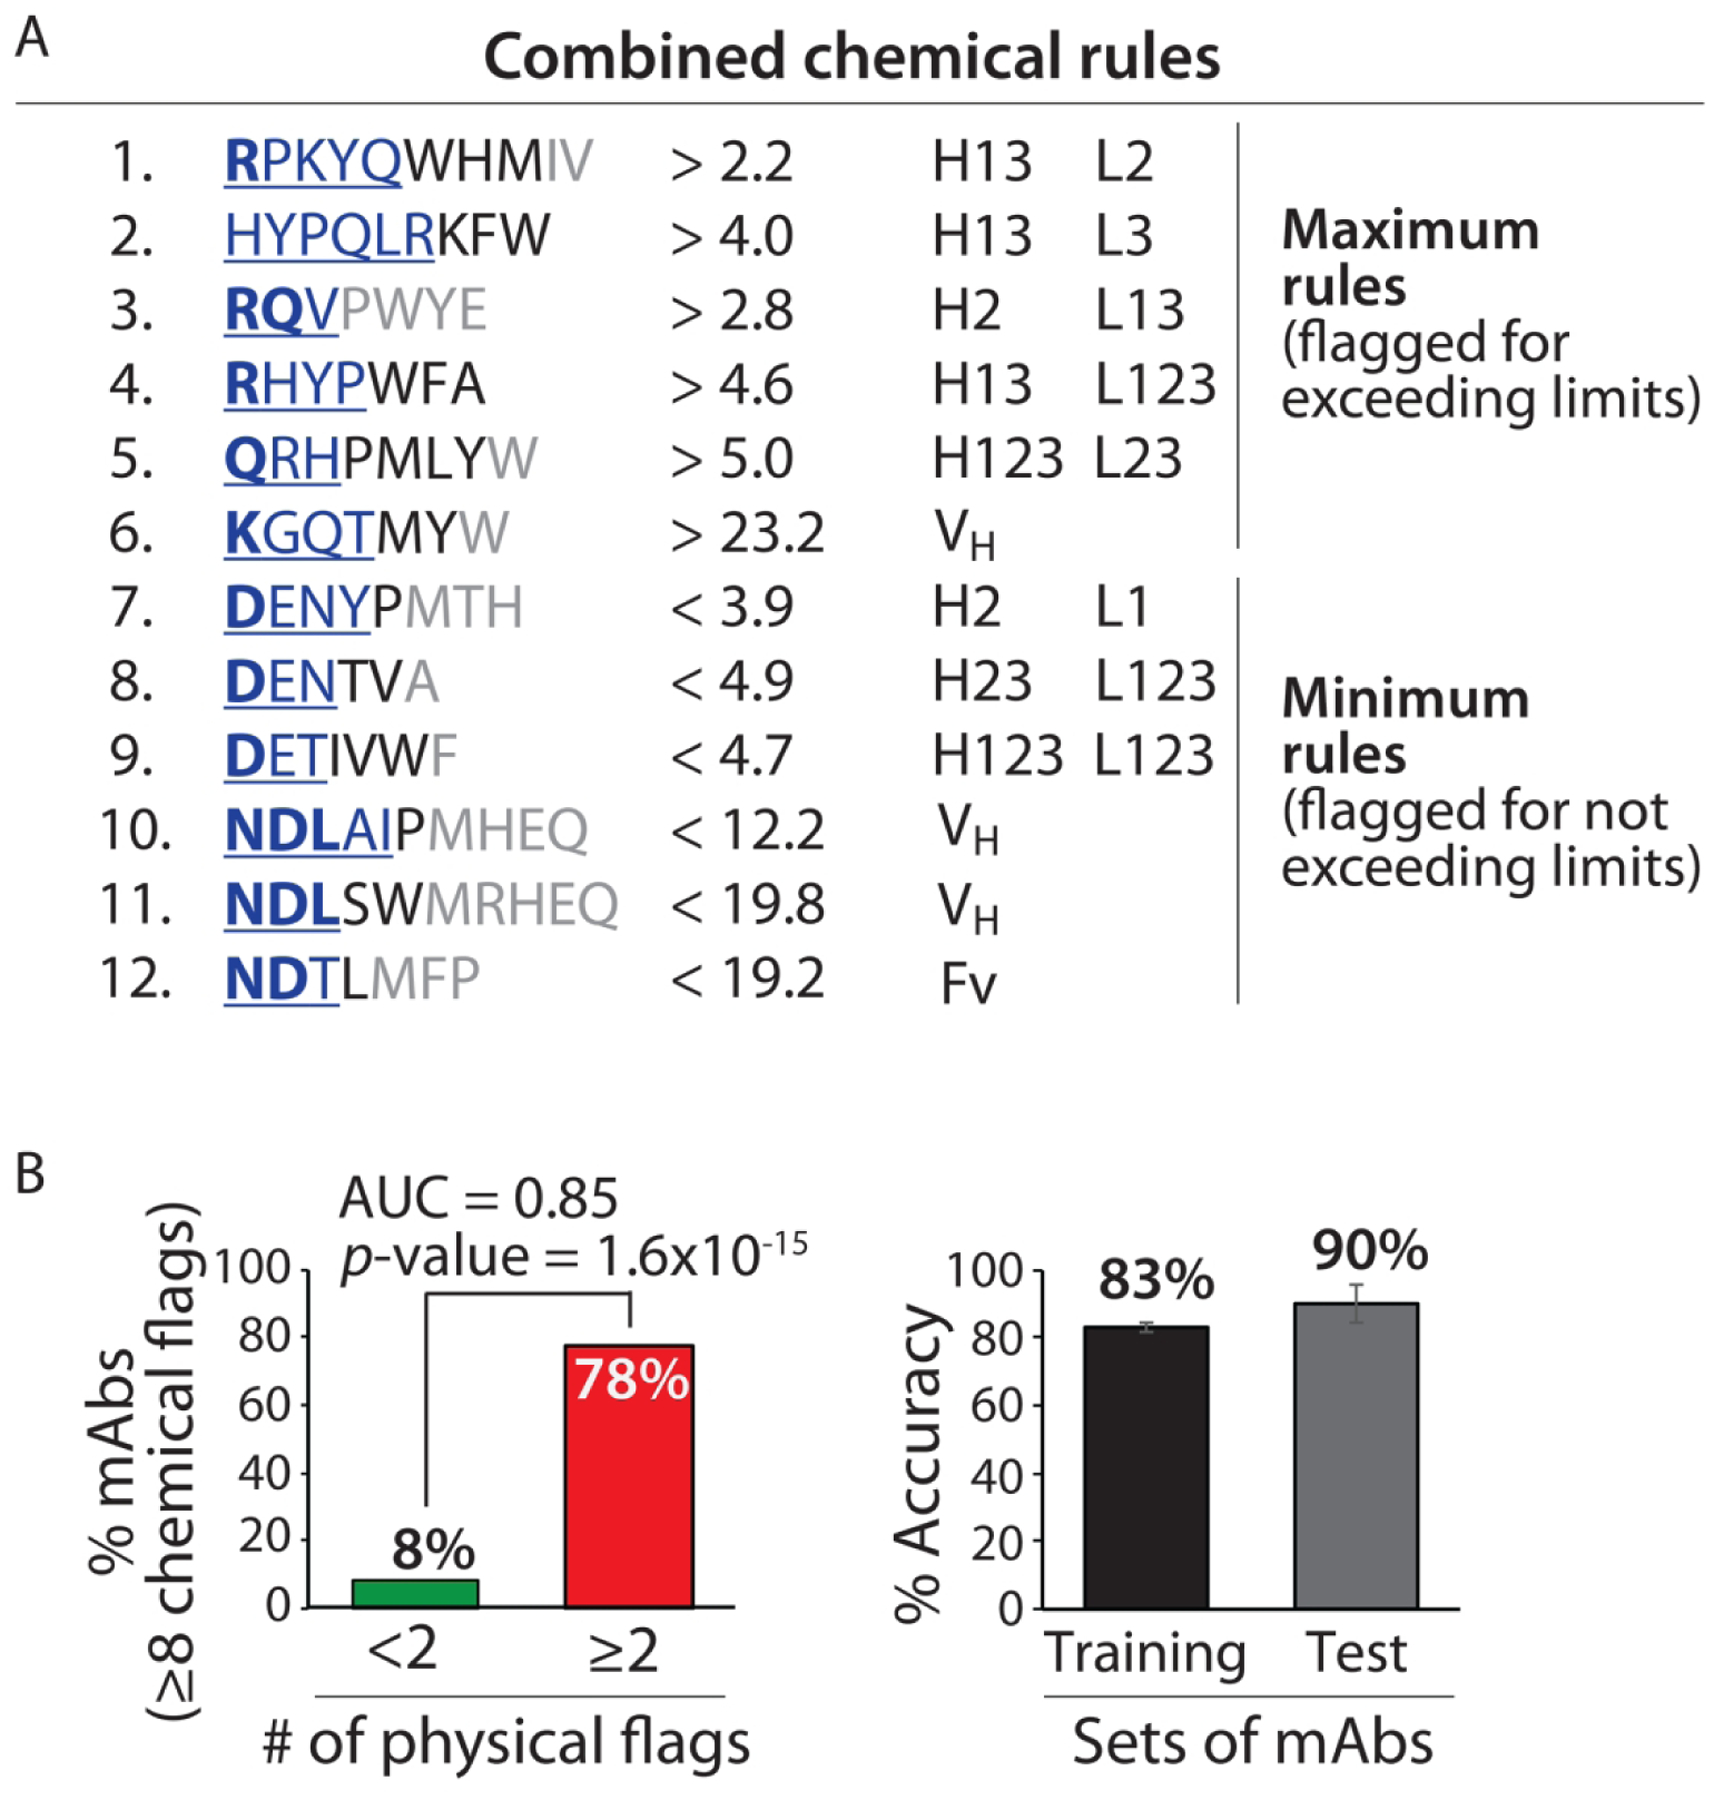
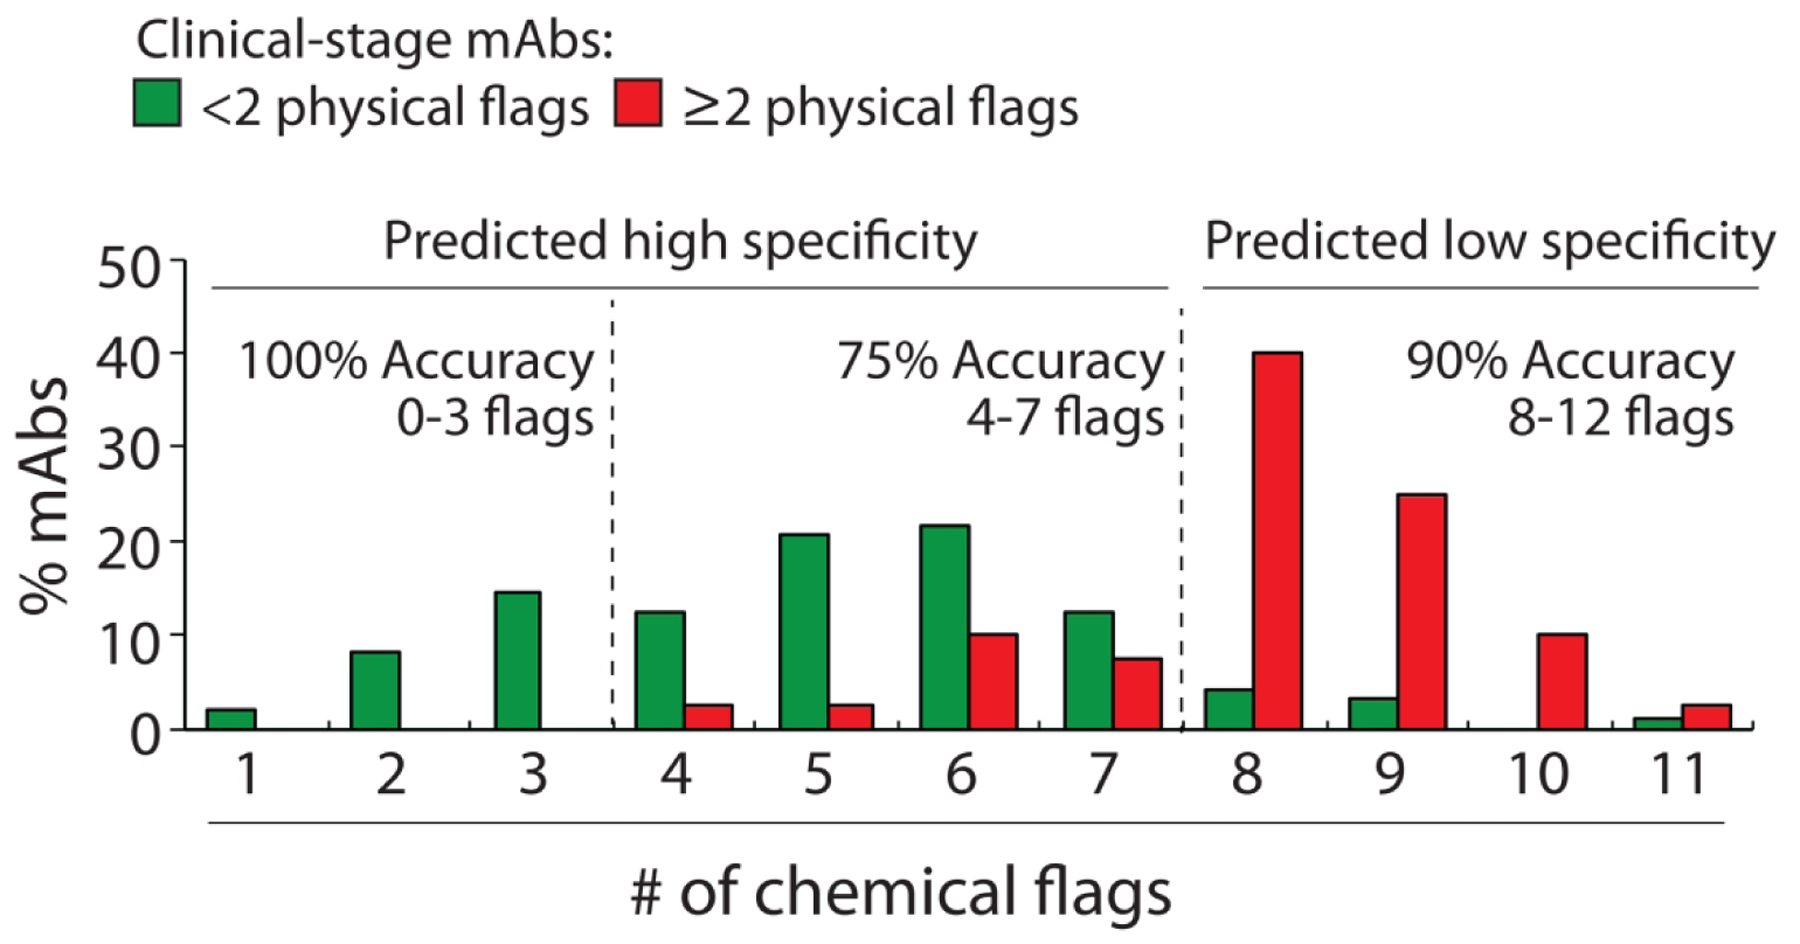
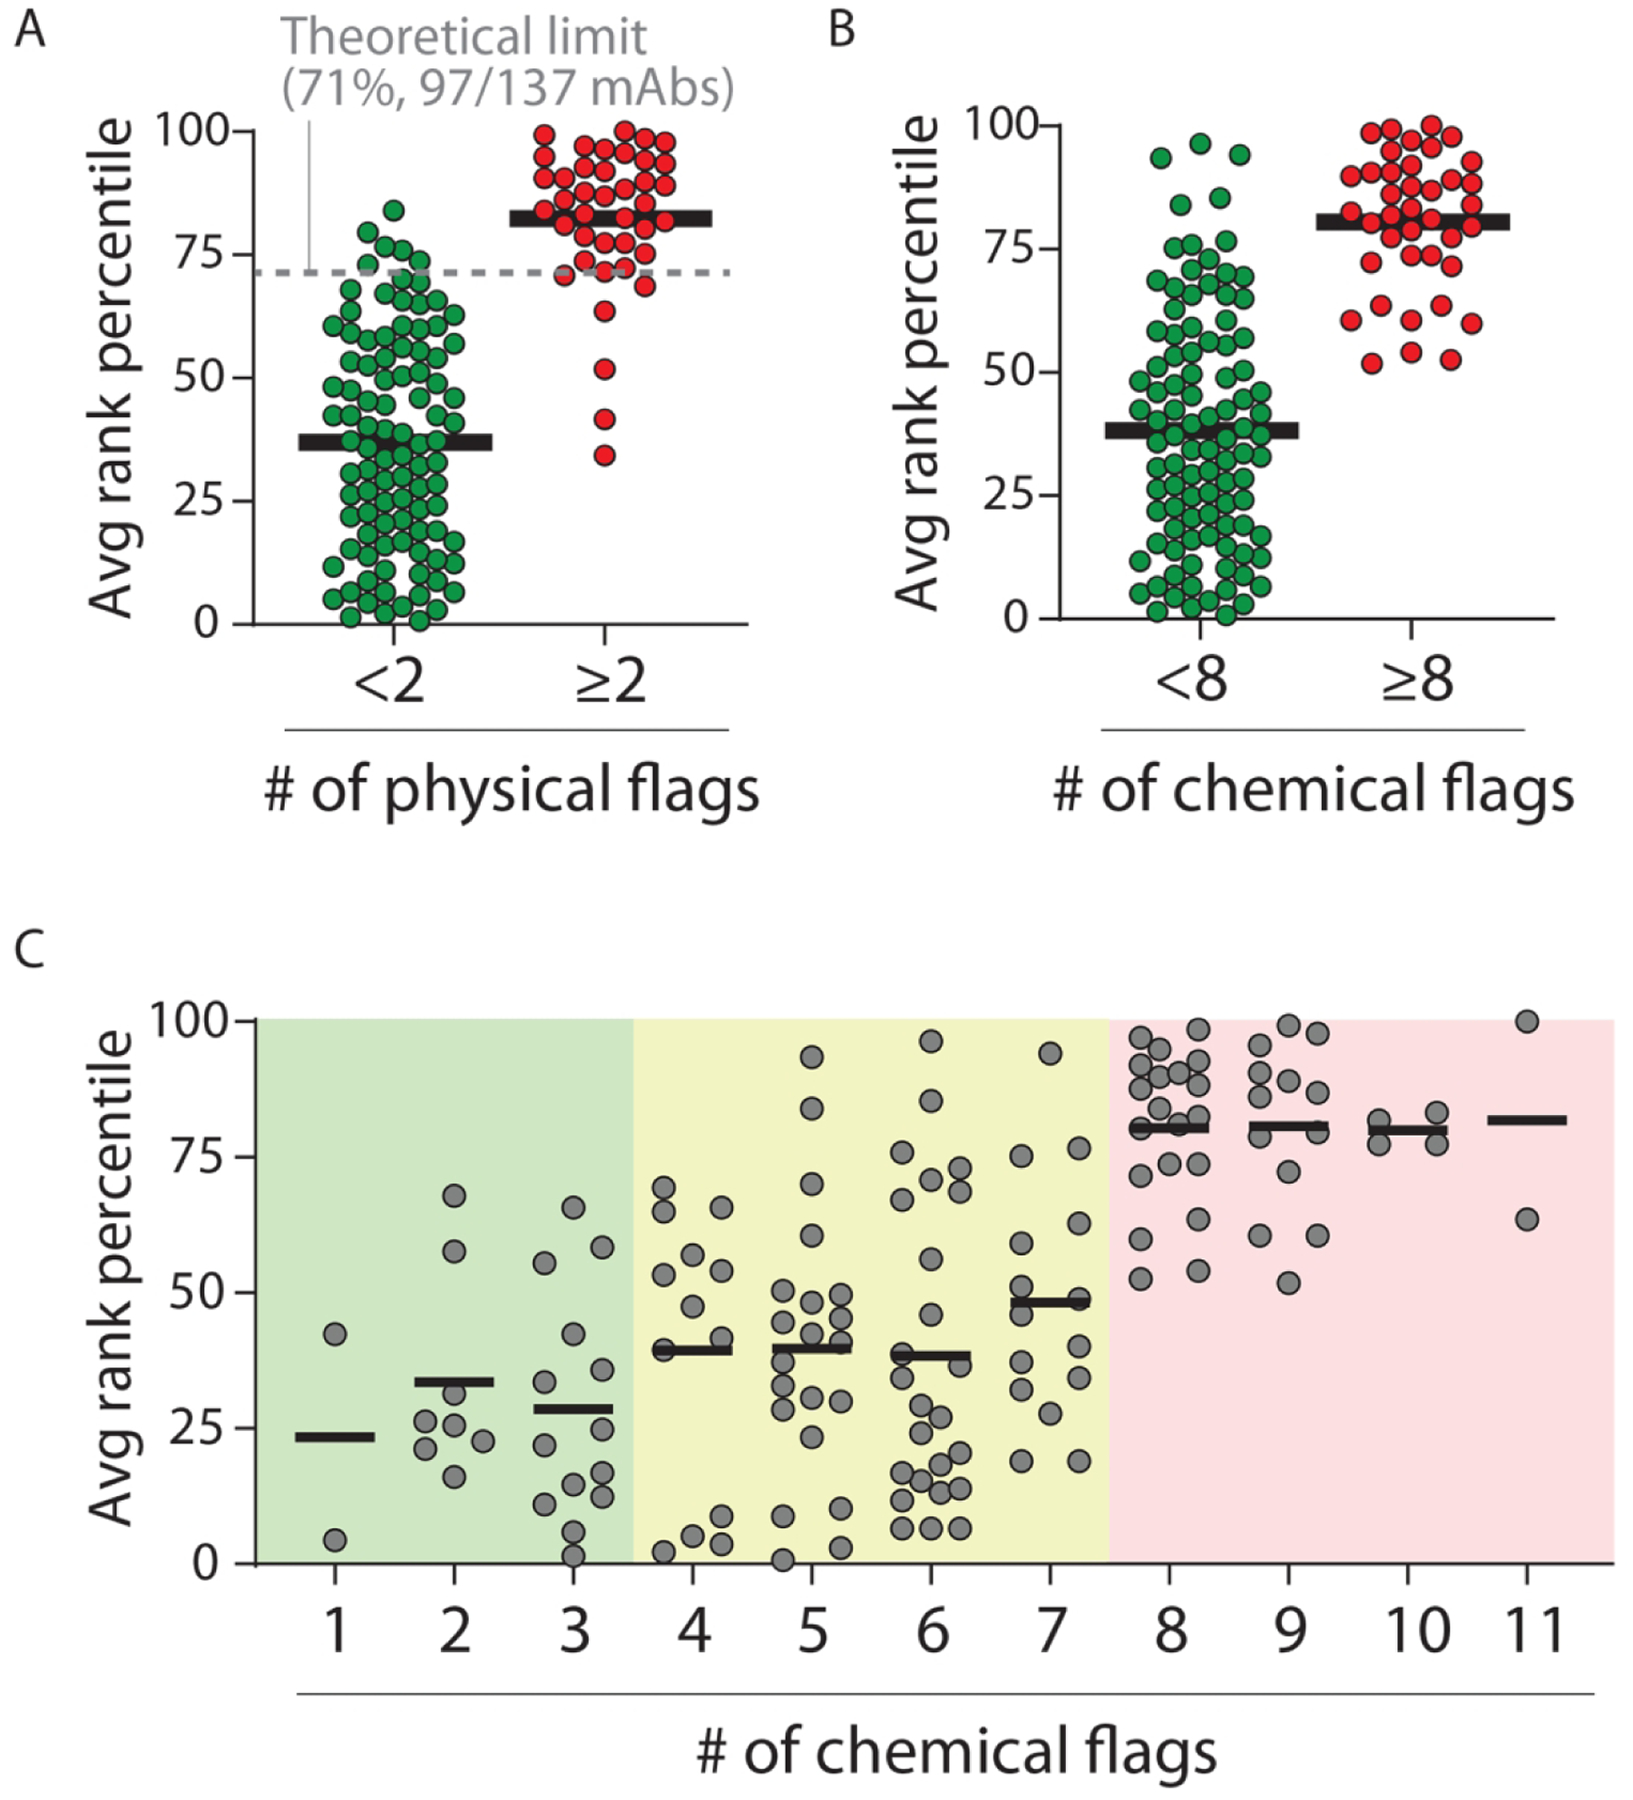
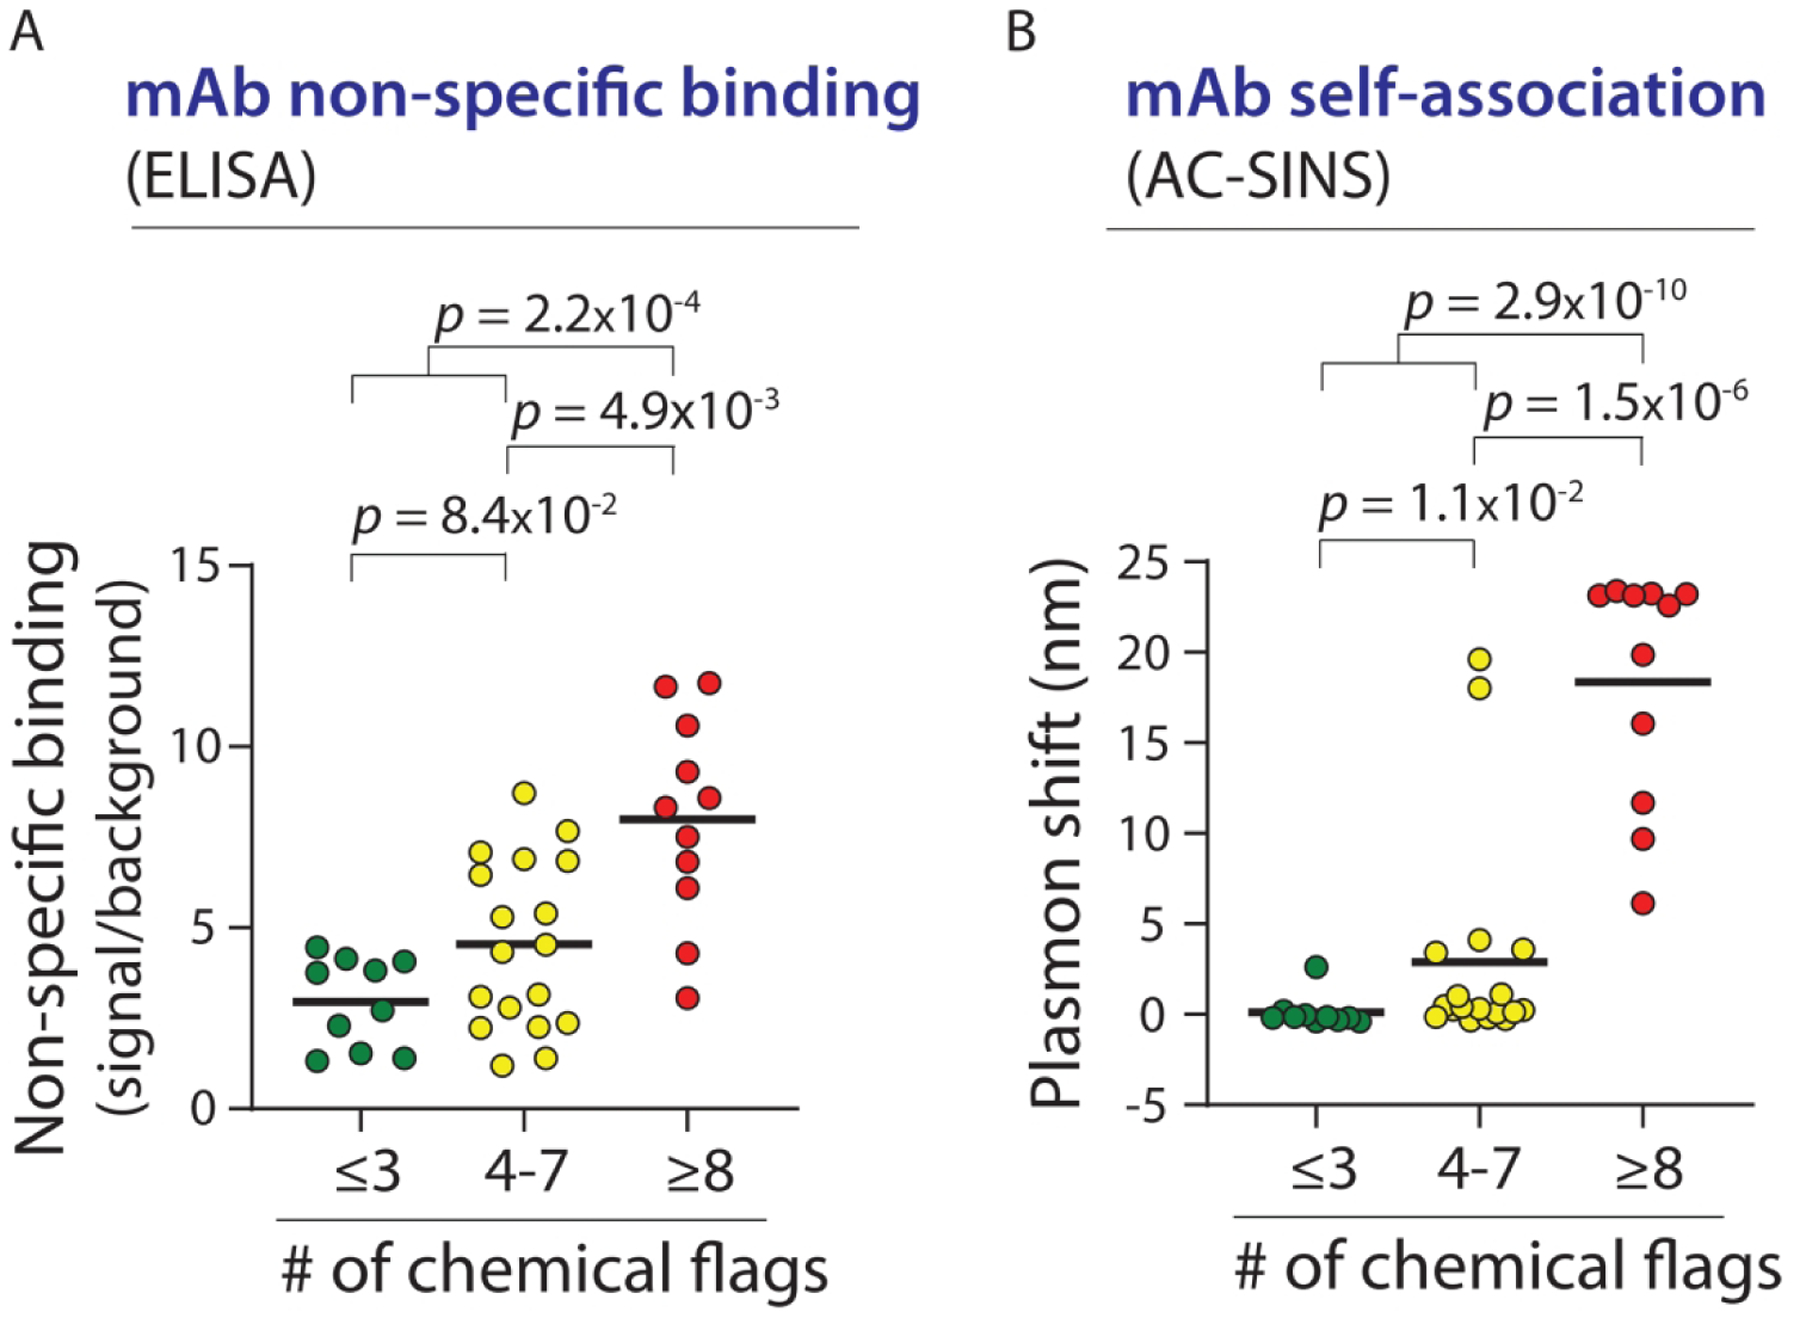
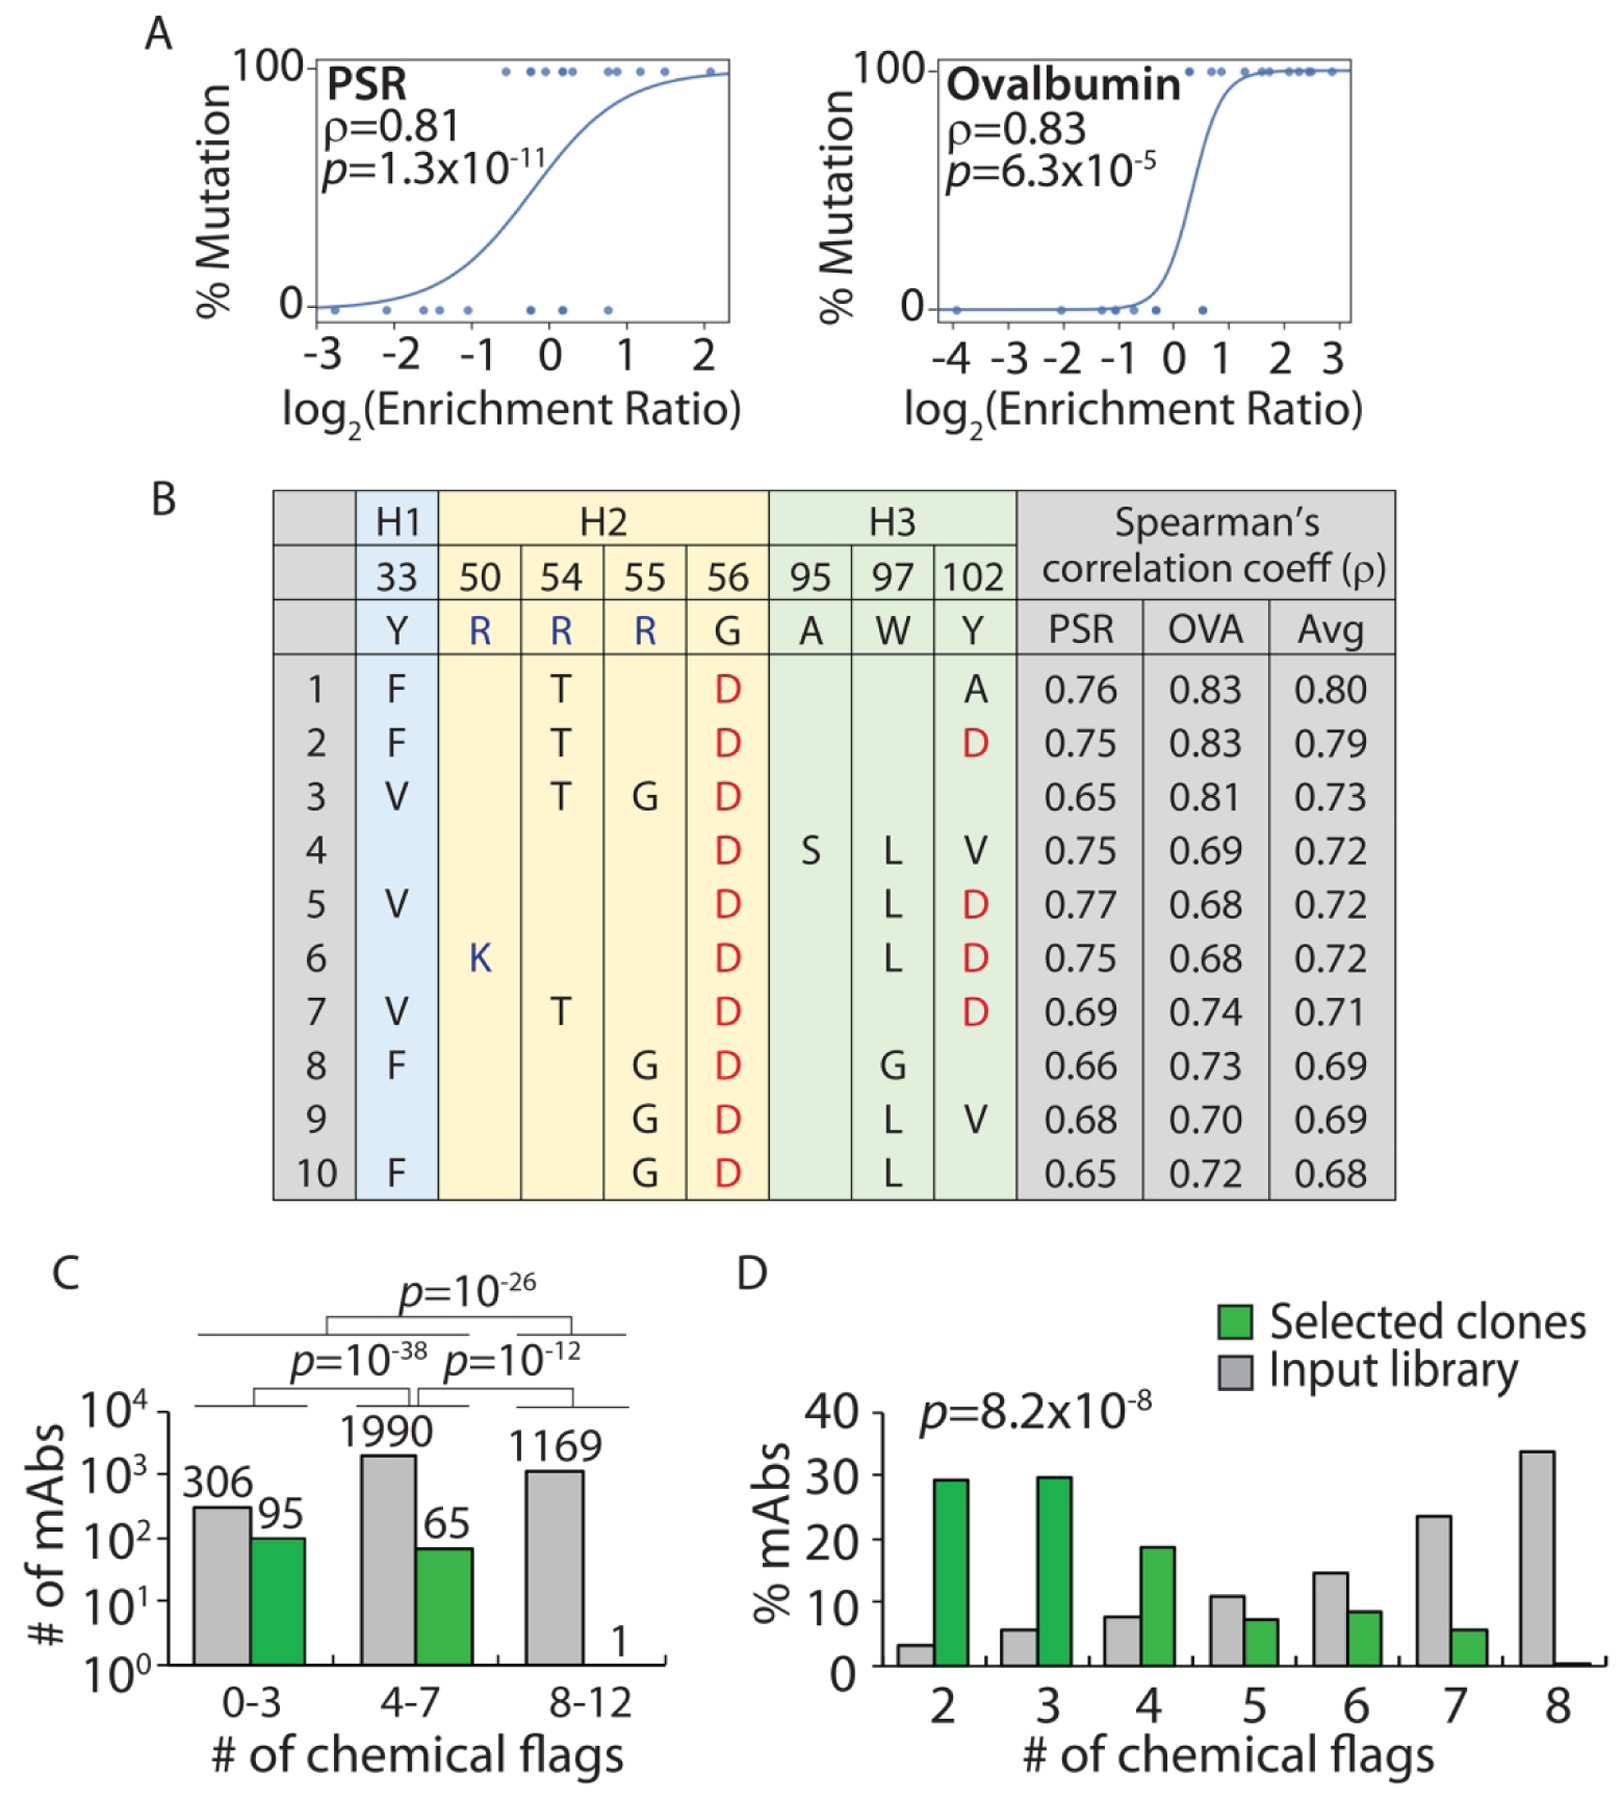
The ability of antibodies to recognize their target antigens with high specificity is fundamental to their natural function. Nevertheless, therapeutic antibodies display variable and difficult-to-predict levels of nonspecific and self-interactions that can lead to various drug development challenges, including antibody aggregation, abnormally high viscosity, and rapid antibody clearance. Here we report a method for predicting the overall specificity of antibodies in terms of their relative risk for displaying high levels of nonspecific or self-interactions at physiological conditions. We find that individual and combined sets of chemical rules that limit the maximum and minimum numbers of certain solvent-exposed amino acids in antibody variable regions are strong predictors of specificity for large panels of preclinical and clinical-stage antibodies. We also demonstrate how the chemical rules can be used to identify sites that mediate nonspecific interactions in suboptimal antibodies and guide the design of targeted sublibraries that yield variants with high antibody specificity. These findings can be readily used to improve the selection and engineering of antibodies with drug-like specificity.

Keywords: aggregation; developability; pharmacokinetics; polyspecificity; solubility; viscosity.


Conflict of interest statement

COMPETING FINANCIAL INTERESTS

None.

Figures

Figure 1.
Figure 1.
Overview of the methodology used to evaluate the molecular determinants of antibody specificity for monoclonal antibodies (mAbs). Each mAb received up to five physical flags based on exceeding limits for two self-interaction tests (AC-SINS >11.8 nm and CSI >0.01 response units) and three non-specific interaction tests (PSR >0.27, ELISA >1.9 signal/noise and BVP >4.3 signal/noise). The experimental data and limits were reported in a previous publication. The statistical significance was evaluated for the ability of the chemical rules to selectively flag mAbs with low specificity (≥2 physical flags) relative to mAbs with high specificity (<2 physical flags). The chemical rules were filtered using non-specific interaction measurements for an additional set of 424 preclinical mAbs to identify the most robust and general chemical rules.
Figure 2.
Figure 2.
Chemical rules for selectively flagging mAbs with low specificity that limit the maximum allowable number of solvent-accessible residues in antibody variable regions. Each chemical rule is a maximum limit on the summed counts of different types of amino acids in the CDRs weighted by their relative solvent accessibilities. (A) Most selective maximum chemical rule for identifying mAbs with low specificity. mAbs with >5.0 Gln, Arg, His, Pro, Met, Leu, Tyr and Trp residues – weighted by their solvent exposures – in five CDRs (heavy chain 1, 2 and 3 and light chain 2 and 3) are flagged. On the left, the percentage of mAbs flagged with high and low specificity are reported for entire set (137 mAbs). In the middle, the distribution of the percentage of mAbs with ranges of chemical flag values are reported. On the right, the average adjusted accuracy of the chemical rule for flagging low specific antibodies relative to high specific ones is reported for the training and test sets. (B) Summary of the ten most selective chemical rules that limit the maximum sum of particular types of residues. The bolded value of each rule is the most statistically significant one when evaluated for the entire panel of clinical-stage mAbs, while the range of values reflect those that met the constraints used during cross validation. In (A) and (B), the contributions of the residues to each rule are reported in terms of their contributions to the differences in the observed rule values for mAbs with low specificity (40 clinical-stage mAbs) relative to those with high specificity (97 clinical-stage mAbs). The relative contributions of each amino acid are represented as bold and underlined blue font (most important, >30%), regular and underlined blue font (important, 10–30%), black font (minor importance, 0–10%) and grey font (least important, <0%). The negative contributions of some residues are due to the fact that the contributions are calculated for the entire set of clinical-stage mAbs (137 mAbs) and not only for those mAbs flagged by each rule. mAbs with low and high specificity are defined as described in Fig. 1. The p-values were calculated using a 2×2 contingency table (Fisher’s exact test), and the reported accuracies are adjusted to account for the different numbers of mAbs with high (97) and low (40) specificity. In (A), the average adjusted accuracies are calculated based on the training (80%) and test (20%) sets for each of the ten splits of the training and test sets. In (B), the adjusted accuracies are calculated for the entire set of 137 clinical-stage mAbs using the best flag values.
Figure 3.
Figure 3.
Chemical rules for selectively flagging mAbs with low specificity that limit the minimum allowable number of solvent accessible residues in antibody variable regions. Each chemical rule is a minimum limit on the summed counts of different types of amino acids in the CDRs weighted by their relative solvent accessibilities. (A) Most selective minimum chemical rule for identifying mAbs with low specificity. mAbs with <11.6 Asn, Asp, Leu, Ala, Pro, Met, His, Glu and Gln residues – weighted by their solvent exposures – in VH are flagged. The graphs are presented as described in Fig. 2. (B) Summary of the ten most selective chemical rules that limit the minimum sum of particular types of residues. In (A) and (B), the contributions of the residues to each rule are reported are described in Fig. 2 except that the differences in the observed rule values are calculated for high specific mAbs relative to low specific mAbs. mAbs with low and high specificity are defined as described in Fig. 1. The p-values and accuracies were calculated as described in Fig. 2.
Figure 4.
Figure 4.
Combined chemical rules display high selectivity for identifying clinical-stage mAbs with low specificity. (A) Antibodies with predicted high specificity are required to be flagged by <8 of 12 rules. The contributions of the residues to each rule are reported as described in Figs. 2 and 3. (B) The combined rules selectively flag mAbs with low specificity (⩾2 physical flags) and display similar average adjusted accuracies for the training and test sets. The experimentally determined antibody specificities – as judged by five measurements of non-specific and self-interactions – are defined as described in Fig. 1. The p-values and adjusted accuracies were calculated as described in Fig. 2, and the area under the curve (AUC) is also reported.
Figure 5.
Figure 5.
Distributions of the number of chemical flags for clinical-stage mAbs with high and low specificity. The chemical flags are defined in Fig. 4A. The experimentally determined antibody specificities – as judged by five measurements of non-specific and self-interactions – are defined as described in Fig. 1. mAbs with high specificity are those with <2 physical flags and mAbs with low specificity are those with ≥2 physical flags. The adjusted accuracies are calculated as described in Fig. 2.
Figure 6.
Figure 6.
Comparison of the average rank for clinical-stage mAbs based on five measures of non-specific and self-interactions and the corresponding number of physical and chemical flags. (A) The average rank of mAbs with <2 physical flags (97 of 137 mAbs, 71% of mAbs) and ⩾2 physical flags (40 of 137 mAbs, 29% of mAbs) were calculated based on their ranks in five assays of self- and non-specific interactions. (B, C) The average experimental rank of mAbs compared to (B) <8 versus ⩾8 chemical flags and (C) the number of chemical flags. In (C), three regions are shown, one with predicted high specificity (0–3 chemical flags), a second one with intermediate specificity (4–7 chemical flags) and a third one with low specificity (8–12 chemical flags).
Figure 7.
Figure 7.
Combined chemical rules strongly differentiate between mAbs with different levels of non-specific and self-interactions for an independent set of antibodies. (A) Non-specific interactions (ELISA) and (B) self-interactions (AC-SINS) were measured for 39 mAbs that were not included in the training and test sets used to generate the combined chemical rules. The p-values were calculated using a two sample Anderson-Darling test. In (A), the difference between ⩽3 chemical flags and 4–7 chemical flags is not significant.
Figure 8.
Figure 8.
Design of Fab sub-libraries of emibetuzumab guided by the combined chemical rules and evaluation of selected mutants with improved antibody specificity. The VH domain of emibetuzumab was mutated at eight solvent-exposed sites (Y33, R50, R54, R55, G56, A95, W97 and Y102) in the three heavy chain CDRs that were flagged by the maximum chemical rules. The mutations sampled the wild-type residue as well as five mutations that are predicted to reduce the number of chemical flags. The libraries were constructed as single-chain Fab fragments (scFabs) on yeast, sorted for non-binding to two polyspecificity reagents [PSR and ovalbumin (OVA)], and evaluated via deep sequencing. (A) Enrichment ratios for antibody variants with a set of four mutations (F33, T54, D56 and A102 in VH) relative to antibody variants with wild-type residues at the same positions (Y33, R54, G56 and Y102 in VH) for two different polyspecificity reagents. The curves (logistic regressions) are guides to the eye. (B) Top ten sets of four mutation combinations that are most strongly correlated with reduced binding to polyspecificity reagents and increased specificity. (C, D) The (C) number and (D) percentage of mAb variants selected with high specificity as a function of the number of chemical flags relative to the corresponding values for the input library. In (A), the mAbs included in the wild-type or mutant groups are only required to have wild-type or mutant residues at the four evaluated sites and can have either wild-type or mutant residues at the other four sites. Moreover, the p-values are for the Spearman’s correlation coefficients (ρ). In (C), the p-values for the comparisons of the number of mAbs were calculated using a 2×2 contingency table (Fisher’s exact test). In (D), the p-value for comparing the distributions of mAbs was calculated using paired sample t-test (two tailed).

Similar articles

Cited by

References

    1. Tiller KE; Tessier PM Advances in antibody design. Annu Rev Biomed Eng 2015, 17, 191–216. - PMC - PubMed
    1. Wardemann H; Yurasov S; Schaefer A; Young JW; Meffre E; Nussenzweig MC Predominant autoantibody production by early human B cell precursors. Science 2003, 301, (5638), 1374–1377. - PubMed
    1. Maynard J; Georgiou G Antibody engineering. Annu Rev Biomed Eng 2000, 2, 339–76. - PubMed
    1. Perchiacca JM; Tessier PM Engineering aggregation-resistant antibodies. Annu Rev Chem Biomol Eng 2012, 3, 263–86. - PubMed
    1. Perchiacca JM; Ladiwala AR; Bhattacharya M; Tessier PM Aggregation-resistant domain antibodies engineered with charged mutations near the edges of the complementarity-determining regions. Protein Eng Des Sel 2012, 25, (10), 591–601. - PubMed

Publication types

MeSH terms

Substances