Review
. 2020 Aug 31:21:139-162.
doi: 10.1146/annurev-genom-120219-080406. Epub 2020 May 26.

Pangenome Graphs

Affiliations
Review

Pangenome Graphs

Jordan M Eizenga et al. Annu Rev Genomics Hum Genet. .

Abstract

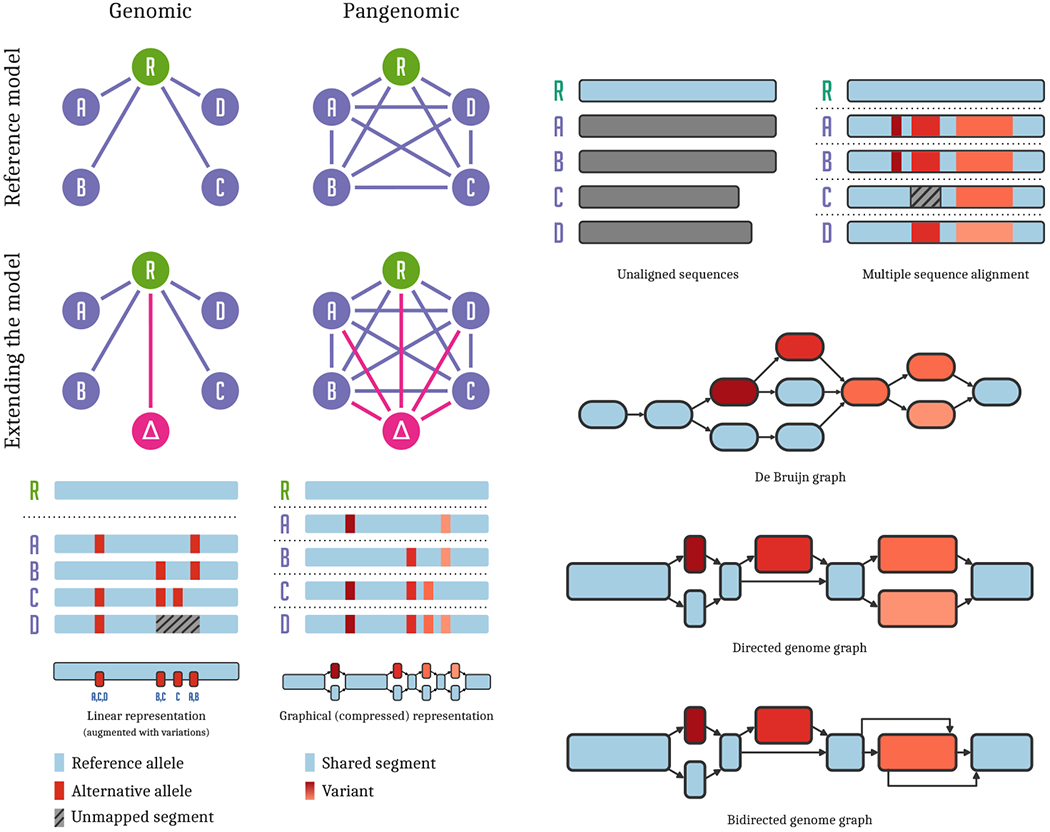
Low-cost whole-genome assembly has enabled the collection of haplotype-resolved pangenomes for numerous organisms. In turn, this technological change is encouraging the development of methods that can precisely address the sequence and variation described in large collections of related genomes. These approaches often use graphical models of the pangenome to support algorithms for sequence alignment, visualization, functional genomics, and association studies. The additional information provided to these methods by the pangenome allows them to achieve superior performance on a variety of bioinformatic tasks, including read alignment, variant calling, and genotyping. Pangenome graphs stand to become a ubiquitous tool in genomics. Although it is unclear whether they will replace linearreference genomes, their ability to harmoniously relate multiple sequence and coordinate systems will make them useful irrespective of which pangenomic models become most common in the future.

Keywords: genome graph; pangenome; variation graph.


Conflict of interest statement

DISCLOSURE STATEMENT

The authors are not aware of any affiliations, memberships, funding, or financial holdings that might be perceived as affecting the objectivity of this review.

Figures

Figure 1:
Figure 1:
Pangenomic models. Left panel: top left: In reference based genomic analyses, all genomes (AD) are compared to each other via their relationship to the reference genome R. top right: In a pangenomic setting, we attempt to model direct relationships between all the genomes in our analysis, of which a particular reference R is chosen arbitrarily. middle left: When extending our analysis with a new genome, Δ, we add it to the genomic model by comparing it to reference R. middle right: In contrast, adding a new genome to a pangenomic analysis compares it directly with all other genomes in the model. bottom left: Regions of some genomes are unalignable against the reference, and cannot be represented in a list of variants. bottom right: A graphical model of the genomes allows direct all-to-all comparison, capturing all of their sequence relationships. Right panel: top left: A collection of sequences representing a pangenome. top right: Multiple sequence alignment of the sequences captures their mutual relationships. middle top: In a de Bruijn graph, sequences are represented without bias, but variants may correspond to larger graph structures. middle bottom: An acyclic sequence graph is equivalent to the multiple sequence alignment. bottom: A generic sequence graph can represent a structural variant (in orange, right) compactly, using edges between the forward and reverse strands of the graph to indicate the presence of an inversion.
Figure 2:
Figure 2:
Visualizing a graph of GRCh38 and its alternate sequences in the gene HLA-DRB1 built with VG msga (48). Top: Bandage’s force directed layout reveals large scale structures (142). Top middle: ODGI viz’s binned, linearized rendering of the paths (colored bars) versus the sequence and topology of the graph (below). Bottom middle: A fragment of VG viz’s linearized rendering, showing base-level detail. Bottom: The same fragment rendered with the Sequence Tube Map (13). Dashed lines show correspondence between the visualizations. Path colors are assigned independently by each method.
Figure 3:
Figure 3:
The mean alternate allele fraction at heterozygous variants in HG002/NA24385 validated in the Genome in a Bottle truth set (148) as a function of deletion or insertion size (SNPs at 0). Error bars are ± 1 s.e.m. Blue points show the allele balance metric across allele lengths for alignments with bwa mem (83) and variant calls made by freebayes (50). Variant calls were made with alignment to a variation graph built from the 1000 Genomes Project variants (1), followed by variant calling in VG. These are divided into two groups: calls at variants in the graph used for the alignment (red) and those to variants that are private to HG002 (green). Reprinted from (51).

References

    1. 1000 Genomes Project Consortium, et al. 2015. A global reference for human genetic variation. Nature 526:68. - PMC - PubMed
    1. Aguiar VRC, César J, Delaneau O, Dermitzakis ET, Meyer D. 2019. Expression estimation and eQTL mapping for HLA genes with a personalized pipeline. PLoS Genet. 15:e1008091. - PMC - PubMed
    1. Alonso-Blanco C, Andrade J, Becker C, Bemm F, Bergelson J, et al. 2016. 1,135 genomes reveal the global pattern of polymorphism in Arabidopsis thaliana. Cell 166:481–491 - PMC - PubMed
    1. Ambler JM, Mulaudzi S, Mulder N. 2019. GenGraph: a python module for the simple generation and manipulation of genome graphs. Bioinformatics 20 - PMC - PubMed
    1. Amir A, Lewenstein M, Lewenstein N. 1997. Pattern matching in hypertext. In Lecture Notes in Computer Science. Springer Berlin Heidelberg, 160–173

Publication types