. 2020 May 27;287(1927):20200787.
doi: 10.1098/rspb.2020.0787. Epub 2020 May 27.

The evolution of host resistance and parasite infectivity is highest in seasonal resource environments that oscillate at intermediate amplitudes

Affiliations

The evolution of host resistance and parasite infectivity is highest in seasonal resource environments that oscillate at intermediate amplitudes

Charlotte Ferris et al. Proc Biol Sci. .

Abstract

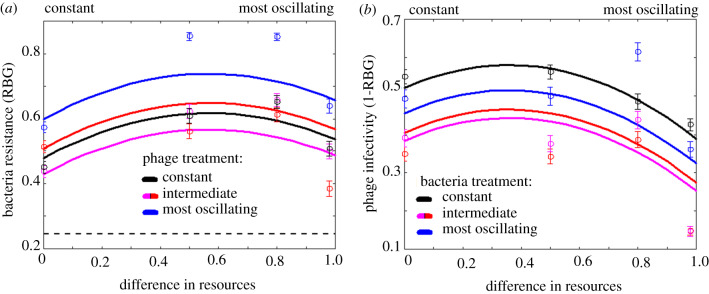
Seasonal environments vary in their amplitude of oscillation but the effects of this temporal heterogeneity for host-parasite coevolution are poorly understood. Here, we combined mathematical modelling and experimental evolution of a coevolving bacteria-phage interaction to show that the intensity of host-parasite coevolution peaked in environments that oscillate in their resource supply with intermediate amplitude. Our experimentally parameterized mathematical model explains that this pattern is primarily driven by the ecological effects of resource oscillations on host growth rates. Our findings suggest that in host-parasite systems where the host's but not the parasite's population growth dynamics are subject to seasonal forcing, the intensity of coevolution will peak at intermediate amplitudes but be constrained at extreme amplitudes of environmental oscillation.

Keywords: Pseudomonas fluorescens; adaptive dynamics; coevolution; host–parasite; mathematical modelling; oscillating environment.


Conflict of interest statement

We declare we have no competing interests.

Figures

Figure 1.
Figure 1.
Effect of resource oscillation amplitude on the ecological dynamics of bacteria and phage. (a,b,c) Bacterial population dynamics. (d,e,f) Phage population dynamics. (a,d) Mean log10 population densities per ml ± s.e. Grey shading indicates timepoints with high resource levels, whereas white shading indicates timepoints with low resource levels. (b,d) Mean fluctuation index ± s.e. (equation (2.2); [47]). (c,f) Mean synchrony between replicates ± s.e. (equation (2.3); [48]). Analysis of phage densities omitted extinct phage replicates. (Online version in colour.)
Figure 2.
Figure 2.
(a) Bacterial resistance (RBG) against phage populations evolved under four resource oscillation amplitude regimens. The black dashed line indicates the mean RBG for ancestral bacteria against all phage populations. (b) Phage infectivity (1-RBG) against bacterial populations evolved under four resource oscillation amplitude regimens. Circles mark mean resistance/infectivity ± s.e. for each bacteria and phage treatment. (Online version in colour.)
Figure 3.
Figure 3.
Mean maximum growth rate of ancestral (blue) and phage-resistant mutant (red) bacteria in the absence of phage grown under different resource concentrations ± s.e. Black lines show the statistically fitted curves used for the mathematical model in terms of resource concentration (see also figure 4a and the electronic supplementary material, Appendix B.2). Grey stripes indicate the resource concentrations used in the coevolution experiment. (Online version in colour.)
Figure 4.
Figure 4.
(a) Change in the maximum/minimum of the oscillating birth rate births(t), corresponding to growth in the high and low resource environments, as the amplitude of oscillations δ varies (blue). Maximum = 0.3684δ; minimum = −0.0699 δ/(1–0.9225δ). The black dashed line shows the average birth rate at amplitude δ. Insert: step function between minimum and maximum, with an equal amount of time spent in each environment. (b) Evolved host resistance u* and (c) evolved parasite infectivity v* as amplitude δ increases. (Online version in colour.)

Similar articles

Cited by

References

    1. Fels D, Kaltz O. 2006. Temperature dependent transmission and latency of Holosporaundulata, a micronucleus-specific parasite of the ciliate Paramecium caudatum. Proc. R. Soc. B 273, 1031–1038. (10.1098/rspb.2005.3404) - DOI - PMC - PubMed
    1. Vale PF, Stjernman M, Little TJ. 2008. Temperature dependent costs of parasitism and maintenance of polymorphism under genotype-by-environment interactions. J. Evol. Biol. 21, 1318–1427. (10.1111/j.1420-9101.2008.01555.x) - DOI - PubMed
    1. Lopez-Pascua L, Gandon S, Buckling A. 2012. Abiotic heterogeneity drives parasite local adaptation in coevolving bacteria and phages. J. Evol. Biol. 25, 187–195. (10.1111/j.1420-9101.2011.02416.x) - DOI - PubMed
    1. Lopez-Pascua L, Hall AR, Best A, Morgan AD, Boots M, Buckling A. 2014. Higher resources decrease fluctuating selection during host–parasite coevolution. Ecol. Lett. 17, 1380–1388. (10.1111/ele.12337) - DOI - PMC - PubMed
    1. Zeller M, Koella JC. 2017. The role of the environment in the evolution of tolerance and resistance to a pathogen. Am. Nat. 190, 389–397. (10.1086/692759) - DOI - PubMed

Publication types