. 2020;10(3):581-599.
doi: 10.1016/j.jcmgh.2020.05.004. Epub 2020 May 23.

Differential Contribution of Pancreatic Fibroblast Subsets to the Pancreatic Cancer Stroma

Affiliations

Differential Contribution of Pancreatic Fibroblast Subsets to the Pancreatic Cancer Stroma

Paloma E Garcia et al. Cell Mol Gastroenterol Hepatol. 2020.

Abstract

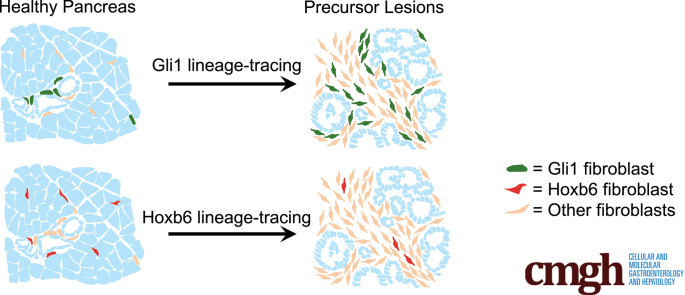
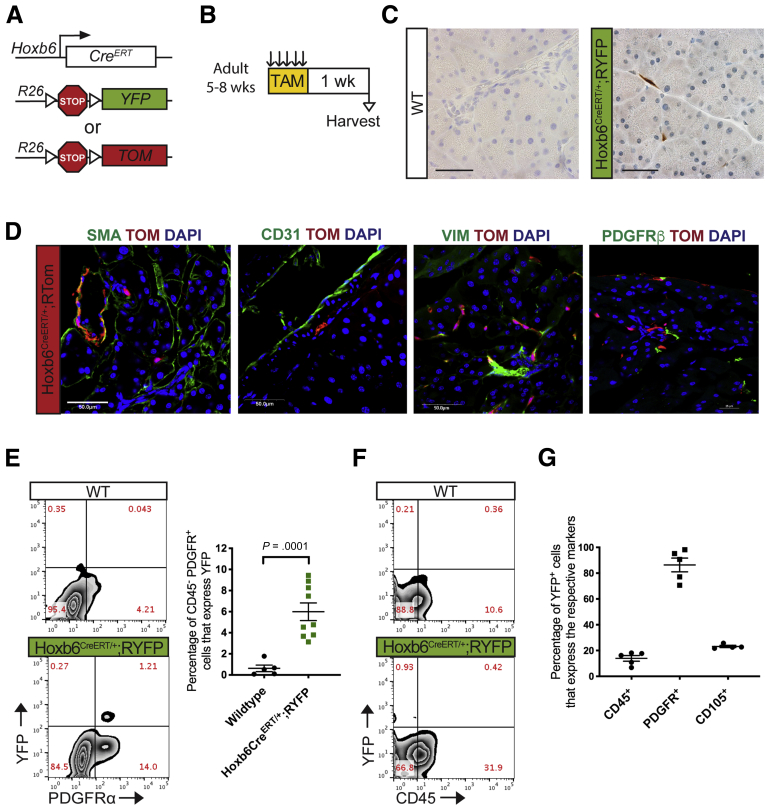
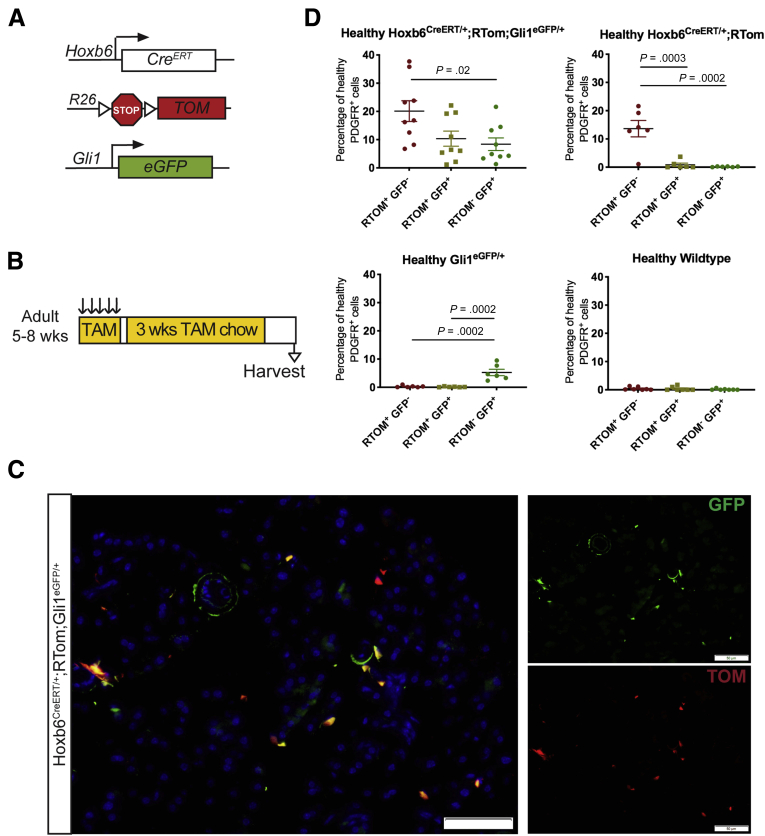
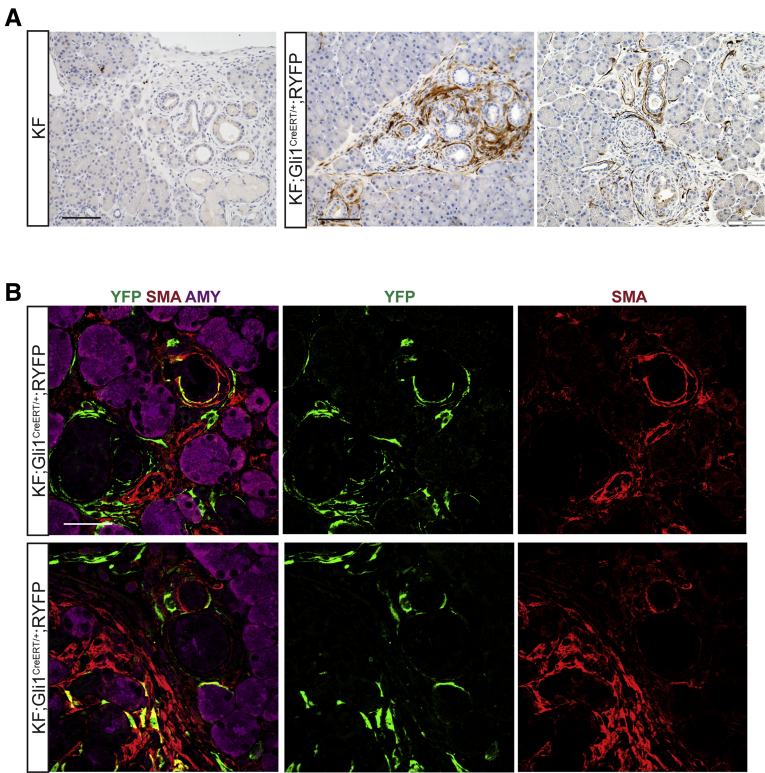
Background & aims: Although the healthy pancreas consists mostly of epithelial cells, pancreatic cancer and the precursor lesions known as pancreatic intraepithelial neoplasia, are characterized by an extensive accumulation of fibroinflammatory stroma that includes a substantial and heterogeneous fibroblast population. The cellular origin of fibroblasts within the stroma has not been determined. Here, we show that the Gli1 and Hoxb6 markers label distinct fibroblast populations in the healthy mouse pancreas. We then set out to determine whether these distinct fibroblast populations expanded during carcinogenesis.

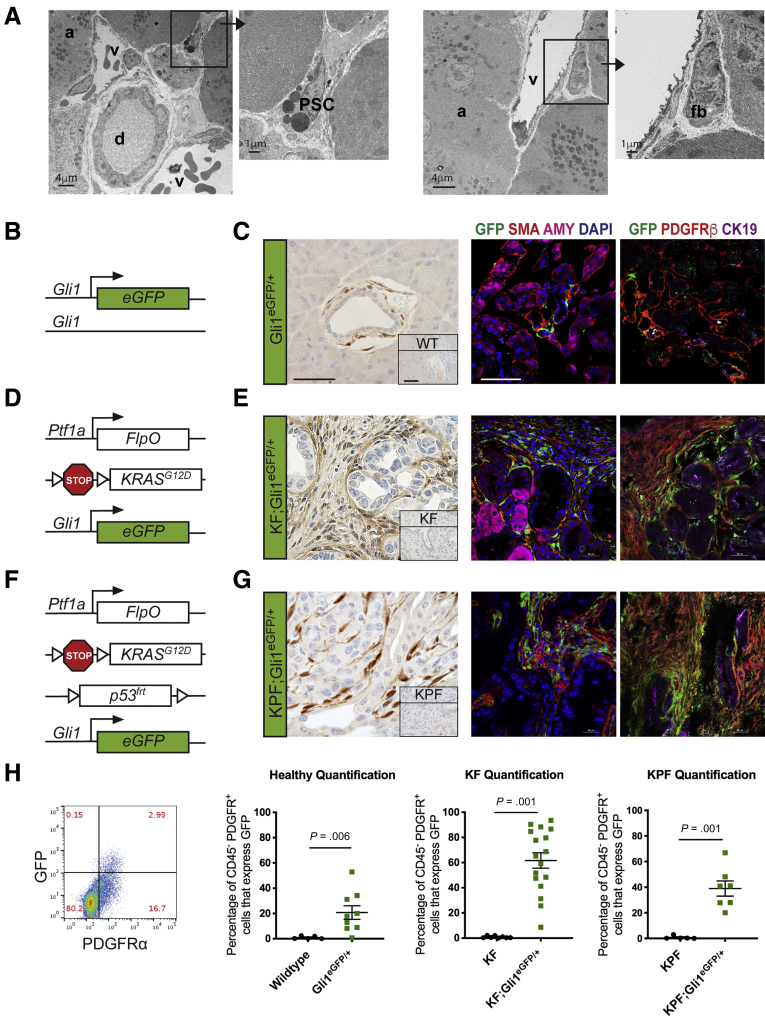
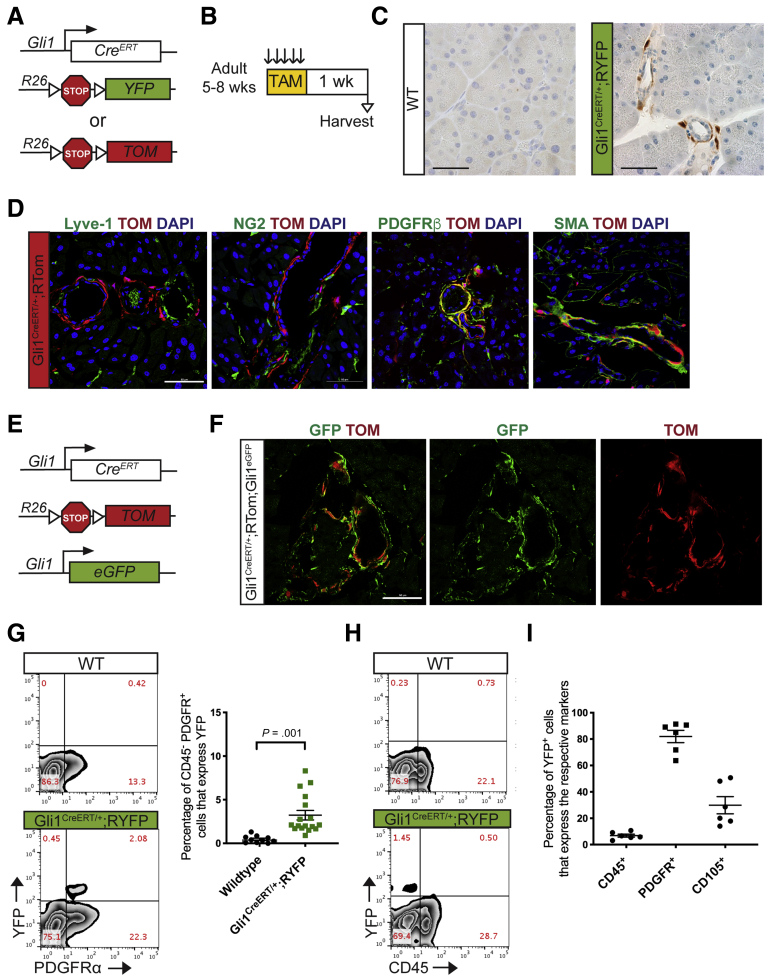
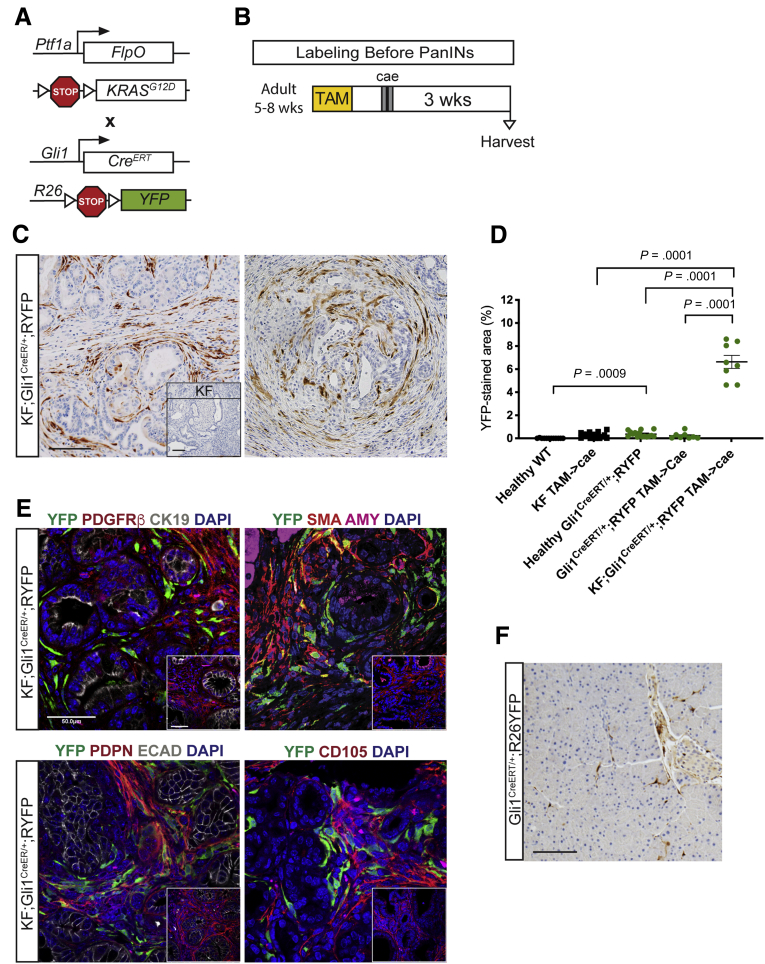
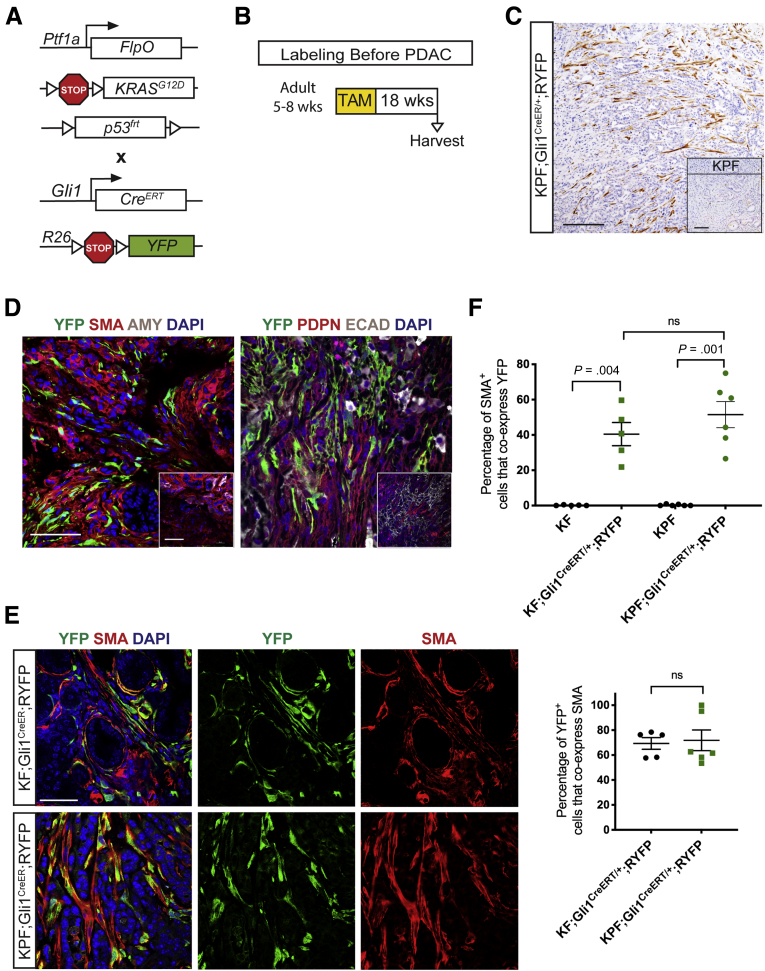
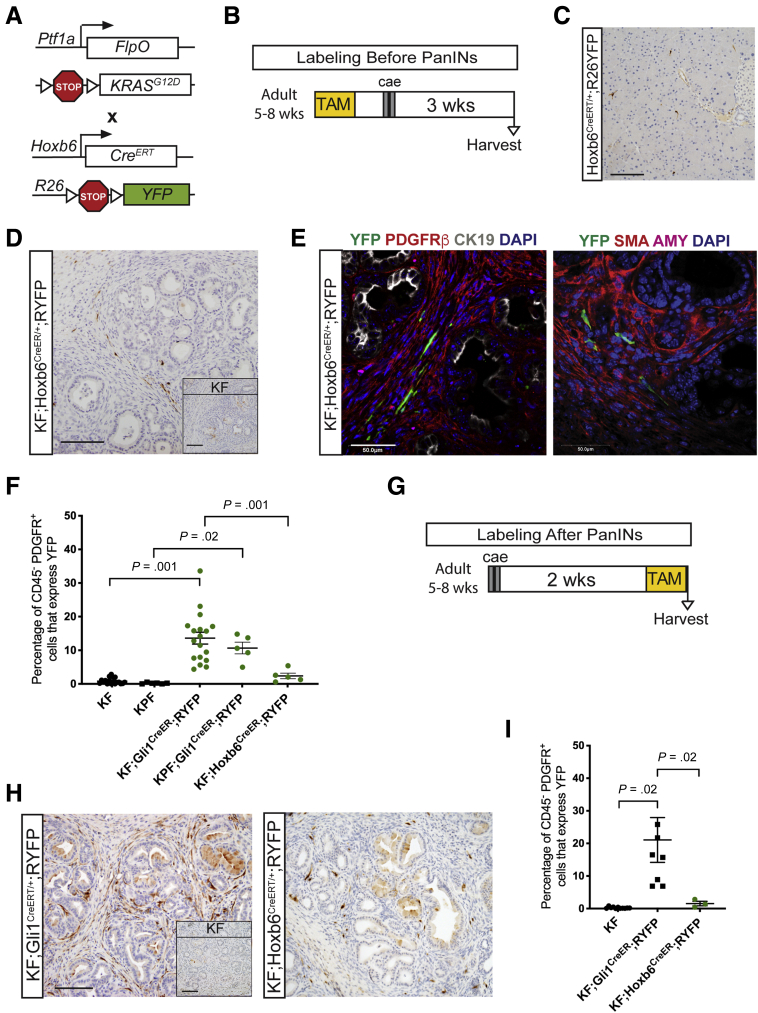
Methods: We developed genetically engineered models using a dual-recombinase approach that allowed us to induce pancreatic cancer formation through codon-optimized Flp recombinase-driven epithelial recombination of Kirsten rat sarcoma viral oncogene homolog while labeling Gli1+ or Hoxb6+ fibroblasts in an inducible manner. By using these models, we lineage-traced these 2 fibroblast populations during the process of carcinogenesis.

Results: Although in the healthy pancreas Gli1+ fibroblasts and Hoxb6+ fibroblasts are present in similar numbers, they contribute differently to the stroma in carcinogenesis. Namely, Gli1+ fibroblasts expand dramatically, whereas Hoxb6+ cells do not.

Conclusions: Fibroblasts present in the healthy pancreas expand during carcinogenesis, but with a different prevalence for different subtypes. Here, we compared Gli1+ and Hoxb6+ fibroblasts and found only Gli1+ expanded to contribute to the stroma during pancreatic carcinogenesis.

Keywords: Cancer-Associated Fibroblasts (CAFs); Gli1; Heterogeneity; Lineage-Trace; Pancreas.


Figures

None
Graphical abstract
Figure 1
Figure 1
Gli1+fibroblasts are present in the healthy and neoplastic pancreas. (A) TEM images of a healthy mouse pancreas. Black squares and arrows indicate sections that are magnified. (B) Genetic scheme for the knock-in Gli1EGFP/+ reporter mouse. (C) Immunohistochemical staining for GFP and IF staining of GFP (green), αSMA (red), and amylase (pink); and GFP (green), PDGFRβ (red), and CK19 (pink) in healthy Gli1EGFP/+ mice and wild-type (inset) mice. Scale bar: 50 um. (D) Genetic scheme for the Ptf1aFlpO/+;KrasFRT-stop-FRT-G12D/+;Gli1EGFP/+ (KF;Gli1EGFP/+) mouse. (E) IHC staining for GFP and the IF staining panels in KF;Gli1EGFP/+ and KF-negative control (inset) mice after 3 weeks of cerulein-induced acute pancreatitis. (F) Genetic scheme for the KF;Trp53FRT-stop-FRT/+,Gli1EGFP/+ (KPF;Gli1EGFP/+) mouse. (G) IHC staining for GFP and the IF staining panels in KPF;Gli1EGFP/+ and KPF-negative control (inset) mice after evidence of disease burden. (H) Representative flow cytometry plot of GFP against PDGFR⍺, gated on 4′,6-diamidino-2-phenylindole (DAPI)- CD45- cells, and quantification of the percentage of GFP+ PDGFR⍺+ cells at the different disease stages (n ≥ 5). All data are expressed as means ± SEM. a, acinar cell; AMY, amylase; CK19, cytokeratin 19; d, duct; EGFP, enhanced green fluorescent protein; fb, fibroblast; PSC, pancreatic stellate cell; v, blood vessel.
Figure 2
Figure 2
CreERT model labels healthy adult Gli1-expressing fibroblasts. (A) Genetic scheme for Gli1CreERT/+ crossed with either a Rosa26YFP/+ or a Rosa26tdTomato/+ reporter. (B) Experimental design for examining healthy adult mice expressing Gli1 in the pancreas. Adult mice ages 5–8 weeks were given tamoxifen gavages (4 mg/mouse/day) for 5 days. Tissue was examined 1 week after completing gavages. (C) IHC staining for YFP in healthy adult mice. Scale bar: 50 um. (D) IF staining of the following: Lyve-1 (green), Tomato (red), and DAPI (blue); NG2 (green), Tomato (red), and DAPI (blue); PDGFRβ (green), Tomato (red), and DAPI (blue); and αSMA (green), Tomato (red), and DAPI (blue) in Gli1CreERT/+;RTom samples. Scale bar: 50 um. (E) Genetic scheme for a Gli1CreER/+;Gli1EGFP/+,RTomato mouse model. (F) IF staining of GFP and Tomato in the Gli1CreERT/+;Gli1EGFP/+;RTom mouse. Scale bar: 50 um. (G) Representative YFP vs PDGFR⍺, flow cytometry plots of DAPI- cells in a healthy Gli1CreERT/+;RYFP mouse and wild-type control and the quantification (n ≥ 10). (H) Representative YFP vs CD45 flow cytometry plot. (I) Quantification of the percentage of YFP+ cells that expressed CD45, PDGFR⍺, or CD105, as determined by flow cytometry gating. All data are expressed as means ± SEM. TAM, tamoxifen; TOM, Tomato; WT, wild-type.
Figure 3
Figure 3
Gli1+fibroblasts lineage-traced before pancreatitis-induced PanIN lesion formation contribute to the stroma. (A) Genetic scheme for a KF;Gli1CreERT/+;RYFP mouse. (B) Experimental design for labeling healthy Gli1+ cells before PanIN generation. Adult mice 5–8 weeks old were given 5 tamoxifen gavages and rested for a week before 2 days of cerulein injections to induce pancreatitis. After 3 weeks, samples were collected. (C) IHC staining for YFP in KF;Gli1CreERT/+;RYFP and KF control tissue (inset) labeled before PanIN generation. Scale bar: 100 um. (D) Quantification of YFP+ staining area from IHC (n ≥ 8) (E) IF staining on KF;Gli1CreERT/+;RYFP and KF control (inset) samples of YFP (green), PDGFRβ (red), cytokeratin 19 (CK19) (white), and 4′,6-diamidino-2-phenylindole (DAPI) (blue); YFP (green), αSMA (red), amylase (pink), and DAPI (blue); YFP (green), podoplanin (red), E-cadherin (white), and DAPI (blue); and YFP (green), CD105 (red), and DAPI (blue). Scale bar: 50 um. (F) A representative YFP IHC image of a Gli1CreERT/+;RYFP mouse that followed the same labeling scheme. Scale bar: 100 um. AMY, amylase; ECAD, E-cadherin; TAM, tamoxifen; WT, wild-type.
Figure 4
Figure 4
Gli1+fibroblasts contribute to the stroma when lineage-traced in a spontaneous pancreatic carcinogenesis model. (A) Genetic scheme for a KPF;Gli1CreERT/+;RYFP mouse. (B) Experimental design for labeling healthy Gli1+ cells before spontaneous carcinogenesis. Adult mice 5–8 weeks old were given 5 tamoxifen gavages, aged, and then harvested on evidence of disease burden. (C) IHC staining for YFP in KPF;Gli1CreERT/+;RYFP and KPF control (inset) mice. Scale bar: 100 um. (D) IF staining for YFP (green), αSMA (red), amylase (gray), and DAPI (blue); and YFP (green), podoplanin (red), E-cadherin (white), and DAPI (blue) in KPF;Gli1CreERT/+;RYFP and KPF control (inset) samples. Scale bar: 50 um. (E) Merged and single-channel IF images for YFP (green), αSMA (red), and DAPI (blue) in KF and KPF Gli1CreER;RYFP samples. Scale bar: 50 um. (F) IF quantification of the percentage of αSMA+ cells that co-expressed YFP in lineage-traced KF and KPF samples (n ≥ 5). (F) IF quantification of the percentage of YFP+ cells that co-expressed αSMA in lineage-traced KF and KPF samples (n ≥ 8). All data are expressed as means ± SEM. AMY, amylase; TAM, tamoxifen.
Figure 5
Figure 5
Hoxb6 labels a subset of mesenchymal cells in the healthy pancreas. (A) Genetic scheme for Hoxb6CreERT/+ crossed with either a RYFP reporter or RTomato reporter. (B) Experimental protocol for examining healthy adult mice expressing Hoxb6 in the pancreas. Adult mice aged 5–8 weeks were given tamoxifen gavages (4 mg/mouse/day) for 5 days. Tissue was examined 1 week after completing gavages. (C) IHC staining for YFP in healthy adult mice. Scale bar: 50 um. (D) IF staining of αSMA (green), Tomato (red), and 4′,6-diamidino-2-phenylindole (DAPI) (blue); CD31 (green), Tomato (red), and DAPI (blue); vimentin (green), Tomato (red), and DAPI (blue); and PDGFRβ (green), Tomato (red), and DAPI (blue) in healthy Hoxb6CreERT/+;RTom tissue. Scale bar: 50 um. (E) Representative YFP vs PDGFR⍺+ flow cytometry plots of DAPI- cells in a Hoxb6CreERT/+;RYFP mouse and wild-type control and the quantification (n ≥ 5). (F) Representative YFP vs CD45 flow cytometry plot. (G) Quantification of the percentage of YFP+ cells that expressed CD45, PDGFR⍺, or CD105 as determined by flow cytometry gating. All data are expressed as means ± SEM. TAM, tamoxifen; VIM, vimentin; WT, wild-type.
Figure 6
Figure 6
Hoxb6 and Gli1 are expressed in different populations. (A) Genetic scheme for a Hoxb6CreERT/+;RTom;Gli1EGFP/+ mouse model. (B) Experimental design for examining healthy Hoxb6CreERT/+;RTom;Gli1EGFP/+ mice. Adult mice aged 5–8 weeks were given tamoxifen gavages (4 mg/mouse/day) for 5 days. Mice then were placed on tamoxifen chow for 3 weeks. Tissue was examined 1 week after completing chow regimen. (C) IF staining of GFP and Tomato in the Hoxb6CreERT/+;RTom;Gli1EGFP/+ mouse. Scale bar: 50 um. (D) Flow cytometry quantification of the percentage of healthy CD45- PDGFR⍺+ cells that expressed Tomato, GFP, or both (n ≥ 6). All data are expressed as means ± SEM. RTOM, Rosa26LSL-tdTomato; TAM, tamoxifen.
Figure 7
Figure 7
Hoxb6+fibroblasts do not contribute to the pancreatic stroma. (A) Genetic scheme for the KF;Hoxb6CreERT/+;RYFP model. (B) Experimental design for labeling healthy Hoxb6+ cells before PanIN generation. Adult mice 5–8 weeks old were given 5 tamoxifen gavages and rested a week before 2 days of cerulein injections to induce pancreatitis. After 3 weeks, mice were harvested. (C) A representative YFP IHC image of a Hoxb6CreERT/+;RYFP mouse following the protocol. Scale bar: 100 um. (D) IHC staining for YFP in KF;Hoxb6CreERT/+;RYFP and KF control (inset) mice labeled before PanIN generation. Scale bar: 100 um. (E) IF staining panels of YFP (green), PDGFRβ (red), cytokeratin 19 (CK19) (white), DAPI (blue); and YFP (green), αSMA (red), amylase (pink), and DAPI (blue) in KF;Hoxb6CreERT/+;RYFP mice labeled before PanIN generation. Scale bar: 50 um. (F) Flow cytometry quantification of the percentage of CD45- PDGFR+ cells that expressed YFP in lineage-traced Gli1 and Hoxb6 mice and their controls (n ≥ 5). (G) Experimental design for labeling after PanIN generation. Adult mice 5–8 weeks old were given cerulein injections, rested for 2 weeks, and then given 5 gavages of tamoxifen before tissue collection. (H) IHC staining for YFP in KF;Gli1CreERT/+;RYFP and KF;Hoxb6CreERT/+;RYFP mice labeled after PanIN generation. Inset shows KF control. Scale bar: 100 um. (C) Flow cytometry quantification of the percentage of CD45-PDGFR+ cells that express YFP in KF;Gli1CreERT/+;RYFP and KF;Hoxb6CreERT/+;RYFP mice labeled after PanIN generation (n ≥ 3). All data are expressed as means ± SEM. AMY, amylase.
Figure 8
Figure 8
Lineage-traced Gli1 fibroblasts are present around the earliest lesion development. (A) IHC staining for YFP in KF;Gli1CreERT/+;RYFP mice labeled before PanIN generation. Scale bar: 100 um. (B) IF merged and single-channel images for YFP (green), αSMA (red), and amylase (pink) in KF;Gli1CreERT/+;RYFP mice. Scale bar: 50 um. AMY, amylase.

Comment in

References

    1. Rahib L., Smith B.D., Aizenberg R., Rosenzweig A.B., Fleshman J.M., Matrisian L.M. Projecting cancer incidence and deaths to 2030: the unexpected burden of thyroid, liver, and pancreas cancers in the United States. Cancer Res. 2014;74:2913–2921. - PubMed
    1. Rawla P., Sunkara T., Gaduputi V. Epidemiology of pancreatic cancer: global trends, etiology and risk factors. World J Oncol. 2019;10:10. - PMC - PubMed
    1. Erkan M., Michalski C.W., Rieder S., Reiser–Erkan C., Abiatari I., Kolb A., Giese N.A., Esposito I., Friess H., Kleeff J. The activated stroma index is a novel and independent prognostic marker in pancreatic ductal adenocarcinoma. Clin Gastroenterol Hepatol. 2008;6:1155–1161. - PubMed
    1. Zhang Y., Crawford H.C., Pasca di Magliano M. Epithelial-stromal interactions in pancreatic cancer. Annu Rev Physiol. 2018;81:1–23. - PubMed
    1. von Ahrens D., Bhagat T.D., Nagrath D., Maitra A., Verma A. The role of stromal cancer-associated fibroblasts in pancreatic cancer. J Hematol Oncol. 2017;10:76. - PMC - PubMed

Publication types

LinkOut - more resources