. 1994 Jan;98(1):334-342.
doi: 10.1021/j100052a055.

Light Quenching and Fluorescence Depolarization of Rhodamine B and Applications of This Phenomenon to Biophysics

Affiliations

Light Quenching and Fluorescence Depolarization of Rhodamine B and Applications of This Phenomenon to Biophysics

Joseph R Lakowicz et al. J Phys Chem. 1994 Jan.

Abstract

The fluorescence intensity of rhodamine B (RhB) was found to display a sublinear dependence on incident power when excited with the focused output of a cavity-dumped dye laser. This effect was found to be proportional to the amplitude of the emission spectrum at the incident wavelength and to be associated with a decrease in the time-zero anisotropy of RhB. The absence of changes in the intensity decay law or rotational correlation time indicates the absence of photochemical processes. These results are consistent with "light quenching" of RhB due to stimulated emission. In viscous solution the extent of depolarization of the emission was found to be in agreement with theoretical expressions which account for photoselective light quenching and for spatial inhomogeneities in the incident laser beam. The phenomenon of light quenching has numerous potential applications in biophysics, such as studies of the orientation and dynamics of fluorescent macromolecules.


Figures

Figure 1.
Figure 1.
Absorption (A) and emission (F) spectra of rhodamine B in ethylene glycol at 20 ° C . The symbols (●) on the mission spectrum show the relative light quenching cross sections (Q- 1)/P. The emission of RhB was isolated using a 560-nm interference filter (--).
Figure 2.
Figure 2.
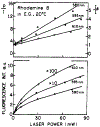
Dependence of the rhodamine B fluorescence intensity on the laser power for selected wavelengths of the excitation (quenching) light (lower panel). The upper panel shows the corresponding Stem-Volmer plots. In all experiments the steady-state intensities or intensity decay data were obtained wing magic-angle polarization conditions.
Figure 3.
Figure 3.
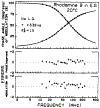
Frequency-domain intensity decay data for rhodamine B in ethyleneglycol at 20°C. The light quenching was eliminated (significantly reduced) by a 20-fold attenuation of peak laser power using a neutral density filter.
Figure 4.
Figure 4.
Frequency-domain intensity data for rhodamine B in ethylene glycol at 20 °C, in the presence of light quenching (Q = 3.2). In Figure 3 and this figure, the solid lines show the best single exponential fits, and the lower panels, the phase and modulation deviations.
Figure 5.
Figure 5.
Frequency-domain anisotropy decay data for rhodamine B in ethylene glycol at 20 ° C . In the presence of light quenching (Q = 3.2) (●), the time-zero anisotropy is reduced from 0.38 to0.25. The correlation time is unchanged.
Figure 6.
Figure 6.
Stern-Volmer representation of the light quenching data for rhodamine B in glycerol at 5 ° C (●). The dashed line (-○-) shows the RhB intensities obtained with unfocused laser excitation.
Figure 7.
Figure 7.
Steady-state anisotropies of RhB in glycerol (top) and ethylene glycol (bottom) observed with focused illumination. The open dots (-○-) show the anisotropies measured with unfocused laser illumination where there is no light quenching (I0/I = 1.0). The dashed line shows the theoretical prediction for a uniform (U) or a Gaussian (G) beam profiles.
Figure 8.
Figure 8.
Dependence of fluorescence anisotropy on the amount of quenching Q = I0/I for one beam experiment (—), assuming no rotational diffusion during the lifetime of the excited state. For the calculations (—) we assumed a pulse width of tp = 5 ps and a decay time of τ = 3.5 ns, to be comparable with the experimental results. The dashed line (--) shows the anisotropy predicted for stationary quenching by continuous illumination, as described by Mazurenko.
Figure 9.
Figure 9.
Light quenching and time-dependent spectral relaxation.
Figure 10.
Figure 10.
Light quenching and rotational diffusion.
Figure 11.
Figure 11.
Light quenching with a time-delayed quenching pulse.
SCHEME 1:
SCHEME 1:
Schematic of the Effects of Intense Pulsed Excitation (Top) on the Intensity (Middle) md Anisotropy Decay (Bottom) of a Fluorophore
SCHEME 2
SCHEME 2
Coordinate System for a Fluorophore
SCHEME 3:
SCHEME 3:
Relationship between the Pulse Width, Intensity Decay, and Interval between Pulses

References

    1. Winnik MA,, Ed. Photophysical and Photochemical Tools in Polymer Science; D. Reidel Publishing Co.: Dordrecht, Holland, 1986.
    1. Warner IM, McGown LB, Eds. Advances in Multidimensional Luminescence; JAI Press, Inc.: Greenwich, CT, 1991; Vol. 1.
    1. Fleming GR Chemical Applications of Ultrafast Spectroscopy; Oxford University Press: New York, 1986.
    1. Dewey TG Biophysical and Biochemical Aspects of Fluorescence Spectroscopy; Plenum Press: New York, 1991.
    1. Lakowicz JR,Ed. Time-Resoled Laser Spectroscopy in Biochemistry III Proceedings of SPIE;SPIE Bellingham, WA, 1992: Vol. 1640.

LinkOut - more resources