

Comprehensive Analysis of Tumor-Infiltrating Immune Cells and Relevant Therapeutic Strategy in Esophageal Cancer
- PMID: 32454908
- PMCID: PMC7238334
- DOI: 10.1155/2020/8974793
Comprehensive Analysis of Tumor-Infiltrating Immune Cells and Relevant Therapeutic Strategy in Esophageal Cancer
Abstract
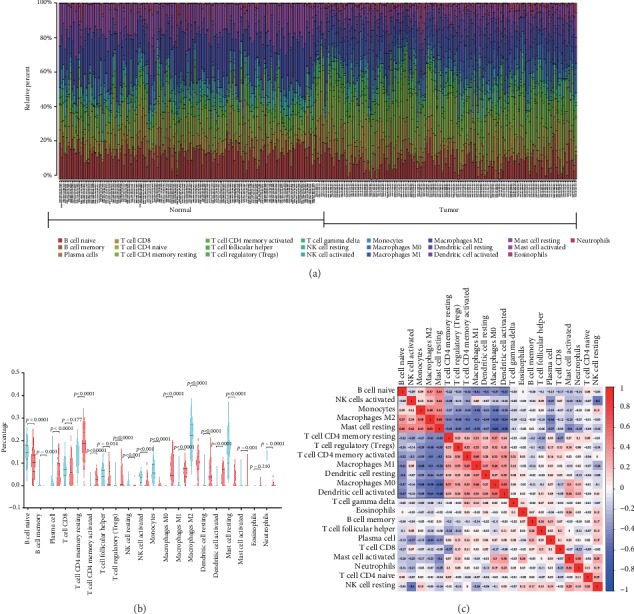
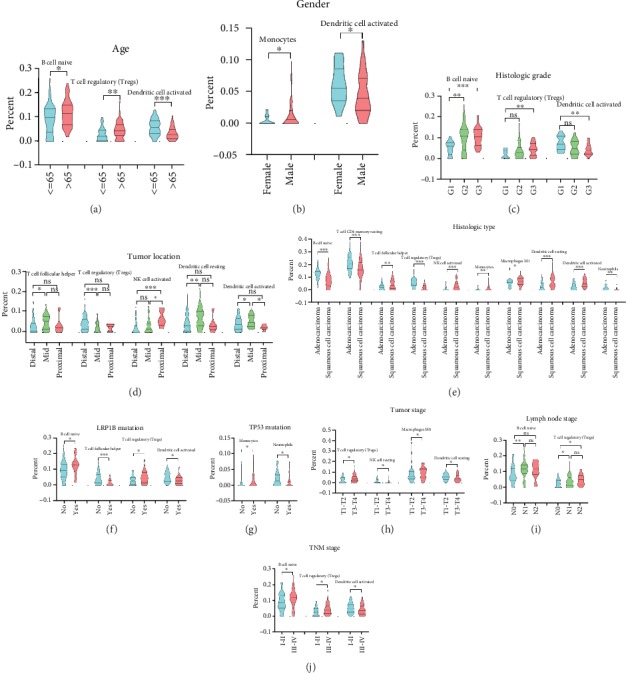
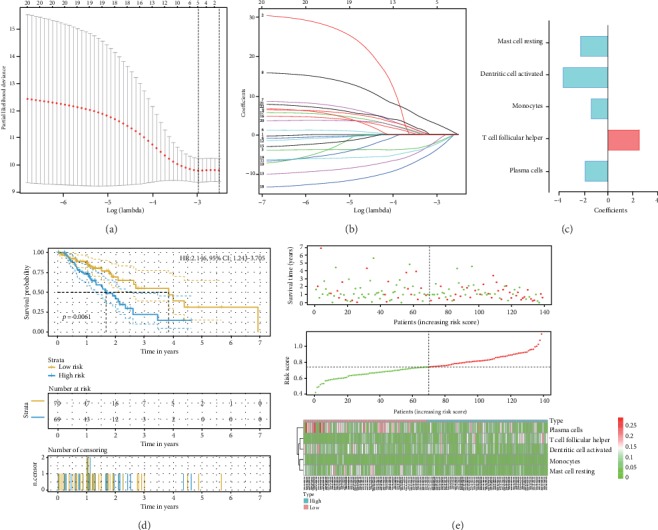
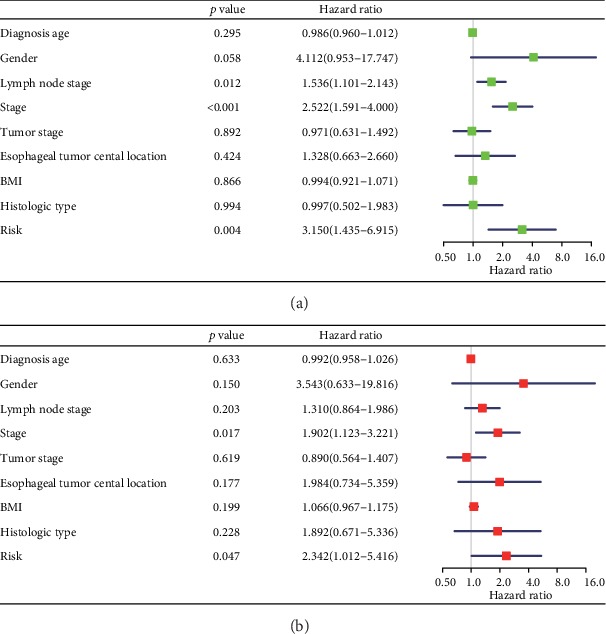
A growing body of evidence has indicated that behaviors of cancers are defined by not only intrinsic activities of tumor cells but also tumor-infiltrating immune cells (TIICs) in the tumor microenvironment. However, it still lacks a well-structured and comprehensive analysis of TIICs and its therapeutic value in esophageal cancer (EC). The proportions of 22 TIICs were evaluated between 150 normal tissues and 141 tumor tissues of EC by the CIBERSORT algorithm. Besides, correlation analyses between proportions of TIICs and clinicopathological characters, including age, gender, histologic grade, tumor location, histologic type, LRP1B mutation, TP53 mutation, tumor stage, lymph node stage, and TNM stage, were conducted. We constructed a risk score model to improve prognostic capacity with 5 TIICs by least absolute shrinkage and selection operator (lasso) regression analysis. The risk score = -1.86∗plasma + 2.56∗T cell follicular helper - 1.37∗monocytes - 3.64∗activated dendritic cells - 2.24∗resting mast cells (immune cells in the risk model mean the proportions of immune cell infiltration in EC). Patients in the high-risk group had significantly worse overall survival than these in the low-risk group (HR: 2.146, 95% CI: 1.243-3.705, p = 0.0061). Finally, we identified Semustine and Sirolimus as two candidate compounds for the treatment of EC based on CMap analysis. In conclusion, the proportions of TIICs may be important to the progression, prognosis, and treatment of EC.
Copyright © 2020 Guangrong Lu et al.
Conflict of interest statement
The authors declare that they have no competing interests.
Figures

Similar articles
-
Comprehensive analyses of the heterogeneity and prognostic significance of tumor-infiltrating immune cells in non-small-cell lung cancer: Development and validation of an individualized prognostic model.Int Immunopharmacol. 2020 Sep;86:106744. doi: 10.1016/j.intimp.2020.106744. Epub 2020 Jul 2. Int Immunopharmacol. 2020. PMID: 32623229
-
The establishment of immune infiltration based novel recurrence predicting nomogram in prostate cancer.Cancer Med. 2019 Sep;8(11):5202-5213. doi: 10.1002/cam4.2433. Epub 2019 Jul 29. Cancer Med. 2019. PMID: 31355524 Free PMC article.
-
A gene expression-based study on immune cell subtypes and glioma prognosis.BMC Cancer. 2019 Nov 15;19(1):1116. doi: 10.1186/s12885-019-6324-7. BMC Cancer. 2019. PMID: 31729963 Free PMC article.
-
Colorectal Cancer Immune Infiltrates: Significance in Patient Prognosis and Immunotherapeutic Efficacy.Front Immunol. 2020 May 28;11:1052. doi: 10.3389/fimmu.2020.01052. eCollection 2020. Front Immunol. 2020. PMID: 32547556 Free PMC article. Review.
-
Impact of immune cells on the hallmarks of cancer: A literature review.Crit Rev Oncol Hematol. 2021 Dec;168:103541. doi: 10.1016/j.critrevonc.2021.103541. Epub 2021 Nov 19. Crit Rev Oncol Hematol. 2021. PMID: 34801696 Review.
Cited by
-
Mining of prognosis-related genes in cervical squamous cell carcinoma immune microenvironment.PeerJ. 2020 Aug 24;8:e9627. doi: 10.7717/peerj.9627. eCollection 2020. PeerJ. 2020. PMID: 32904067 Free PMC article.
-
Analysis and prediction of immune cell infiltration characteristics in COPD: Folium isatidis and its active ingredients are able to combat lung lesions caused by COPD by correcting immune cell infiltration.Front Med (Lausanne). 2025 Apr 23;12:1584411. doi: 10.3389/fmed.2025.1584411. eCollection 2025. Front Med (Lausanne). 2025. PMID: 40337271 Free PMC article.
-
Tumor-Derived CCL5 Recruits Cancer-Associated Fibroblasts and Promotes Tumor Cell Proliferation in Esophageal Squamous Cell Carcinoma.Mol Cancer Res. 2023 Jul 5;21(7):741-752. doi: 10.1158/1541-7786.MCR-22-0872. Mol Cancer Res. 2023. PMID: 37027010 Free PMC article.
-
Characterizing the tumor RBP-ncRNA circuits by integrating transcriptomics, interactomics and clinical data.Comput Struct Biotechnol J. 2021 Sep 17;19:5235-5245. doi: 10.1016/j.csbj.2021.09.019. eCollection 2021. Comput Struct Biotechnol J. 2021. PMID: 34630941 Free PMC article.
-
Hypermethylation-Mediated lncRNA MAGI2-AS3 Downregulation Facilitates Malignant Progression of Laryngeal Squamous Cell Carcinoma via Interacting With SPT6.Cell Transplant. 2023 Jan-Dec;32:9636897231154574. doi: 10.1177/09636897231154574. Cell Transplant. 2023. PMID: 36852700 Free PMC article.
References
MeSH terms
Substances
LinkOut - more resources
Full Text Sources
Medical
Research Materials
Miscellaneous
