

Mechanistic Insights into Zika Virus NS3 Helicase Inhibition by Epigallocatechin-3-Gallate
- PMID: 32455246
- PMCID: PMC7241040
- DOI: 10.1021/acsomega.0c01353
Mechanistic Insights into Zika Virus NS3 Helicase Inhibition by Epigallocatechin-3-Gallate
Abstract
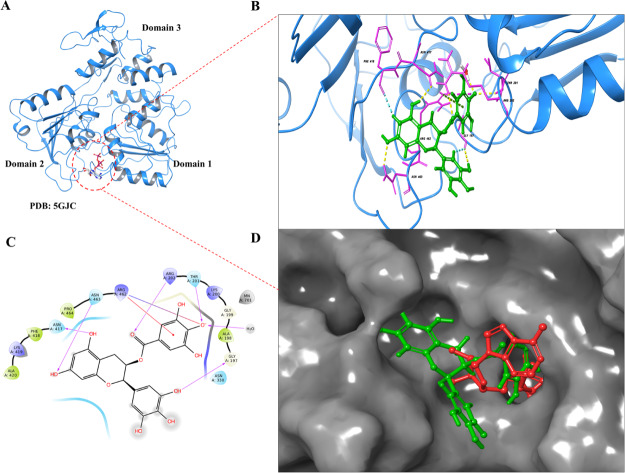
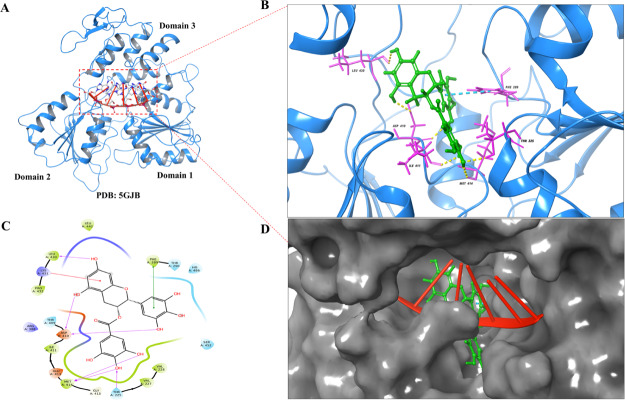
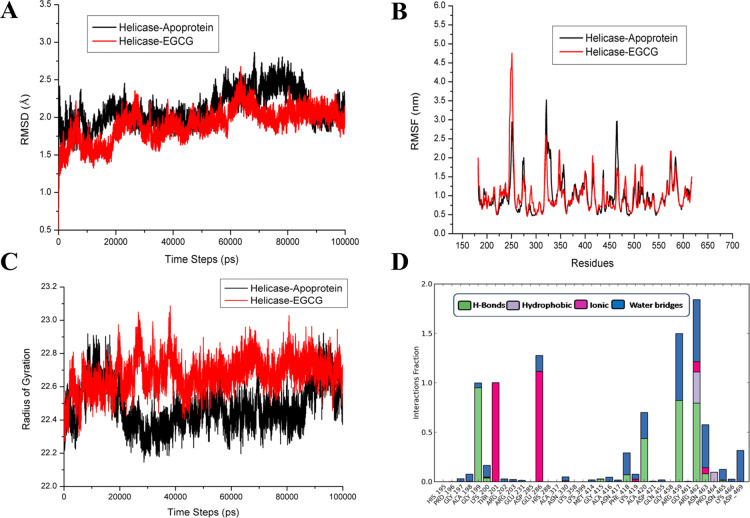
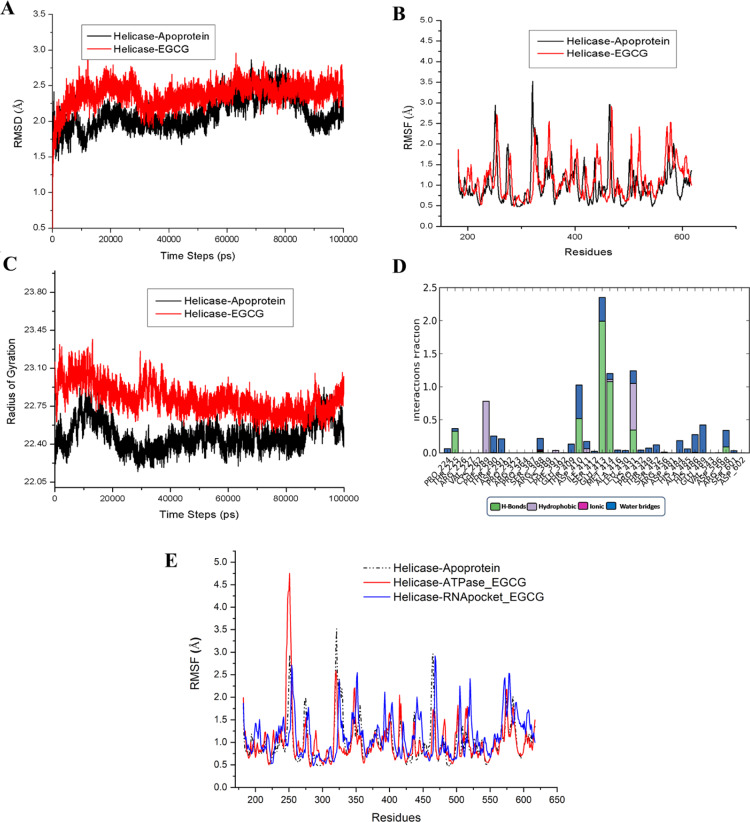
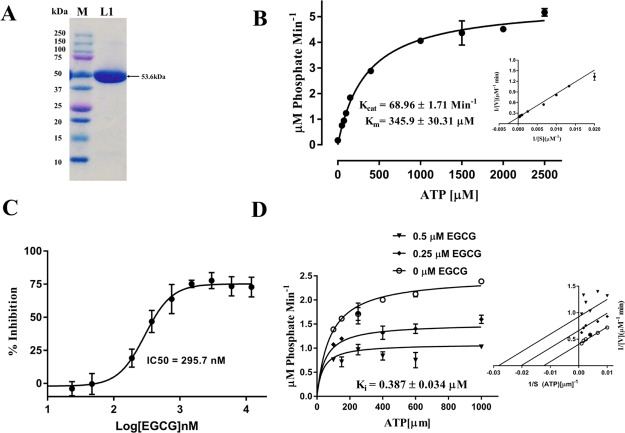
Since 2007, repeated outbreaks of Zika virus (ZIKV) have affected millions of people worldwide and created a global health concern with major complications like microcephaly and Guillain Barre's syndrome. To date, there is not a single Zika-specific licensed drug present in the market. However, in recent months, several antiviral molecules have been screened against ZIKV. Among those, (-)-epigallocatechin-3-gallate (EGCG), a green tea polyphenol, has shown great virucidal potential against flaviviruses including ZIKV. The mechanistic understanding of EGCG-targeting viral proteins is not yet entirely deciphered except that little is known about its interaction with viral envelope protein and viral protease. We designed our current study to find inhibitory actions of EGCG against ZIKV NS3 helicase. NS3 helicase performs a significant role in viral replication by unwinding RNA after hydrolyzing NTP. We employed molecular docking and simulation approach and found significant interactions at the ATPase site and also at the RNA binding site. Further, the enzymatic assay has shown significant inhibition of NTPase activity with an IC50 value of 295.7 nM and Ki of 0.387 ± 0.034 μM. Our study suggests the possibility that EGCG could be considered as a prime backbone molecule for further broad-spectrum inhibitor development against ZIKV and other flaviviruses.
Copyright © 2020 American Chemical Society.
Conflict of interest statement
The authors declare no competing financial interest.
Figures
Similar articles
-
The Importance of Epigallocatechin as a Scaffold for Drug Development against Flaviviruses.Pharmaceutics. 2023 Mar 1;15(3):803. doi: 10.3390/pharmaceutics15030803. Pharmaceutics. 2023. PMID: 36986663 Free PMC article.
-
Targeting the NTPase site of Zika virus NS3 helicase for inhibitor discovery.J Biomol Struct Dyn. 2020 Oct;38(16):4827-4837. doi: 10.1080/07391102.2019.1689851. Epub 2019 Nov 14. J Biomol Struct Dyn. 2020. PMID: 31690231
-
Epigallocatechin gallate, an active green tea compound inhibits the Zika virus entry into host cells via binding the envelope protein.Int J Biol Macromol. 2017 Nov;104(Pt A):1046-1054. doi: 10.1016/j.ijbiomac.2017.06.105. Epub 2017 Jun 28. Int J Biol Macromol. 2017. PMID: 28666829
-
Epigallocatechin Gallate: A Multifaceted Molecule for Neurological Disorders and Neurotropic Viral Infections.ACS Chem Neurosci. 2023 Sep 6;14(17):2968-2980. doi: 10.1021/acschemneuro.3c00368. Epub 2023 Aug 17. ACS Chem Neurosci. 2023. PMID: 37590965 Review.
-
Therapeutic Applications of Peptides against Zika Virus: A Review.Curr Med Chem. 2020;27(23):3906-3923. doi: 10.2174/0929867326666190111115132. Curr Med Chem. 2020. PMID: 30636575 Review.
Cited by
-
Antiviral Effects of Green Tea EGCG and Its Potential Application against COVID-19.Molecules. 2021 Jun 29;26(13):3962. doi: 10.3390/molecules26133962. Molecules. 2021. PMID: 34209485 Free PMC article. Review.
-
Antibacterial, Antifungal, Antiviral Activity, and Mechanisms of Action of Plant Polyphenols.Microorganisms. 2024 Dec 4;12(12):2502. doi: 10.3390/microorganisms12122502. Microorganisms. 2024. PMID: 39770706 Free PMC article. Review.
-
Flavonoids as Molecules With Anti-Zika virus Activity.Front Microbiol. 2021 Sep 10;12:710359. doi: 10.3389/fmicb.2021.710359. eCollection 2021. Front Microbiol. 2021. PMID: 34566915 Free PMC article. Review.
-
Reprofiling of approved drugs against SARS-CoV-2 main protease: an in-silico study.J Biomol Struct Dyn. 2022 Apr;40(7):3170-3184. doi: 10.1080/07391102.2020.1845976. Epub 2020 Nov 12. J Biomol Struct Dyn. 2022. PMID: 33179586 Free PMC article.
-
Identification of potential inhibitors of Zika virus targeting NS3 helicase using molecular dynamics simulations and DFT studies.Mol Divers. 2023 Aug;27(4):1689-1701. doi: 10.1007/s11030-022-10522-5. Epub 2022 Sep 5. Mol Divers. 2023. PMID: 36063275
References
-
- Stawicki S. P.; Sikka V.; Chattu V. K.; Popli R. K.; Galwankar S. C.; Kelkar D.; Sawicki S. G.; Papadimos T. J. The Emergence of Zika Virus as a Global Health Security Threat: A Review and a Consensus Statement of the INDUSEM Joint Working Group (JWG). J. Global Infect. Dis. 2016, 8, 3–15. 10.4103/0974-777X.176140. - DOI - PMC - PubMed
LinkOut - more resources
Full Text Sources
