. 2020 May 21;12(5):1297.
doi: 10.3390/cancers12051297.

Tspan8 Drives Melanoma Dermal Invasion by Promoting ProMMP-9 Activation and Basement Membrane Proteolysis in a Keratinocyte-Dependent Manner

Affiliations

Tspan8 Drives Melanoma Dermal Invasion by Promoting ProMMP-9 Activation and Basement Membrane Proteolysis in a Keratinocyte-Dependent Manner

Manale El Kharbili et al. Cancers (Basel). .

Abstract

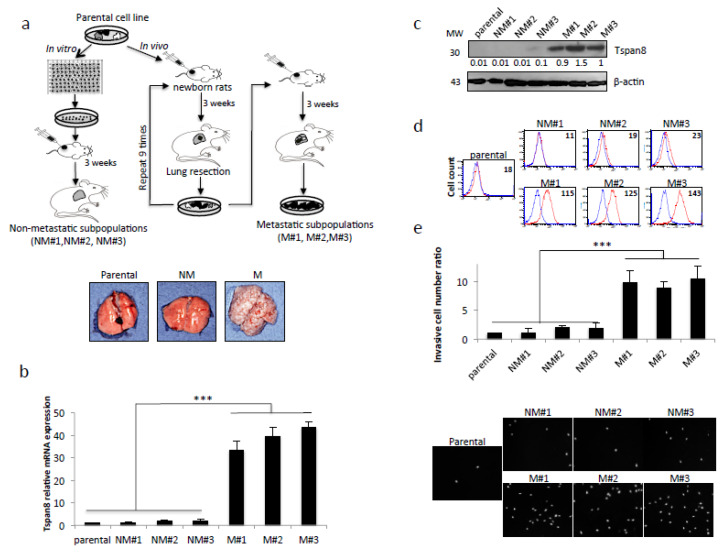
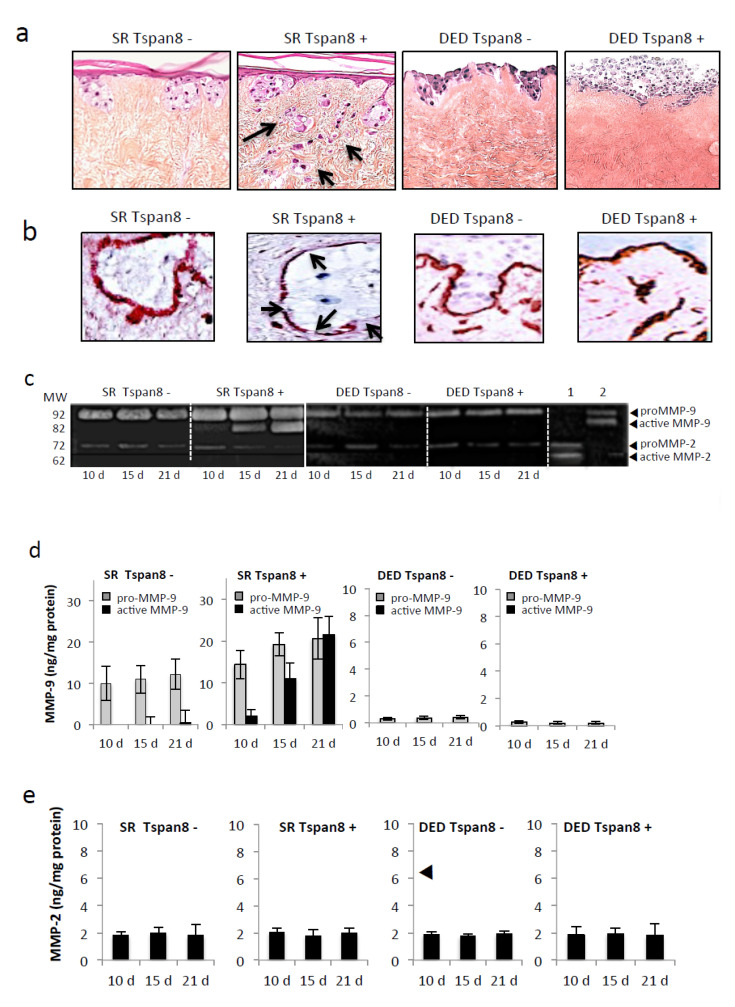
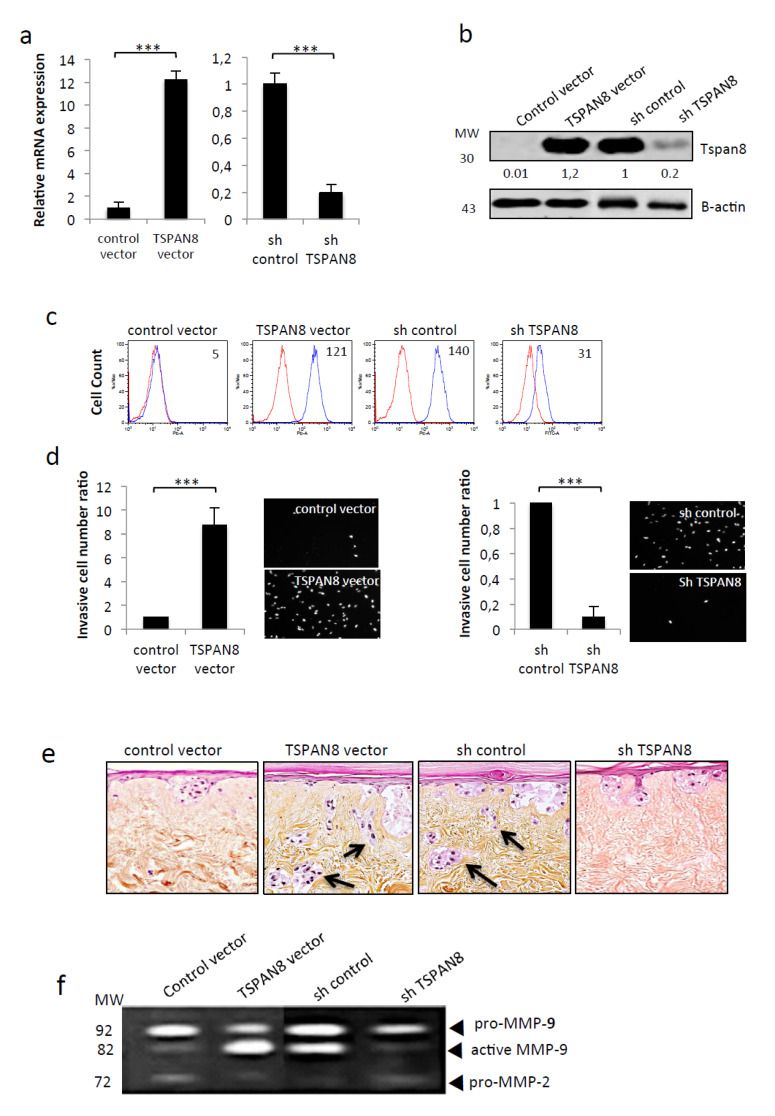
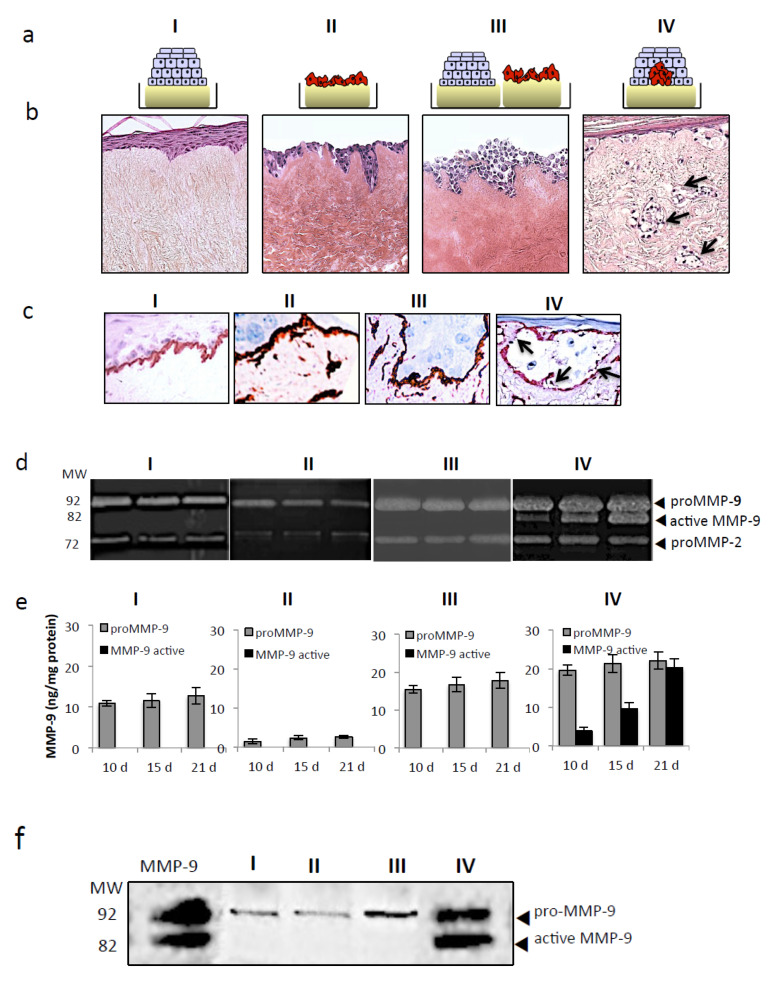
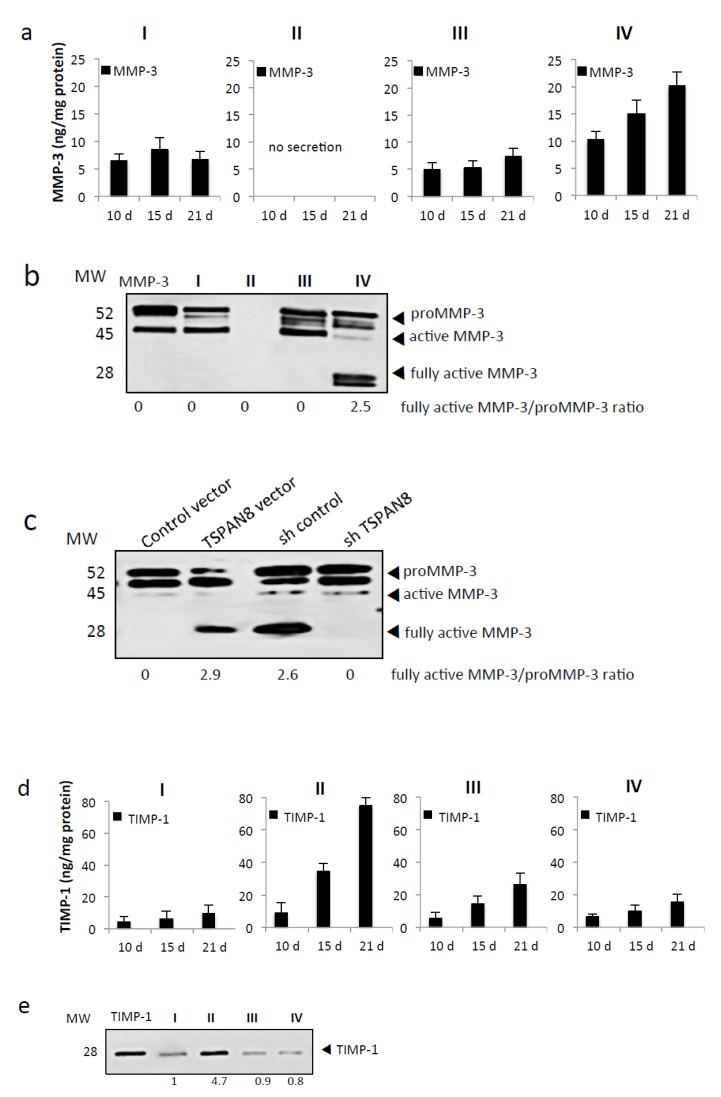
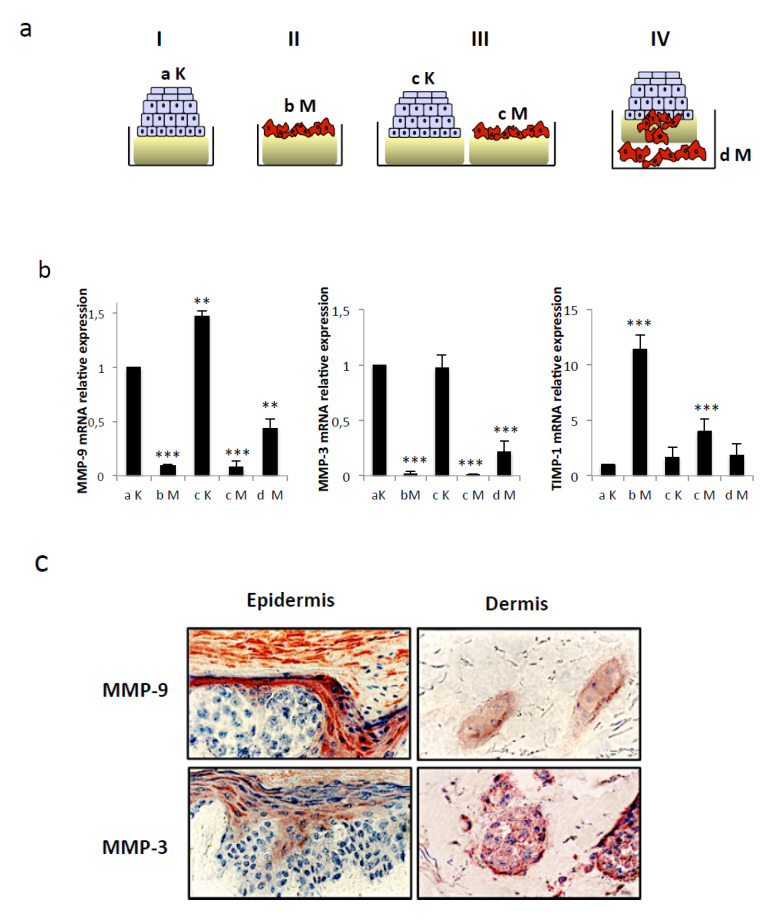
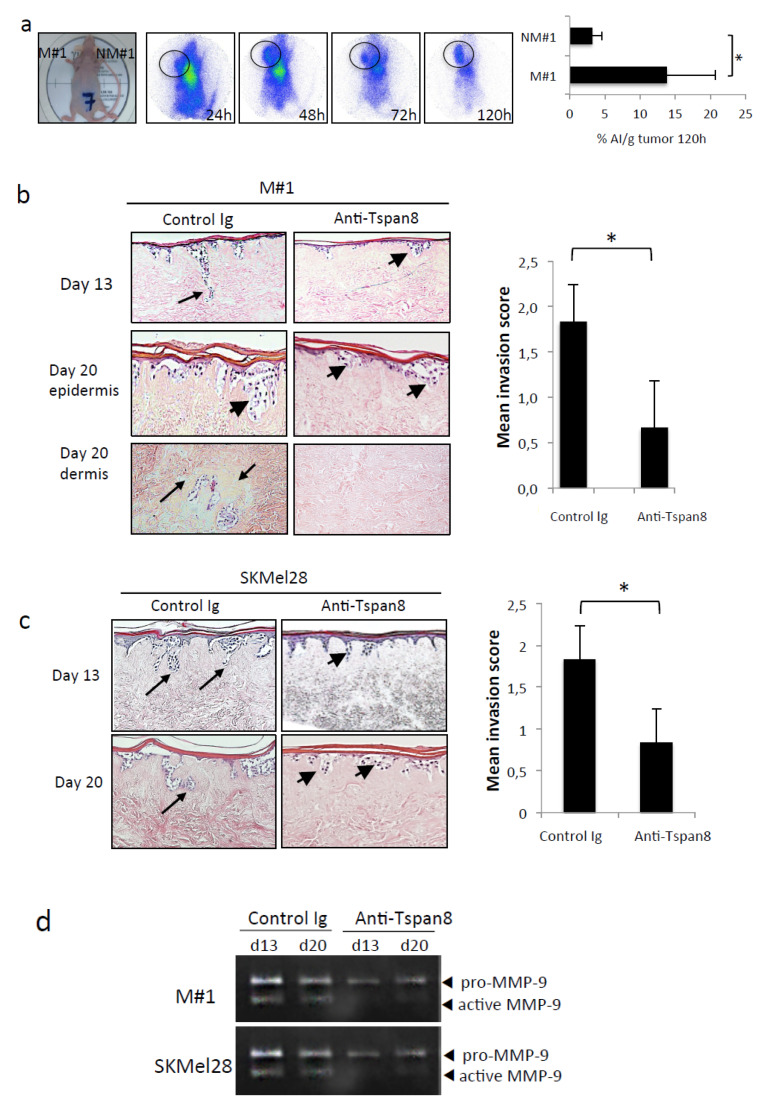
Melanoma is the most aggressive skin cancer with an extremely challenging therapy. The dermal-epidermal junction (DEJ) degradation and subsequent dermal invasion are the earliest steps of melanoma dissemination, but the mechanisms remain elusive. We previously identified Tspan8 as a key actor in melanoma invasiveness. Here, we investigated Tspan8 mechanisms of action during dermal invasion, using a validated skin-reconstruct-model that recapitulates melanoma dermal penetration through an authentic DEJ. We demonstrate that Tspan8 is sufficient to induce melanoma cells' translocation to the dermis. Mechanistically, Tspan8+ melanoma cells cooperate with surrounding keratinocytes within the epidermis to promote keratinocyte-originated proMMP-9 activation process, collagen IV degradation and dermal colonization. This concurs with elevated active MMP-3 and low TIMP-1 levels, known to promote MMP-9 activity. Finally, a specific Tspan8-antibody reduces proMMP-9 activation and dermal invasion. Overall, our results provide new insights into the role of keratinocytes in melanoma dermal colonization through a cooperative mechanism never reported before, and establish for the first time the pro-invasive role of a tetraspanin family member in a cell non-autonomous manner. This work also displays solid arguments for the use of Tspan8-blocking antibodies to impede early melanoma spreading and therefore metastasis.

Keywords: MMP-9; Tetraspanin 8; dermal-epidermal junction; dermis; melanoma invasion; melanoma-keratinocytes crosstalk; tumor microenvironment.


Conflict of interest statement

The authors declare no conflict of interest.

Figures

Figure 1
Figure 1
Generation of potent metastatic cell subpopulations expressing the metastatic-associated Tspan8 protein. (a) Schematic diagram of the experimental procedure used to sequentially select in an immunosuppressed new-born rat model cell subpopulations with progressively higher metastatic ability from a poorly metastatic melanoma cell line. Lower panel, representative photographs of the rat lungs. (b) The parental human M4Be cell line and its derived non metastatic (NM#1-3) and metastatic (M#1-3) subpopulations were examined for TSPAN8 mRNA levels by QPCR. Expression normalized to GAPDH represented a fold change of control sample (n = 3; ± SD); (c) Western blot analysis of Tspan8 expression with β-Actin as loading control and reference for quantification (one representative experiment of three), uncropped western blots figures in Figure S1; (d) Tspan8 cell surface expression by flow cytometry analysis. In red, the specific staining and in blue the isotype-matched control antibody (one representative experiment of three). Numbers indicate Mean Fluorescence Intensity (MFI). (e) Matrigel invasion assay using transwell chambers. The total number of invasive cells was integrally counted by scanning microscopy and normalized to the value from control parental cell line (n = 3; ± SEM). Representative visual fields are illustrated beneath. ***p < 0.001.
Figure 2
Figure 2
Tspan8-expressing melanoma cells efficiently invade the dermis in human skin reconstructs. Melanoma cells from NM#1 (Tspan8-) and M#1 (Tspan8+) subpopulations were cultured with human keratinocytes (SR) or alone (DED) on acellular dermis. (a) Representative photomicrographs of hematoxylin and eosin (H&E)-stained 21-day skin composites (scale bars: 100 μm). Arrows indicate melanoma cells colonizing the dermis (b) Representative IHC-staining of collagen IV. Arrows denote collagen IV layer disruptions. (c) MMP-9 and MMP-2 activity in gelatin zymography of culture medium from skin composites collected on day 10, 15 and 21. Lane 1, purified MMP-2 standard; lane 2, purified MMP-9 standard both activated with 4-aminophenylmercuric acetate. (d,e) ELISA quantification of secreted protein levels of proMMP-9, active MMP-9 (d) and MMP-2 (e) (ng/ug total protein) into the composite media. Bars represent the mean ± SD of three separate experiments with 3 ELISA evaluations for each of the 3 independent experiments (n = 9).
Figure 3
Figure 3
Tspan8 expression in melanoma triggers dermal invasion, concomitantly to MMP-9 activation and collagen IV proteolysis. Non-metastatic stable clones ectopically-expressing Tspan8 (TSPAN8 vector) or not (control vector) Tspan8 (left panel) and metastatic stable clones silenced (shTSPAN8) or not (shcontrol) for Tspan8 (right panel) were subjected to (a) QPCR analysis of TSPAN8 transcripts levels (n = 3; mean ± s.d.). (b) Western blot analysis of Tspan8 protein levels with β-Actin as loading control. The band intensities were normalized to actin signal (representative experiment of three), uncropped western blots figures in Figure S1 (c) Flow cytometry analysis of cell surface Tspan8 expression (representative experiment of three). (d) Matrigel cell invasion assay: invading cells were DAPI-stained (right panel) and quantified (left panel). Data are means ± SD with n = 3 (*** p < 0.001). (e) Cells were incorporated into the epidermis of skin reconstructs as described in Materials and Methods. Representative hematoxylin and eosin-stained skin reconstruct were shown. Arrows denote melanoma cells located into the dermis. (f) Serum-free conditioned media collected from SR were analyzed by gelatin zymography at 21 days (representative zymogram of 3 independent experiments). Molecular weight (MW) markers are indicated in kDa.
Figure 4
Figure 4
Tspan8-dependent dermal invasion coincides with MMP-9 activity and local dissolution of collagen IV and requires surrounding keratinocytes. (a) Schematic drawings of the four different culture conditions. I: SR containing no melanoma cells; II: Tspan8-expressing cells seeded alone on DED (DeEpidermised Dermis); III: SR without melanoma cells juxtaposed with Tspan8+ cells seeded alone on DED; IV: SR containing Tspan8+ cells in contact with keratinocytes. (b) Representative H&E staining of skin composites sections. Arrows indicate melanoma cells infiltrating the dermis. (c) type IV collagen staining on sections from the four culture conditions described in (a). Arrowhead pointed to collagen IV destruction. (df) Serum-free media from the four culture conditions collected at day 10, 15 and 21 were analyzed for the expression levels of proMMP-9 and active MMP-9 using gelatin zymography (d), ELISA (e) and western blot (f).
Figure 5
Figure 5
Tspan8-mediated melanoma cell invasion coincides with MMP-3 activation concomitantly with low TIMP-1. (a,b) The protein levels of total MMP-3 released in the supernatants from each culture model (I, II, II, IV described in Figure 4) were assessed at day 10, 15 and 21 by ELISA (a) and western blot (b), uncropped western blots figures in Figure S1. (c) Immunoblot analysis of MMP-3 in serum-free media harvested from SR integrating non-metastatic NM#1 melanoma cells ectopically expressing Tspan8 (TSPAN8 vector) and their control (control vector) or metastatic M#1 melanoma cells silenced (shTSPAN8) or not (shcontrol) for Tspan8. Equal amounts of total protein were loaded. The intensity value ratio of fully active MMP-3/proMMP-3 was annoted beneath the blot (d,e). Serum-free media from the 4 culture models collected at day 10, 15 and 21 were analyzed for TIMP-1 content by ELISA (d) and western blot (e). ELISA results are represented as the mean ± SEM from three independent experiments, each measured in duplicate.
Figure 6
Figure 6
Keratinocytes are the main source of MMP-3 and MMP-9 in the epidermis but melanoma cells gain the ability to express both proteins after DEJ crossing. (a) Total RNA has been isolated from keratinocytes and Tspan8+ melanoma cells at day 20 from the four different schematized culture conditions. aK: keratinocytes from culture I; bM: Tspan8+ melanoma cells from culture II; cK and cM: keratinocytes and Tspan8+ melanoma cells from culture III respectively; dM: invading melanoma cells from culture IV. (b) QPCR analysis of MMP-9, MMP-3, and TIMP-1 transcript expression levels of aK, bM, cK, cM and dM (n =3; ± SD). (c) Representative pictures of immunohistochemical staining of MMP-9 and MMP-3 in the epidermis and dermis of SR integrating Tspan8+ melanoma cells (condition IV) at day 20. ** p < 0.01, *** p < 0.001.
Figure 7
Figure 7
Anti-Tspan8 mAb efficiently targets Tspan8-positive melanoma cells in vivo and reduces MMP-9 activation and dermal invasion. (a) Mice with Tspan8+ (left side) and Tspan8- xenografts (right side) were injected (i.v.) with 3.7 MBq of [111In] DOTA-mAb and imaged with a γ-camera at 24 h, 48 h, 72 h and 120 h post-injection. Whole body SPECT/CT images of mice demonstrate specific accumulation of [111In] DOTA-mAb in Tspan8+ tumors (surrounded) but significantly lower in Tspan8- tumors. Tumors were collected 120 h after injection and the radioactivity was measured by γ-counting of each sample. The graph represents the % of injected activity per gram of tissue (%IA/g, n = 4). (b) Representative H&E staining of SR with metastatic M#1 cells treated with control IgG or 0.5 µM Ts29 at 13 and 20 days. The graph depicts the invasion scores (see Materials and Methods). (c) Representative H&E staining of SR with SKMel28 cells treated with control IgG or 15 µg/mL Ts29 at 15 and 21 days. Arrow heads: melanoma cell clusters close to DEJ; arrows, melanoma cells invading the dermis (Scale bars: 10 μm). Data representative of 6 independent experiments. Graph depicts results of invasion score analysis. (d) Serum-free conditioned media collected from SR integrating M#1 and SKMel-28 cells were analyzed by gelatin zymography at 21 days (representative zymogram of 3 independent experiments). * p < 0.05.

References

    1. Arozarena I., Wellbrock C. Phenotype plasticity as enabler of melanoma progression and therapy resistance. Nat. Rev. Cancer. 2019;19:377–391. doi: 10.1038/s41568-019-0154-4. - DOI - PubMed
    1. Shain A.H., Bastian B.C. From melanocytes to melanomas. Nat. Rev. Cancer. 2016;16:345–358. doi: 10.1038/nrc.2016.37. - DOI - PubMed
    1. Gershenwald J.E., Scolyer R.A., Hess K.R., Sondak V.K., Long G.V., Ross M.I., Lazar A.J., Faries M.B., Kirkwood J.M., McArthur G.A., et al. Melanoma staging: Evidence-based changes in the American Joint Committee on Cancer eighth edition cancer staging manual. CA Cancer J. Clin. 2017;67:472–492. doi: 10.3322/caac.21409. - DOI - PMC - PubMed
    1. Roncati L., Piscioli F. AJCC 8th Edition (2017) versus AJCC 7th Edition (2010) in thin melanoma staging. Neoplasma. 2018;65:651–655. doi: 10.4149/neo_2018_170701N452. - DOI - PubMed
    1. Werner-Klein M., Scheitler S., Hoffmann M., Hodak I., Dietz K., Lehnert P., Veronika N., Bernhard P., Steffi T., Christian W., et al. Genetic alterations driving metastatic colony formation are acquired outside of the primary tumour in melanoma. Nat. Commun. 2018;9:595–599. doi: 10.1038/s41467-017-02674-y. - DOI - PMC - PubMed