. 2020 May 21;12(5):1299.
doi: 10.3390/cancers12051299.

HuRdling Senescence: HuR Breaks BRAF-Induced Senescence in Melanocytes and Supports Melanoma Growth

Affiliations

HuRdling Senescence: HuR Breaks BRAF-Induced Senescence in Melanocytes and Supports Melanoma Growth

Janika K Liebig et al. Cancers (Basel). .

Abstract

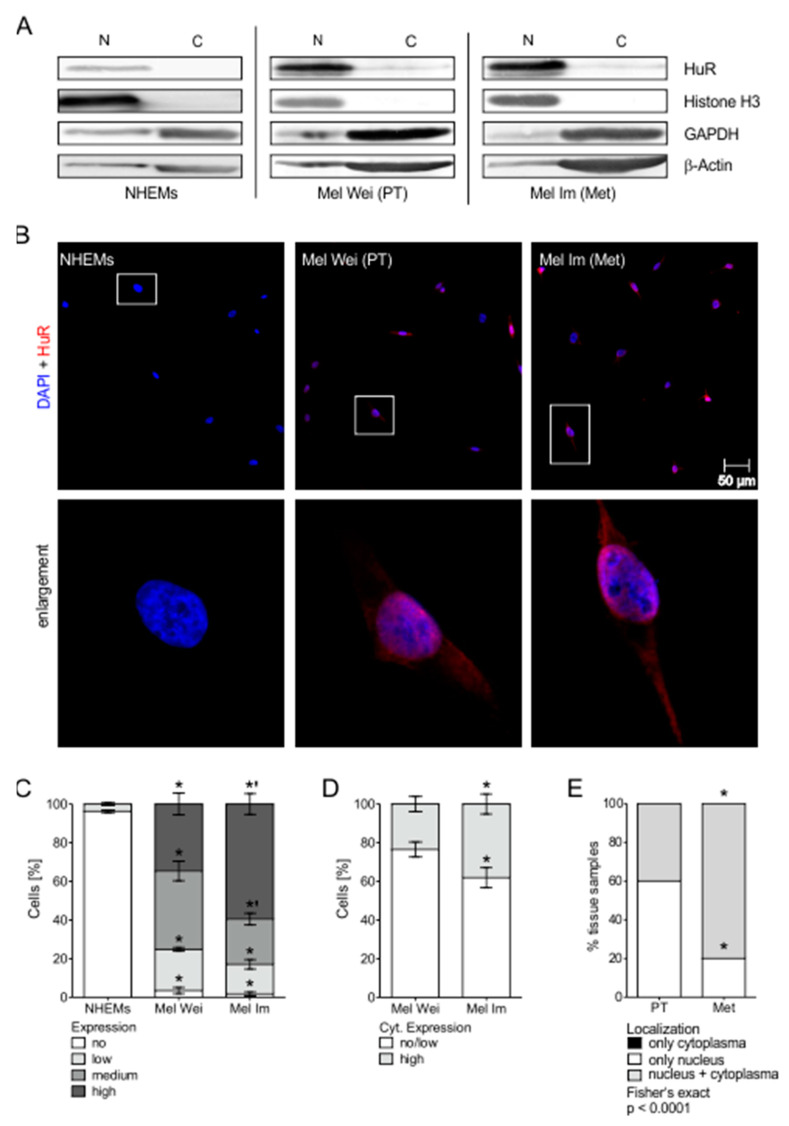
In addition to genetic changes, post-transcriptional events strongly contribute to the progression of malignant tumors. The RNA-binding protein HuR (ELAVL1) is able to bind and stabilize a large group of target mRNAs, which contain AU-rich elements (ARE) in their 3'-untranslated region. We found HuR to be upregulated in malignant melanoma in vitro and in vivo, significantly correlating with progression in vivo. Additionally, we could show that miR-194-5p can regulate HuR expression level. HuR knockdown in melanoma cells led to the suppression of proliferation and the induction of cellular senescence. Interestingly, HuR overexpression was sufficient to inhibit senescence in BRAFV600E-expressing melanocytes and to force their growth. Here, MITF (Microphthalmia-associated transcription factor), a key player in suppressing senescence and an ARE containing transcript, is positively regulated by HuR. Our results show for the first time that the overexpression of HuR is an important part of the regulatory pathway in the development of malignant melanoma and functions as a switch to overcome oncogene-induced senescence and to support melanoma formation. These newly defined alterations may provide possibilities for innovative therapeutic approaches.

Keywords: HuR; MITF; Microphthalmia-associated transcription factor; malignant melanoma; oncogene induced senescence.


Conflict of interest statement

The authors declare no conflict of interest.

Figures

Figure 1
Figure 1
HuR (ELAVL1) expression in malignant melanoma in vivo and in vitro. (A) Mean expression of mRNAs in primary melanoma cells related to expression in NHEM cells. No = mRNAs without ARE binding sequence (n = 9993); iARE = mRNAs with ≥1 intronic ARE sequence (n = 5560); ARE = mRNAs with ≥ 1 ARE sequence in the 3′UTR (n = 2095). (B) Relative expression of HuR mRNA in NHEMs and melanoma cell lines, mRNA level in NHEMs is set 1. (C) Correlation of HuR expression, and the mean expression of 150 randomly chosen ARE containing mRNAs in 10 different melanoma cell lines. (D) Densitometric quantification (left) and exemplary image (right) of Western blot analysis of HuR protein levels in primary and metastatic melanoma cell lines compared to NHEMs. HuR protein level in NHEMs is set 1. (E) Relative expression of HuR mRNA in normal skin (n = 7) and melanoma tissue (n = 45) of patients. HuR mRNA level in normal skin is set 1. (F) Representative immunohistochemical staining of HuR protein in primary human melanoma and metastatic melanoma tissue samples (4 shown, n = 10; for quantification see Figure 3). (G) Survival analysis in a skin cutaneous melanoma (SKCM) patient dataset comparing low and high HuR (ELAVL1) levels (lower percentile: 80, higher percentile: 20). *A p-value of <0.05 was considered statistically significant. The uncropped blots and molecular weight markers of Figure 1D are shown in Figure S5.
Figure 2
Figure 2
Regulation of HuR (ELAVL1) expression by miR-194-5p. (A) MiR-194-5p binding site in the 3′UTR of ELAVL1 mRNA. (B) MiR-194-5p expression levels in primary and metastatic melanoma cell lines compared to NHEMs. (C) Luciferase HuR 3′UTR-reporter activity in siCtrl and miR-194-5p-mimic transfected melanoma cells. Activity in siCtrl transfected cells is set 1. (D) Densitometric quantification (right) and exemplary image (left) of Western blot analysis of HuR protein levels in siCtrl and miR-194-5p-mimic transfected melanoma cells. HuR protein level in siCtrl transfected cells is set 1. *A p-value of <0.05 was considered statistically significant. The uncropped blots and molecular weight markers of Figure 2D are shown in Figure S6.
Figure 3
Figure 3
Changes of HuR expression and localization in the progression of MM in vitro. (A) Fractionation of cell lysates of NHEM, Mel Wei, and Mel Im cells in nucleus and cytoplasm fraction and subsequent Western blot analysis of HuR protein. Histone H3 served as a nucleus control, GAPDH and β-actin as cytoplasm controls. Representative pictures shown. (B) Representative immunofluorescence pictures of NHEM, Mel Wei, and Mel Im cells stained with DAPI (blue) and HuR (red). (C) Percentage of no, low, medium, or high HuR level in IF-staining in NHEM, Mel Wei, and Mel Im cells. Significant comparisons with NHEMs were marked with *, significant comparisons between Mel Wei and Mel Im with ‘. (D) Percentage of only nuclear/low cytoplasmic and high cytoplasmic HuR level in IF-staining in Mel Wei and Mel Im cells. (E) Percentage of only nuclear/nuclear and cytoplasmic HuR localization in IH-staining of primary tumor and metastasis melanoma tissue samples (see Figure 1F). *A p-value of <0.05 was considered statistically significant. The uncropped blots and molecular weight markers of Figure 3A are shown in Figure S7.
Figure 4
Figure 4
Influence of HuR knockdown on the proliferative capacity of melanoma cells in vitro. (A) Exemplary real-time cell proliferation curves of Mel Wei and Mel Im cells (left panel) and quantified ‘slope’ (proliferative ability, siCtrl = 1) (right panel). (B) Exemplary images of anchorage-dependent clonogenic assays of Mel Wei and Mel Im cells (left panel) and quantification of colony number and size (right panel) in these cells (siCtrl = 1). (C) FACS-based cell cycle analysis of Mel Wei and Mel Im cells. Depicted are representative overlays of cell cycle histograms (left panel) and percentages of G1 cell cycle fractions (right panel) in these cells (siCtrl = 1). (D) Luciferase AP-1-reporter activity in siCtrl and siHuR transfected melanoma cells (siCtrl = 1). (E) Densitometric quantification (right) and exemplary image (left) of Western blot analysis of Cyclin D1 protein levels in transfected Mel Wei and Mel Im cells (siCtrl = 1). *A p-value of <0.05 was considered statistically significant. The uncropped blots and molecular weight markers of Figure 4E are shown in Figure S8.
Figure 5
Figure 5
Influence of a HuR knockdown on senescence characteristics in melanoma cells. (A) Exemplary images of light microscopic examination of SA-β-galactosidase staining in Mel Wei and Mel Im cells (left). The percentages of SA-β-galactosidase positive cells (blue) were calculated (right) (siCtrl = 1). (B) Exemplary images of PML immunofluorescence staining of Mel Wei and Mel Im cell lines. Panels show overlays of PML (red) and DAPI (blue) staining (left). The graph shows the nuclear accumulation of PML (right) (siCtrl = 1). (C) Densitometric quantification (right) and exemplary image (left) of Western blot analysis of MITF protein levels in transfected Mel Wei and Mel Im cells (siCtrl = 1). *A p-value of <0.05 was considered statistically significant. The uncropped blots and molecular weight markers of Figure 5C are shown in Figure S9.
Figure 6
Figure 6
HuR overexpression leads to a reduction of senescence characteristics in NHEM BrafV600E cells. (A) Exemplary images of light microscopic examination of SA-β-galactosidase staining in NHEM Mock, NHEM BrafV600E, and NHEM BrafV600E/HuR OE cells (left). The percentages of SA-β-galactosidase positive cells (blue) were calculated (right) (Mock = 1). (B) Exemplary images of PML immunofluorescence staining of NHEM Mock, NHEM BrafV600E, and NHEM BrafV600E/HuR OE cells (red) and DAPI (blue) staining. CopGFP served as a transduction control (green) (left). The graph shows the nuclear accumulation of PML (Mock = 1) (right). For better recognition, colors are only shown in the overlay, not in single pictures. (C Exemplary images of Ki-67 immunofluorescence staining of NHEM Mock, NHEM BrafV600E, and NHEM BrafV600E/HuR OE cells (red) and DAPI (blue) staining. CopGFP served as a transduction control (green) (top). The graph shows the accumulation of Ki-67 (Mock = 1) (bottom left). For better recognition, colors are only shown in the overlay, not in single pictures. *A p-value of <0.05 was considered statistically significant.
Figure 7
Figure 7
HuR overexpression leads to MITFhigh phenotype NHEM BrafV600E cells. (A) Relative expression of HuR mRNA in NHEM Mock and NHEM BrafV600E cells (Mock = 1). (B) Densitometric quantification (left) and exemplary image (right) of Western blot analysis of HuR protein levels in NHEM Mock and NHEM BrafV600E cells (Mock = 1). (C) Relative expression of HuR mRNA in matched Nevi and melanoma tissue samples (Nevi = 1). Data derived from the GSE112509 data set. (D) Exemplary image of Western blot analysis of MITF protein in NHEM Mock, NHEM BrafV600E, and NHEM BrafV600E/HuR OE cells (left). Densitometric quantification of MITF protein in NHEM Mock, NHEM BrafV600E, and NHEM BrafV600E/HuR OE cells (Mock = 1) (right) (B&D represent the same Western blot, which was duplicated for presentation purposes, * marks lanes already presented in B). (E) Schematic summary of the main results (schematic illustrations abstracted and modified from https://smart.servier.com/, for licensing, please refer to the material and method part of this work). *A p-value of <0.05 was considered statistically significant. The uncropped blots and molecular weight markers of Figure 7D are shown in Figure S10.

References

    1. Siegel R.L., Miller K.D., Jemal A. Cancer statistics. CA Cancer J. Clin. 2019;69:7–34. doi: 10.3322/caac.21551. - DOI - PubMed
    1. Alexandrov L.B., Nik-Zainal S., Wedge D.C., Aparicio S.A., Behjati S., Biankin A.V., Bignell G.R., Bolli N., Borg A., Borresen-Dale A.L., et al. Signatures of mutational processes in human cancer. Nature. 2013;500:415–421. doi: 10.1038/nature12477. - DOI - PMC - PubMed
    1. Bernatchez C., Cooper Z.A., Wargo J.A., Hwu P., Lizee G. Novel Treatments in Development for Melanoma. Cancer Treat. Res. 2016;167:371–416. - PubMed
    1. Davies H., Bignell G.R., Cox C., Stephens P., Edkins S., Clegg S., Teague J., Woffendin H., Garnett M.J., Bottomley W., et al. Mutations of the BRAF gene in human cancer. Nature. 2002;417:949–954. doi: 10.1038/nature00766. - DOI - PubMed
    1. Long G.V., Menzies A.M., Nagrial A.M., Haydu L.E., Hamilton A.L., Mann G.J., Hughes T.M., Thompson J.F., Scolyer R.A., Kefford R.F. Prognostic and clinicopathologic associations of oncogenic BRAF in metastatic melanoma. J. Clin. Oncol. 2011;29:1239–1246. doi: 10.1200/JCO.2010.32.4327. - DOI - PubMed