. 2020 May 21;12(5):1307.
doi: 10.3390/cancers12051307.

Single-Cell Transcriptomic Analysis of Tumor-Derived Fibroblasts and Normal Tissue-Resident Fibroblasts Reveals Fibroblast Heterogeneity in Breast Cancer

Affiliations

Single-Cell Transcriptomic Analysis of Tumor-Derived Fibroblasts and Normal Tissue-Resident Fibroblasts Reveals Fibroblast Heterogeneity in Breast Cancer

Aimy Sebastian et al. Cancers (Basel). .

Abstract

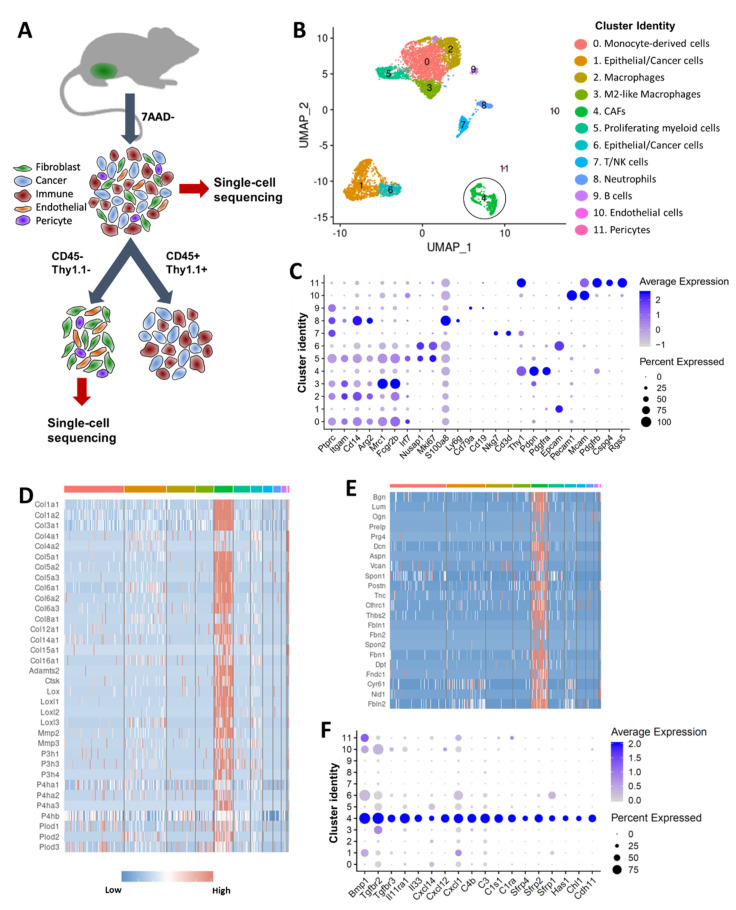
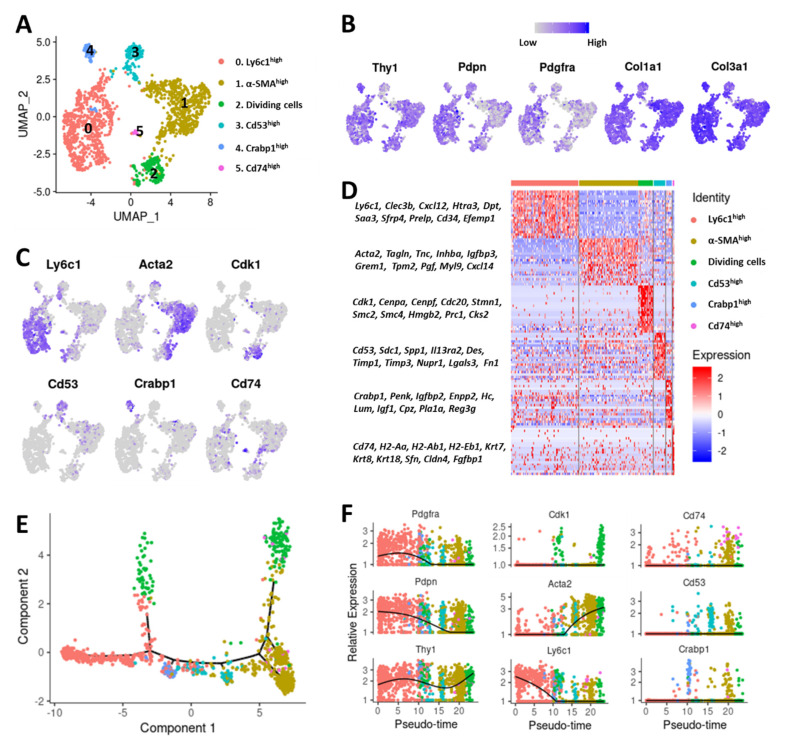
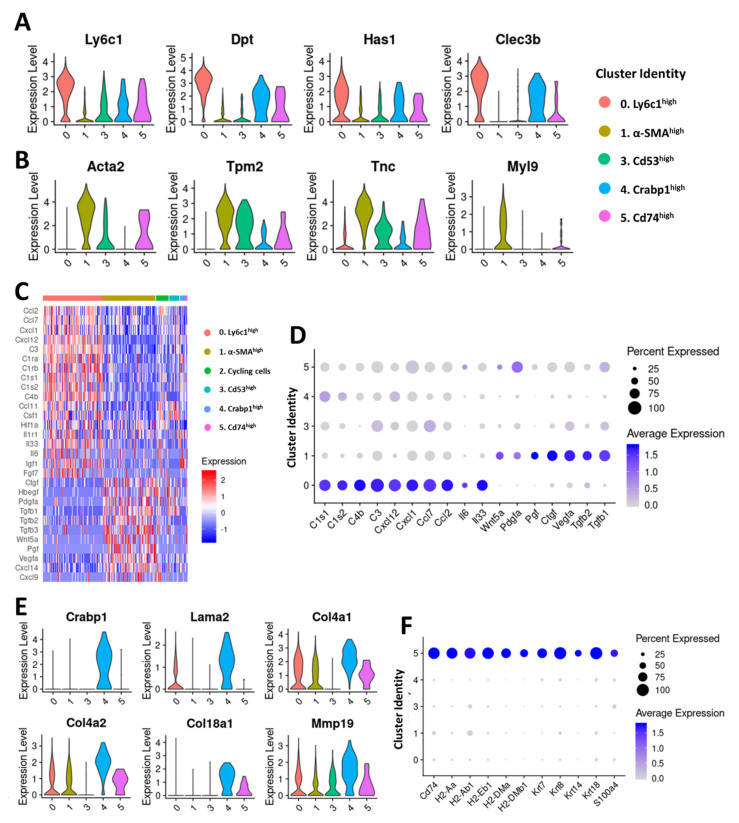
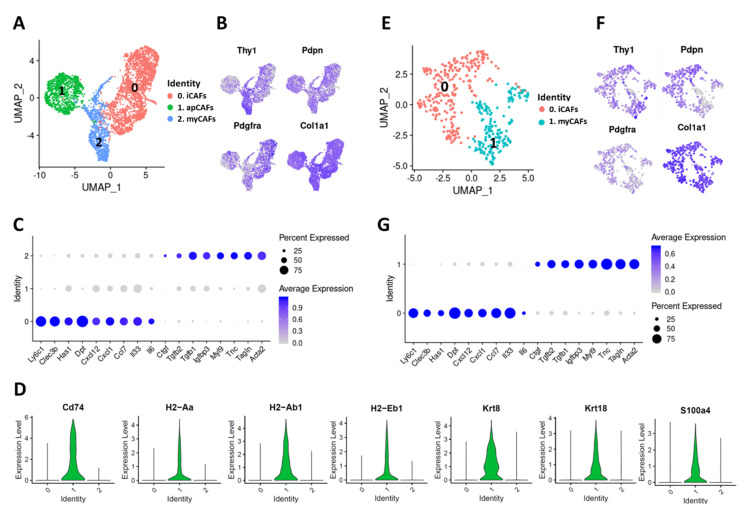
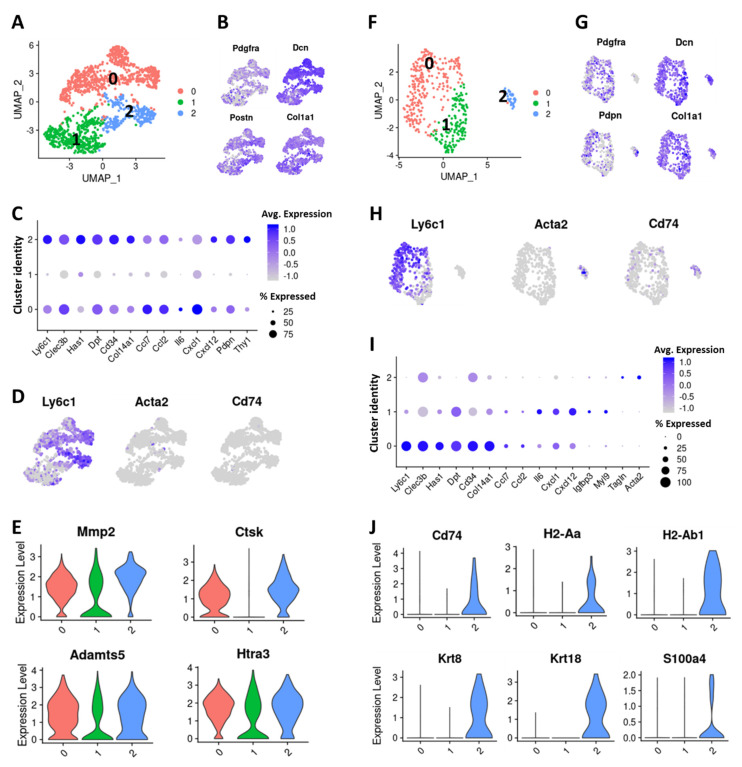
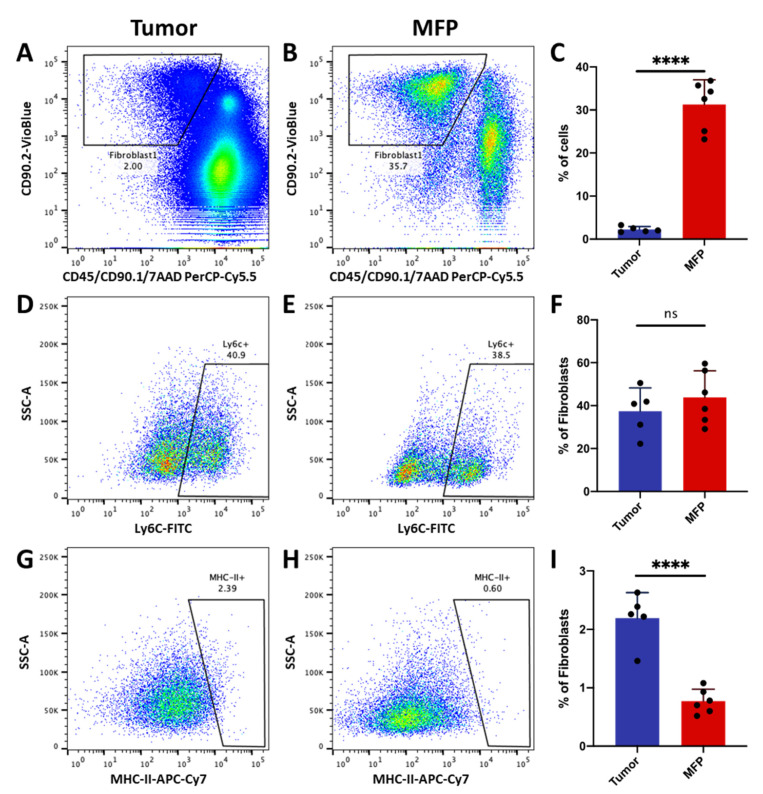
Cancer-associated fibroblasts (CAFs) are a prominent stromal cell type in solid tumors and molecules secreted by CAFs play an important role in tumor progression and metastasis. CAFs coexist as heterogeneous populations with potentially different biological functions. Although CAFs are a major component of the breast cancer stroma, molecular and phenotypic heterogeneity of CAFs in breast cancer is poorly understood. In this study, we investigated CAF heterogeneity in triple-negative breast cancer (TNBC) using a syngeneic mouse model, BALB/c-derived 4T1 mammary tumors. Using single-cell RNA sequencing (scRNA-seq), we identified six CAF subpopulations in 4T1 tumors including: 1) myofibroblastic CAFs, enriched for α-smooth muscle actin and several other contractile proteins; 2) 'inflammatory' CAFs with elevated expression of inflammatory cytokines; and 3) a CAF subpopulation expressing major histocompatibility complex (MHC) class II proteins that are generally expressed in antigen-presenting cells. Comparison of 4T1-derived CAFs to CAFs from pancreatic cancer revealed that these three CAF subpopulations exist in both tumor types. Interestingly, cells with inflammatory and MHC class II-expressing CAF profiles were also detected in normal breast/pancreas tissue, suggesting that these phenotypes are not tumor microenvironment-induced. This work enhances our understanding of CAF heterogeneity, and specifically targeting these CAF subpopulations could be an effective therapeutic approach for treating highly aggressive TNBCs.

Keywords: CAF heterogeneity; breast cancer; cancer-associated fibroblasts; gene expression profiling; inflammatory fibroblasts; mammary fat pad; myofibroblasts; normal fibroblasts; pancreatic cancer; scRNA-seq.


Conflict of interest statement

The authors declare no conflict of interest. The funders had no role in the design of the study; in the collection, analyses, or interpretation of data; in the writing of the manuscript, or in the decision to publish the results.

Figures

Figure 1
Figure 1
Single cell analysis of 4T1 mouse mammary tumors. (A) Graphical representation of the experimental workflow. 4T1 syngeneic tumors were dissociated into single cells, and two cell fractions were generated: (1) a viable cell fraction (7AAD−) and (2) immune-depleted stromal cell fraction (obtained by depleting CD45+ immune cells and Thy1.1+ cancer cells). Cells from both fractions were subjected to single cell sequencing using the 10x Genomics Chromium platform. (B) Cell clusters from 10x Genomics scRNA-seq analysis visualized by Uniform Manifold Approximation and Projection (UMAP). Colors indicate clusters of various cell types (CAFs in black circle). (C) Dot plot showing the expression of selected markers of various cell types. Dot size represents the fraction of cells expressing a specific marker in a particular cluster and intensity of color indicates the average expression level in that cluster. (D) Heatmap showing high levels of collagens and collagen-processing enzymes in CAFs. (E) Heatmap showing high levels of key proteoglycans and glycoproteins in CAFs. (F) Dot plot showing the expression of a subset of genes enriched in CAFs. Dot size represents the fraction of cells expressing a specific marker in a particular cluster and intensity of color indicates the average expression in that cluster.
Figure 2
Figure 2
Characterization of CAF subtypes in 4T1 breast cancer. (A) Cell clusters from 10x Genomics scRNA-seq analysis visualized by UMAP. Colors indicate various CAF subtypes. (B) Feature plots showing the expression of commonly used CAF markers in various CAF subtypes. Legend shows a color gradient of normalized expression. (C) Markers of various CAF subtypes that were used to denote each subtype. (D) Heatmap showing a subset of genes differentially expressed between the 6 CAF subtypes. (E) Monocle pseudospace trajectory colored based on CAF clusters in (A). (F) Expression of CAF markers on a pseudotime scale (colored based on CAF clusters in (A)).
Figure 3
Figure 3
Characterization of CAF clusters in 4T1 mammary tumors. Violin plots showing the expression of Ly6c1high (A) and α-SMAhigh (B) cluster markers in all clusters except the dividing/cycling cells. (C) Heatmap depicting the expression profiles of growth factors and immune/inflammatory signaling mediators differentially expressed between CAF subpopulations. (D) Dot plots showing the expression of selected immune/inflammatory signaling molecules enriched in Ly6c1high CAFs and growth factors enriched in α-SMAhigh CAFs. Dot size represents the fraction of cells expressing a specific marker in a particular cluster and intensity of color indicates the average expression in that cluster. (E) Violin plots showing the expression of selected markers enriched in Crabp1high CAFs. (F) Dot plots showing the expression of selected markers of Cd74high CAFs. Dot size represents the fraction of cells expressing a specific marker in a particular cluster and intensity of color indicates the average expression in that cluster.
Figure 4
Figure 4
Characterization of CAF subtypes in murine PDAC. (A) UMAP plot showing various CAF subtypes identified in PDAC tumors from KPC mice. (B) Expression of commonly used CAF markers in KPC-derived PDAC CAFs. (C) Dot plot showing the expression of selected markers of Ly6c1high CAFs (iCAFs) and α-SMAhigh CAFs (myCAFs) in KPC-derived PDAC CAFs. Dot size represents the fraction of cells expressing a specific marker in a particular cluster and intensity of color indicates the average expression in that cluster. (D) Violin plots showing the expression of Cd74high CAF (apCAFs) markers in KPC-derived CAFs (cluster identities on X-axis). (E) CAF subtypes identified in subcutaneous mT3 tumors. (F) Expression of commonly used CAF markers in mT3 tumor-derived CAFs. (G) Dot plot showing the expression of selected iCAF and myCAF markers in mT3-derived CAFs.
Figure 5
Figure 5
Characterization of normal tissue-resident fibroblasts. (A) UMAP plot showing various fibroblast subtypes identified in normal mammary fat pad. (B) Expression of commonly used fibroblast/CAF markers in mammary fat pad-derived fibroblast subtypes (C) Dot plot showing the expression of selected iCAF markers in mammary fat pad-derived fibroblast subtypes. Dot size represents the fraction of cells expressing a specific marker in a particular cluster and intensity of color indicates the average expression in that cluster. (D) Feature plot showing the expression of Ly6c1, Acta2 and Cd74 in mammary fat pad-derived fibroblasts. (E) Violin plot showing the expression of matrix degrading enzymes in mammary fat pad-derived fibroblast subtypes (cluster identity on X-axis). (F) UMAP plot showing various fibroblast subtypes identified in normal pancreas. (G) Expression of commonly used fibroblast/CAF markers in normal pancreas-derived fibroblasts. (H) Feature plot showing the expression of Ly6c1, Acta2 and Cd74 in pancreas-derived fibroblasts. (I) Dot plot showing the expression of selected iCAF markers in pancreas-derived fibroblast subtypes Dot size represents the fraction of cells expressing a specific marker in a particular cluster and intensity of color indicates the average expression in that cluster. (J) Violin plots showing the expression of Cd74high CAF (apCAFs) markers in pancreas-derived fibroblasts subtypes.
Figure 6
Figure 6
Inflammatory fibroblasts and MHC class II-expressing fibroblasts in mammary tumors and naïve mammary fat pad. Flow cytometry plots identifying viable (7AAD−) CD90.2+/CD90.1−/CD45− fibroblasts derived from (A) tumor or (B) naïve mammary fat pad (MFP). (C) Bar graph of Thy1+ fibroblast abundance in tumor and MFP. Flow cytometry plots identifying Ly6c1high subpopulations from all Thy1+ fibroblasts in the tumor (D) and (E) MFP. (F) Bar graph of Ly6c1high subpopulations abundance in the tumor and MFP. Flow cytometry plots identifying MHC class II-expressing subpopulations from all Thy1+ fibroblasts in the tumor (G) and (H) MFP. (I) Bar graph showing the abundance of MHC class II -expressing subpopulation in the tumor and MFP. n = 5–6 performed in two independent experiments. Errors bars denote SD. **** p < 0.0001, not significant (ns) p > 0.005.

References

    1. Zhang W., Huang P. Cancer-stromal interactions: Role in cell survival, metabolism and drug sensitivity. Cancer Biol. Ther. 2011;11:150–156. doi: 10.4161/cbt.11.2.14623. - DOI - PMC - PubMed
    1. Werb Z., Lu P. The Role of Stroma in Tumor Development. Cancer J. 2015;21:250–253. doi: 10.1097/PPO.0000000000000127. - DOI - PMC - PubMed
    1. Musa M. Single-cell analysis on stromal fibroblasts in the microenvironment of solid tumours. Adv. Med. Sci. 2020;65:163–169. doi: 10.1016/j.advms.2019.12.001. - DOI - PubMed
    1. Gandellini P., Andriani F., Merlino G., D’Aiuto F., Roz L., Callari M. Complexity in the tumour microenvironment: Cancer associated fibroblast gene expression patterns identify both common and unique features of tumour-stroma crosstalk across cancer types. Semin. Cancer Biol. 2015;35:96–106. doi: 10.1016/j.semcancer.2015.08.008. - DOI - PubMed
    1. Shiga K., Hara M., Nagasaki T., Sato T., Takahashi H., Takeyama H. Cancer-Associated Fibroblasts: Their Characteristics and Their Roles in Tumor Growth. Cancers. 2015;7:2443–2458. doi: 10.3390/cancers7040902. - DOI - PMC - PubMed