. 2020 May 21;21(10):3651.
doi: 10.3390/ijms21103651.

ASC-Exosomes Ameliorate the Disease Progression in SOD1(G93A) Murine Model Underlining Their Potential Therapeutic Use in Human ALS

Affiliations

ASC-Exosomes Ameliorate the Disease Progression in SOD1(G93A) Murine Model Underlining Their Potential Therapeutic Use in Human ALS

Roberta Bonafede et al. Int J Mol Sci. .

Abstract

Amyotrophic lateral sclerosis (ALS) is a fatal neurodegenerative disease characterized by progressive degeneration of motoneurons. To date, there is no effective treatment available. Exosomes are extracellular vesicles that play important roles in intercellular communication, recapitulating the effect of origin cells. In this study, we tested the potential neuroprotective effect of exosomes isolated from adipose-derived stem cells (ASC-exosomes) on the in vivo model most widely used to study ALS, the human SOD1 gene with a G93A mutation (SOD1(G93A)) mouse. Moreover, we compared the effect of two different routes of exosomes administration, intravenous and intranasal. The effect of exosomes administration on disease progression was monitored by motor tests and analysis of lumbar motoneurons and glial cells, neuromuscular junction, and muscle. Our results demonstrated that repeated administration of ASC-exosomes improved the motor performance; protected lumbar motoneurons, the neuromuscular junction, and muscle; and decreased the glial cells activation in treated SOD1(G93A) mice. Moreover, exosomes have the ability to home to lesioned ALS regions of the animal brain. These data contribute by providing additional knowledge for the promising use of ASC-exosomes as a therapy in human ALS.

Keywords: MRI; amyotrophic lateral sclerosis; extracellular vesicles; homing; motoneurons; neuromuscular junction; stem cells.


Conflict of interest statement

The authors declare no conflict of interest.

Figures
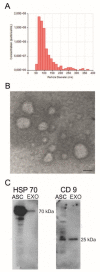
Figure 1
Figure 1
Characterization of exosomes isolated from adipose-derived stem cells (ASC-exosomes). (A) Histogram of the concentration and the particle diameter of ASC-exosomes; (B) Electron microscopy shows vesicles with characteristic morphology and size of exosomes. Scale bar, 100 nm; (C) The blots show Western blot detection of the expression of HSP70 (70 kDa) and CD9 (25 kDa) in ASC-exosomes (EXO). Adipose-derived stem cell (ASC) lysates (ASC) were used as a positive control.
Figure 2
Figure 2
Motor performances and survival of human SOD1 gene with a G93A mutation (SOD1(G93A)) mice treated intravenously (A, B) and intranasally (C, D). (A, C) The graphs show the motor performances of SOD1(G93A) mice treated with PBS (black line) or with ASC-exosomes (EXO, grey line). The paw grip endurance (PaGE) test shows a global improvement of motor performance of the EXO-treated mice as compared with the PBS group, with significant differences at 11, 14, and 15 weeks (* p = 0.0494, * p = 0.0308 and * p = 0.0102, respectively) with i.v. treatment (A) and significant differences at 14 and 15 weeks (* p = 0.0219 and * p = 0.0431, respectively) with i.n. treatment (C). Data are reported as mean ± SEM. (B, D) The graphs show the survival rate of SOD1(G93A) mice treated with PBS (black line) or with ASC-exosomes (EXO, grey line). Graphs show the percentages of occurrence of the events.
Figure 3
Figure 3
Effect of i.v. ASC-exosomes treatment on motoneurons (MN) survival in SOD1(G93A) mice. (A) The graph shows the significant progressive loss of MN during the disease progression (as compared with untreated mice at week 7 and PBS-treated mice at the end stage of the disease, ** p = 0.0026). The i.v. treatment with ASC-exosomes (EXO) significantly increases the MN survival in the lumbar section (L1–L5) of the spinal cord as compared with the PBS-treated group (** p = 0.0078). Data are shown as mean ± SEM; (B) Representative Nissl staining of the lumbar spinal cord MN of PBS- and ASC-exosomes (EXO) treated mice. Note that a higher MN number in the mice that receive exosomes treatment as compared with the PBS group. Magnification 20×, scale bar 50 µm.
Figure 4
Figure 4
Effect of i.n. ASC-exosomes treatment on MN survival in SOD1(G93A) mice. (A) The graph shows the significant progressive loss of MN during the disease progression. At the end stage of the disease (19 weeks of life), the i.n. treatment with ASC-exosomes (EXO) significantly increases the MN survival in the lumbar section (L1–L5) of the spinal cord as compared with the PBS-treated group (* p = 0.034). Data are reported as mean ± SEM (untreated versus PBS 19 weeks *** p = 0.001; untreated versus EXO 19 weeks * p = 0.049; PBS 15 weeks versus PBS 19 weeks * p = 0.049); (B) The graph shows the percentage of MN during the disease progression. Note, the ability of ASC-exosomes to protect MN from death. Data are reported as the percentage of surviving MN (* p = 0.034); (C) Representative Nissl staining of the lumbar spinal cord MN of the PBS and ASC-exosomes (EXO) treated mice. Note, a higher MN number in mice that receive exosomes treatment as compared with the PBS group. Magnification 20×, scale bar 50 µm.
Figure 5
Figure 5
Effect of i.n. administration of ASC-exosomes on skeletal muscle of SOD1(G93A) mice. (A) Representative images of the correct architecture of the neuromuscular junction (NMJ), in which a colocalization of presynaptic NF-H (green) and αBTx (red) is showed (left). On the right is reported the degeneration of the NMJ, in which non colocalization between NF-H (green) and αBTx (red) is reported, due to presynaptic loss of neurofilament that leave to denervation. Magnification 40×, scale bar 25 µm; (B) The graph shows a significant decrease in colocalization of NF-H and αBTx in SOD1(G93A) mice at 15 weeks of life as compared with the wild-type (WT) mice (**** p < 0.0001 comparing WT mice with both PBS- or exosomes-treated SOD1(G93A) mice). Note that ASC-exosomes treated mice (EXO) showed a significant increase in NMJ with presynaptic terminals colocalized with αBTx as compared with the PBS group (*** p = 0.0006). Data are shown as mean ± SEM; (C) Representative images of hematoxylin-eosin (HE) staining in the WT mice and the SOD1(G93A) mice treated with PBS or ASC-exosomes (EXO) at 15 weeks of life. Note, the reduced degeneration of the skeletal muscle in ASC-exosomes treated mice. Magnification 20×, scale bar 50 µm; (D) The graph shows the quantitative analysis of the average fiber area in the groups of mice. A significant decrease in fiber area in the PBS-treated SOD1(G93A) mice at 15 weeks of life was detected as compared with the WT mice (** p = 0.0034). Note that ASC-exosomes treated mice (EXO) showed a significant increase in fiber area as compared with the PBS group (* p = 0.0410). Data are shown as mean ± SEM.
Figure 6
Figure 6
Effect of i.v. and i.n. ASC-exosomes treatment on astrocytosis in SOD1(G93A) mice. (A) The graph shows the number of GFAP+ cells in the lumbar section (L1–L5) of the spinal cord, comparing untreated with i.v. treated SOD1(G93A) mice. Note, the progressive increase of astrocytosis during the disease progression, and a trend in ASC-exosomes (EXO) treatment to decrease astrocyte activation (* p = 0.05); (B) The graph shows the number of GFAP+ cells in the lumbar section (L1–L5) of the spinal cord, comparing untreated with i.n. treated SOD1(G93A) mice sacrificed at 15 and 19 weeks of life. At the end stage of the disease, note, a significant difference in decreasing astrocyte activation in ASC-exosomes treated mice (EXO) as compared with the PBS group (* p = 0.03 ** p = 0.006); (C) Representative staining of the lumbar spinal cord of the PBS and ASC-exosomes (EXO) treated mice. Note, a lower number of GFAP+ cells in the ASC-exosomes treated mice as compared with the PBS-treated mice. Magnification 20×, scale bar 50 µm.
Figure 7
Figure 7
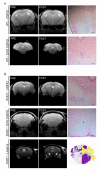
In vivo MR images and PB staining of the WT and SOD1(G93A) mice brain. (A) Representative in vivo MR images acquired prior (left) and 3 h post (center) i.n. administration of ultra-small superparamagnetic iron oxide nanoparticles (USPIO) nanoparticles (first line) or exosomes labeled with USPIO (EXO USPIO, second line). On the right, the PB histological examination of the brain shows blue spots in the same area revealed by MRI, confirming the presence of USPIO nanoparticles (magnification 20×, scale bar 50 µm). Both USPIO and exosomes-USPIO are randomly distributed in the brain; (B) In the first and second lines, representative MR images acquired pre (left) and 3 h post (center) i.n. administration of USPIO nanoparticles or exosomes labeled with USPIO (EXO USPIO). On the right, the PB histological examination of the brain shows blue spots in the same area revealed by MRI, confirming the presence of USPIO nanoparticles (magnification 20×, scale bar 50 µm). Note that, while USPIO nanoparticles are randomly distributed in the animal brain (USPIO were detected in different areas in different mice and the images reported in the first line is a representative one), exosomes-USPIO selectively reached the lesioned ALS area in all the mice analyzed (compared the second line with the third line). In the third line, representative T2w MR images performed to identify typical lesioned area of the SOD1(G93A) mice (arrows). The analysis revealed a signal intensity enhancement compared with surrounding tissue, indicating the cell degeneration during the progression of the disease. The region of the coronal mouse brain map corresponding to the MRI image is reported on the right.

References

    1. Brown R.H., Al-Chalabi A. Amyotrophic Lateral Sclerosis. N. Engl. J. Med. 2017;377:162–172. doi: 10.1056/NEJMra1603471. - DOI - PubMed
    1. Costa J., de Carvalho M. Emerging molecular biomarker targets for amyotrophic lateral sclerosis. Clin. Chim. Acta. 2016;455:7–14. doi: 10.1016/j.cca.2016.01.011. - DOI - PubMed
    1. Bonafede R., Mariotti R. ALS Pathogenesis and Therapeutic Approaches: The Role of Mesenchymal Stem Cells and Extracellular Vesicles. Front. Cell. Neurosci. 2017;11:157. doi: 10.3389/fncel.2017.00080. - DOI - PMC - PubMed
    1. Vinsant S., Mansfield C., Jimenez-Moreno R., Moore V.D.G., Yoshikawa M., Hampton T.G., Prevette D., Caress J., Oppenheim R.W., E Milligan C. Characterization of early pathogenesis in the SOD1G93A mouse model of ALS: Part I, background and methods. Brain Behav. 2013;3:335–350. doi: 10.1002/brb3.143. - DOI - PMC - PubMed
    1. Benatar M. Lost in translation: Treatment trials in the SOD1 mouse and in human ALS. Neurobiol. Dis. 2007;26:1–13. doi: 10.1016/j.nbd.2006.12.015. - DOI - PubMed

Substances