. 2020 May 21;9(5):1564.
doi: 10.3390/jcm9051564.

The COVID-19 Infection in Italy: A Statistical Study of an Abnormally Severe Disease

Affiliations

The COVID-19 Infection in Italy: A Statistical Study of an Abnormally Severe Disease

Giuseppe De Natale et al. J Clin Med. .

Abstract

We statistically investigate the Coronavirus Disease 19 (COVID-19) pandemic, which became particularly invasive in Italy in March 2020. We show that the high apparent lethality or case fatality ratio (CFR) observed in Italy, as compared with other countries, is likely biased by a strong underestimation of the number of infection cases. To give a more realistic estimate of the lethality of COVID-19, we use the actual (March 2020) estimates of the infection fatality ratio (IFR) of the pandemic based on the minimum observed CFR and analyze data obtained from the Diamond Princess cruise ship, a good representation of a "laboratory" case-study from an isolated system in which all the people have been tested. From such analyses, we derive more realistic estimates of the real extent of the infection as well as more accurate indicators of how fast the infection propagates. We then isolate the dominant factors causing the abnormal severity of the disease in Italy. Finally, we use the death count-the only data estimated to be reliable enough-to predict the total number of people infected and the interval of time when the infection in Italy could end.

Keywords: COVID-19; epidemic in Italy; statistical forecast.


Conflict of interest statement

The authors declare no conflict of interest.

Figures
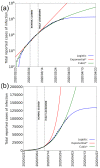
Figure 1
Figure 1
Total COVID-19 cases reported in Italy from 24 February to 30 March 2020 according to Protezione Civile (black dots) with logistic (blue solid line), exponential (red solid line), and cubic (green solid line) infection rates. Dotted black vertical lines mark the dates of Italian school lockdown and the nationwide total lockdown; the asterisk indicates that the exponential and the cubic fits are based on data until 12 March: score from Akaike Information Criterion (AIC) test (not reported) on logistic, cubic, and exponential fits shows higher reliability of the first two after this date and for the logistic against the cubic after 25 March 2020. (a) Fits obtained from the data in semi-logarithmic scale; (b) same data and fits shown in linear scale. Fit parameters: Logistic (y=K1+mexr1+nexr;K=(135±2)·103, m=1.4±0.2, n=170±9, r=0.174±0.003); Exponential (y=AeBx;A=410±30, B=0.2±0.01;Cubic=a+bx+cx2+dx3;a=40±20, b=36±8, c=6.7±0.9, d=0.44±0.03).
Figure 2
Figure 2
Total COVID-19 cases reported in China from 22 January to 31 March 2020 according to the Johns Hopkins University data repository. Circles, squares, and triangles represent total COVID-19 cases registered in China, the region of Hubei, and China without Hubei; red, black, and blue dashed lines are the associated logistic fits. Shaded areas represent the family of curves obtainable by making the fit parameters vary within their confidence intervals. Fit parameters: Logistic (y=K1+mexr1+nexr;China:K =(811±3)·102, m=0.9±0.6, n=53±9, r=0.214±0.008); Hubei: K=(678±3)·102, m=0.4±1.2, n=100±20, r=0.232±0.01; China wihtout Hubei: K=(131.6±0.3)·103, m=1.4±0.11, n=14±1.4,r=0.208±0.006).
Figure 3
Figure 3
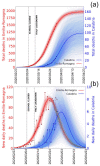
Deaths reported by Italian Civil Protection. (a) Total deaths reported in Italy (green dots), Lombardia (blue dots), and Italy without Lombardia (red dots) from 24 February to 30 March 2020 and the corresponding logistic fit in solid lines. Dotted vertical lines mark the dates of Italian school lockdown and Italy total lockdown. A sample best fitting Richards’ curve for the whole Italy is also shown (green dotted line). (b) Same as in (a) using the new daily reported deaths and fitting the derivate of the logistic and Richards’ curve. Shaded areas represent the family of curves obtainable by making the fit parameters vary within their confidence intervals. Fit parameters: Logistic (y=K1+mexr1+nexr;Logistic: Kr(mn)exr(erx+n)2;Italy: K=(178±4)·102, m=3.1±0.5,n=380±30, r=0.183±0.004); Lombardia: K=(100±4)·102, m=2.8±0.5, n=270±30,r=0.176±0.006); Italy without Lombardia: K=(74±2)·102, m=4.0±0.8, n=740±60,r=0.201±0.004; Richards(y=K(1+eB(xt))1ν;y:BKe(tx)(e(tx)+1)(ν+1)νν;Italy: K=(276±5)·102,  B=0.1±0.5,t=20±30, ν=0.196±0.004).
Figure 4
Figure 4
Deaths reported by Italian Civil Protection for Emilia-Romagna and Calabria regions. (a) Total, cumulative deaths reported in Emilia-Romagna (red dots) and in Calabria (blue dots) from 24 February to 30 March 2020 according to Italian Civil Protection and the corresponding logistic fit obtained from the data. Dotted vertical lines mark the dates of Italian school lockdown and Italy total lockdown. (b) Same as in (a) using the new daily reported deaths and fitting the derivate of the logistic curve. Shaded areas represent the family of curves obtainable by making the fit parameters vary within their confidence intervals. Note: the left and the right y-axes scales refer to the Emilia-Romagna and the Calabria curves, respectively. Fit parameters: Logistic (y=K1+mexr1+nexr;Logistic: Kr(mn)exr(erx+n)2;;EmiliaRomagna: K=1970±40, m=3.0±0.6,n=360±30, r=0.197±0.004);  Calabria: K=100±20, m=30±13, n=(12±3)·103,r=0.208±0.006).
Figure 5
Figure 5
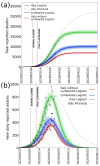
Estimated (total and undetected) COVID-19 cases in Italy based on three different infection fatality ratio (IFR) hypotheses: 0.2% (blue and light blue lines), 1.3% (red and pink lines), and 5.7% (green and light green lines). Blue and sky-blue solid lines represent logistic fits of total and undetected estimated cases with IFR = 0.2%, respectively. Red and pink solid lines represent logistic fits of total and undetected estimated cases with IFR = 1.3%, respectively. Green and light green solid lines represent logistic fits of total and undetected estimated cases with IFR = 5.7%, respectively. Black dotted vertical lines mark the dates of Codogno area lockdown, Italian schools’ lockdown, Lombardia lockdown, and Italy lockdown. Dark orange dashed vertical line marks the inflection points of the three curves representing the total infected estimates; magenta dotted vertical line marks the 95% of the plateau of the three curves. Shaded areas represent the family of curves obtainable by making the fit parameters vary within their confidence intervals. Best fit parameters are listed in Table 2.

References

    1. WHOa (World Health Organization) Rolling Updates on Coronavirus Disease (COVID-19) WHO; Geneve, Switzerland: 2020.
    1. Oke J., Heneghan C. Global COVID-19 Case Fatality Rates. Nuffield Department of Primary Care Health Sciences; Oxford, UK: 2020. [(accessed on 4 April 2020)]. Available online: https://www.cebm.net/global-COVID-19-case-fatality-rates/
    1. Van Rossum G., Drake F.L., Jr. Python Reference Manual. Centrum voor Wiskunde en Informatica; Amsterdam, The Netherlands: 1995.
    1. Akaike H. New look at Statistical-Model identification. IEE Trans. on Autom. Contr. 1974;19:716–723. doi: 10.1109/TAC.1974.1100705. - DOI
    1. Cereda D., Tirani M., Rovida F., Demicheli V., Ajelli M., Poletti P., Trentini F., Guzzetta G., Marziano V., Barone A., et al. The early phase of the COVID-19 outbreak in Lombardy, Italy. arXiv. 20202003.09320

LinkOut - more resources