. 2020 May 22;12(5):1324.
doi: 10.3390/cancers12051324.

An Integrated Genomic Strategy to Identify CHRNB4 as a Diagnostic/Prognostic Biomarker for Targeted Therapy in Head and Neck Cancer

Affiliations

An Integrated Genomic Strategy to Identify CHRNB4 as a Diagnostic/Prognostic Biomarker for Targeted Therapy in Head and Neck Cancer

Yi-Hsuan Chuang et al. Cancers (Basel). .

Abstract

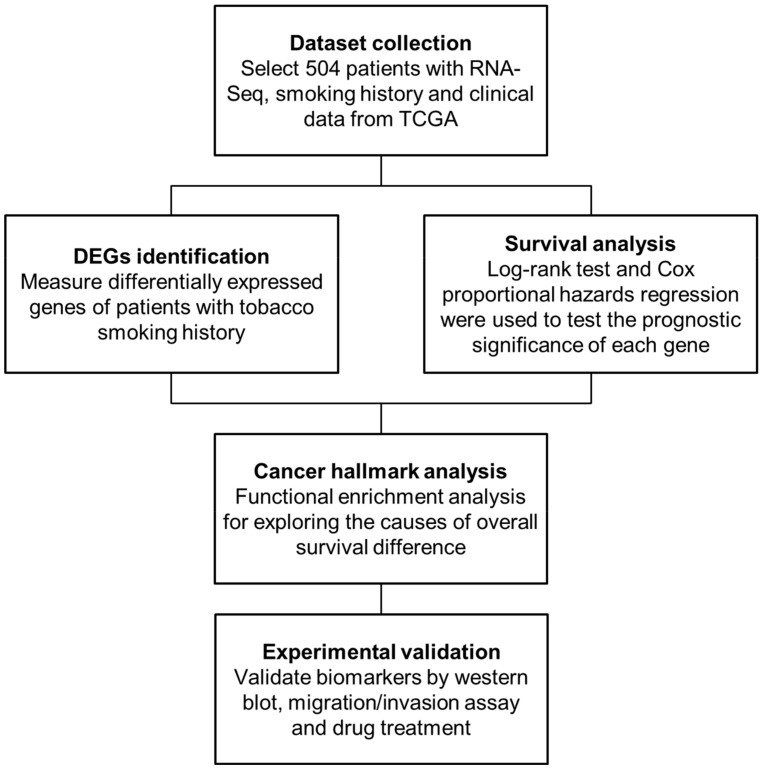
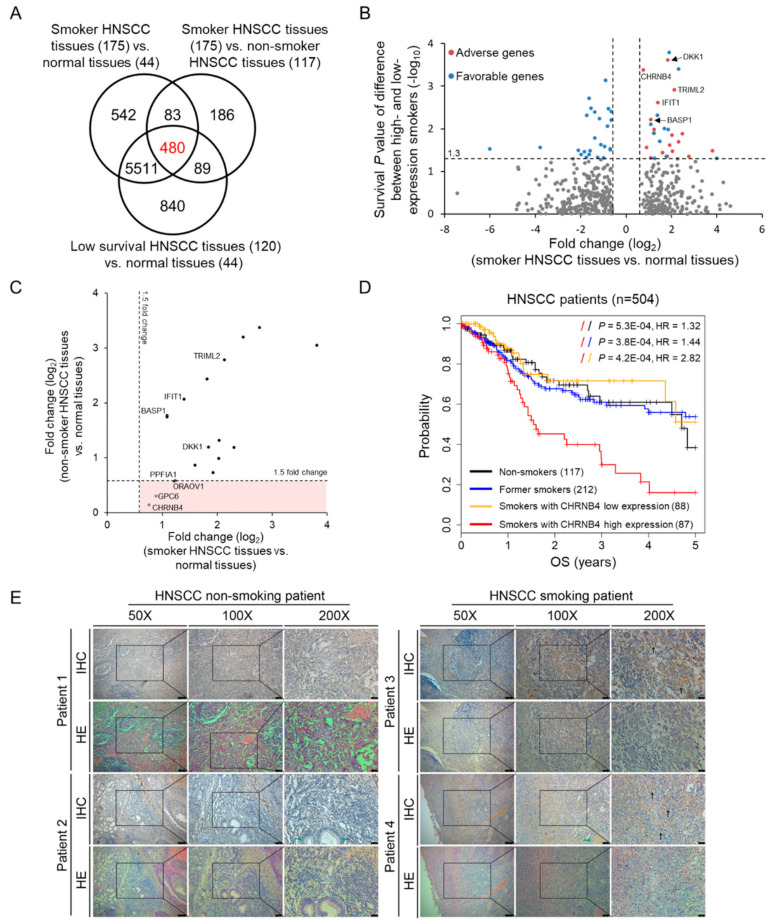
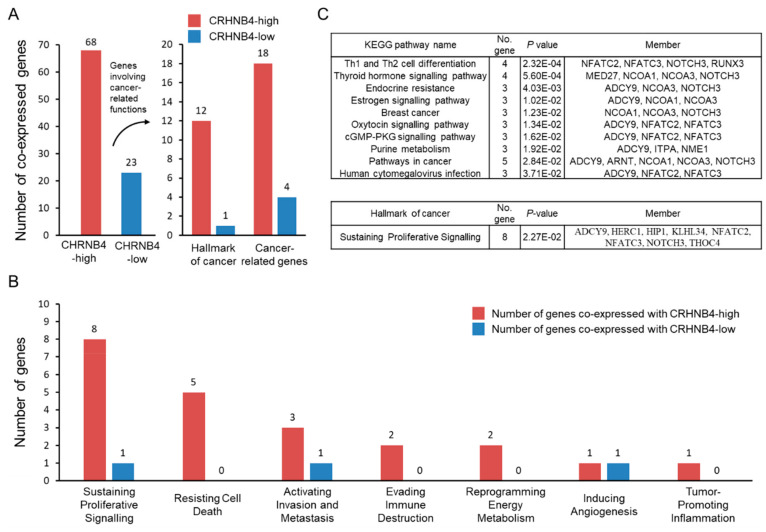
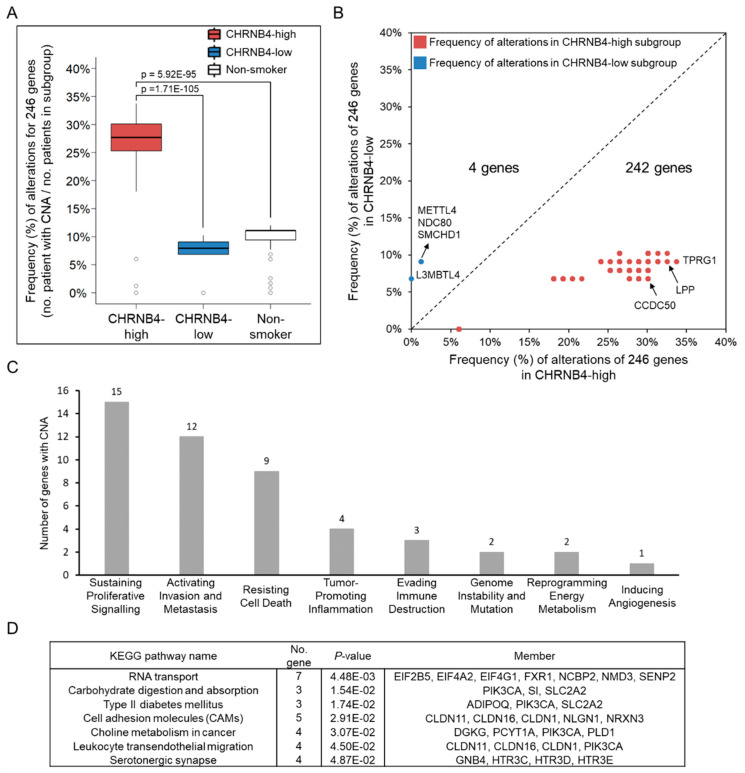
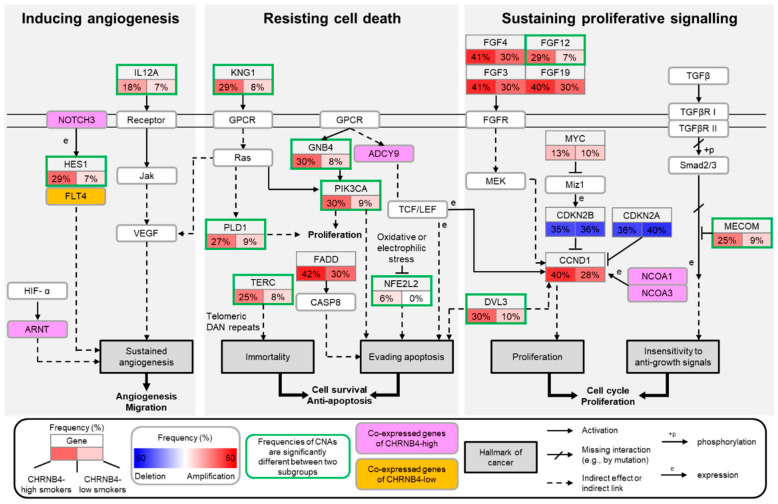
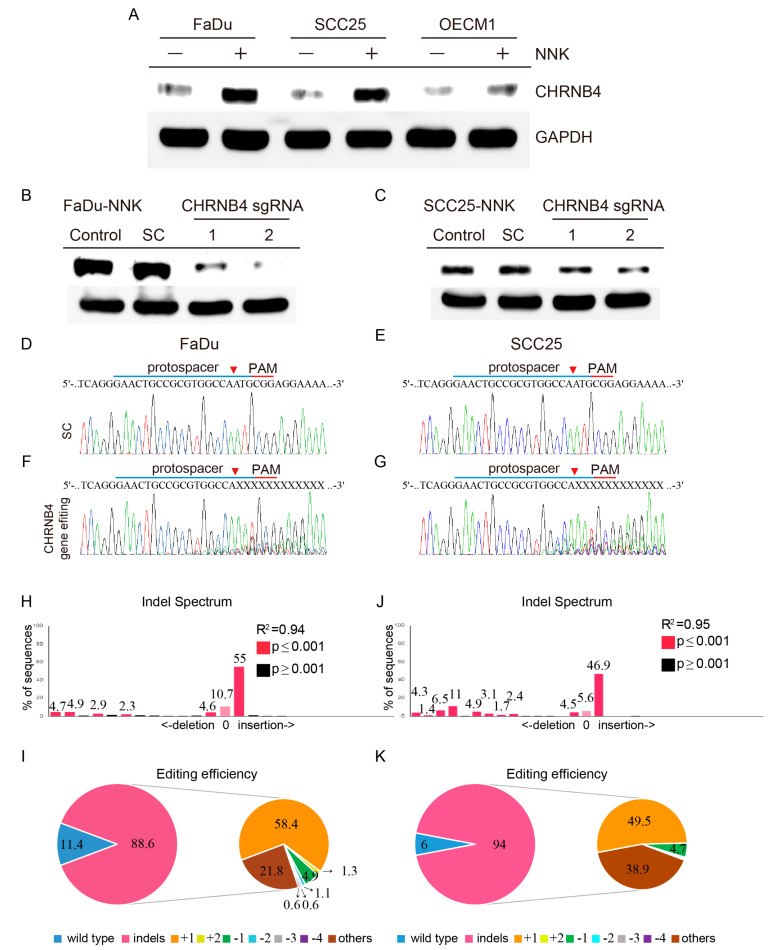
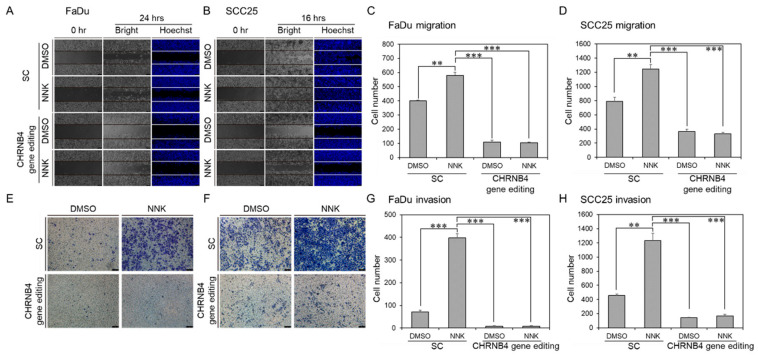
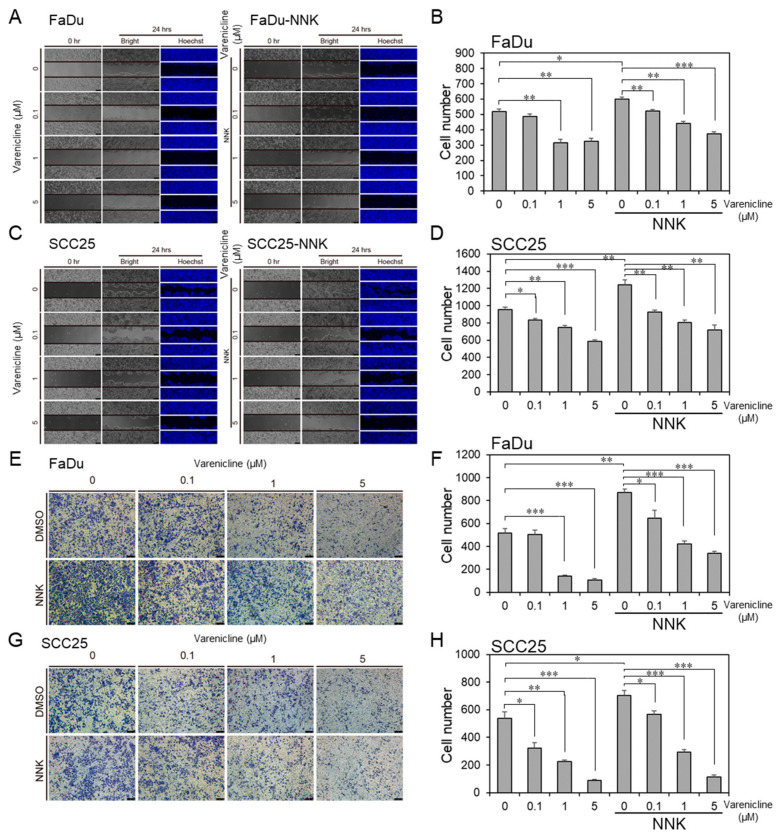
Although many studies have shown the association between smoking and the increased incidence and adverse prognosis of head and neck squamous cell carcinoma (HNSCC), the mechanisms and pharmaceutical targets involved remain unclear. Here, we integrated gene expression signatures, genetic alterations, and survival analyses to identify prognostic indicators and therapeutic targets for smoking HNSCC patients, and we discovered that the FDA-approved drug varenicline inhibits the target for cancer cell migration/invasion. We first identified 18 smoking-related and prognostic genes for HNSCC by using RNA-Seq and clinical follow-up data. One of these genes, CHRNB4 (neuronal acetylcholine receptor subunit beta-4), increased the risk of death by approximately threefold in CHRNB4-high expression smokers compared to CHRNB4-low expression smokers (log rank, p = 0.00042; hazard ratio, 2.82; 95% CI, 1.55-5.14), former smokers, and non-smokers. Furthermore, we examined the functional enrichment of co-regulated genes of CHRNB4 and its 246 frequently occurring copy number alterations (CNAs). We found that these genes were involved in promoting angiogenesis, resisting cell death, and sustaining proliferation, and contributed to much worse outcomes for CHRNB4-high patients. Finally, we performed CHRNB4 gene editing and drug inhibition assays, and the results validate these observations. In summary, our study suggests that CHRNB4 is a prognostic indicator for smoking HNSCC patients and provides a potential new therapeutic drug to prevent recurrence or distant metastasis.

Keywords: drug repurposing; head and neck squamous cell carcinoma (HNSCC); nicotine; prognostic biomarker; smoking.


Conflict of interest statement

The authors have declared no competing interests.

Figures

Figure 1
Figure 1
Main flowchart for identifying smoking-related biomarkers and repurposing drugs in head and neck squamous cell carcinoma (HNSCC). In total, 504 HNSCC patients, whose data included mRNA expression (RNA-Seq) data and clinical data (e.g., smoking history, survival state, and follow-up time), were selected from the The Cancer Genome Atlas (TCGA). Then, the differentially expressed genes were identified and survival analysis was investigated to determine the clinical outcome of smoking patients. Third, the enrichment analysis of cancer hallmarks was examined to understand the causes of poor prognosis in smoking patients. Finally, two HNSCC cell lines were utilized to validate gene candidates and drugs for their therapeutic potential.
Figure 2
Figure 2
The strategies for determining HNSCC smoking-related and prognostic biomarkers. (A) Venn diagram of differentially expressed genes (DEGs) among normal samples, and HNSCC samples from smoking, non-smoking, and low-survival patients. (B) Identification of 18 adverse (red) and 36 favourable (blue) prognostic genes from 480 DEGs by survival analysis based on high- and low-expression of each gene. (C) Fold change of 18 adverse genes comparing smoker (x-axis) and non-smoker (y-axis) HNSCC tumours to normal tissues. Four genes are located in red region because they are differentially expressed between smoker tumours and normal tissues, but are not between non-smoker tumours and normal tissues. (D) Kaplan–Meier plots of overall survival (OS) of 504 HNSCC patients, including non-smokers (black), former smokers (blue), smokers with low neuronal acetylcholine receptor subunit beta-4 (CHRNB4) expression (orange), and smokers with high CHRNB4 expression (red). (E) Immunohistochemistry stain of clinical HNSCC patients. The tumour region tissue slides from smoking and non-smoking HNSCC patients were stained with CHRNB4 primary antibody, whereas all adjacent sections and same slides were counterstained with haematoxylin and eosin (HE stain) for general histological orientation. Intensive membrane CHRNB4 expression on cancerous region is black arrowed, whereas the CHRNB4 expression in normal adjacent region is indicated by a green arrow.
Figure 3
Figure 3
Association between cancer-related functions and CHRNB4 co-expressed genes of CHRNB4-high/low patients. (A) Number of co-expressed genes with CHRNB4 in the CHRNB4-high and -low subgroups involved in cancer hallmark and cancer-related functions. (B) The histogram of co-expressed genes involved in seven cancer hallmarks in CHRNB4-high (red) and CHRNB4-low (blue) smoking patients. (C) Kyoto Encyclopedia of Genes and Genomes (KEGG) pathway and cancer hallmarks enrichment analysis of co-expressed genes in the CHRNB4-high subgroup.
Figure 4
Figure 4
Copy number alterations (CNAs) between the CHRNB4-high and -low subgroups. (A) The boxplots of 246 differential CNAs in CHRNB4-high smoking (red), CHRNB4-low smoking (blue), and non-smoking (white) patients. The two-sided p-value was calculated with Student’s t-test. (B) Scatter plots of CNAs between the CHRNB4-high (x-axis) and CHRNB4-low (y-axis) smoking patients. The genes below the diagonal line indicate that the genes had a higher frequency of genetic alterations in the CHRNB4-high subgroup (red) than in the CHRNB4-low subgroup (blue). (C) The histogram of eight cancer hallmarks of genes with differently frequent CNA between CHRNB4-high and CHRNB4-low subgroups. (D) KEGG pathway enrichment analysis of 246 copy number-altered genes.
Figure 5
Figure 5
Graphic illustration of the identified genes, functions, and pathways of tumorigenesis in CHRNB4-high and CHRNB4-low subgroups. The key genes, limited number of pathways, and inferred functions for tumorigenesis are based on CHRNB4-high and CHRNB4-low smokers. Subpanels indicate the frequency (%) of copy number alteration (CNA) in CHRNB4-high (left subpanel) and CHRNB4-low subgroups (right subpanel). In each subgroup, the subpanels display the difference (subtraction) of the frequencies between amplification and deletion, and are coloured red if the frequency of amplification is greater than the frequency of deletion, otherwise they are coloured blue. The green border indicates a gene whose CNA frequency between CHRNB4-high and -low subgroups was significantly different (examined by Fisher’s exact test, p < 0.05). Five genes (e.g., NOTCH3, ARNT) are coloured pink, and one gene (FLT4) is orange, representing the genes co-expressed with CHRNB4 in CHRNB4-high and -low subgroups, respectively.
Figure 6
Figure 6
Validation of CHRNB4 gene editing in FaDu and SCC25 HNSCC cells using the CRISPR/Cas9 system. (A) The induction of CHRNB4 protein expressions on long-term nicotine-derived nitrosamine ketone (NNK)-treated HNSCC cells. The FaDu, SCC25, and OECM1 cell lines were treated NNK for 1 month, followed by performing Western blot to compare the CHRNB4 protein expression with their parental controls. The protein validations of CHRNB4 gene editing were performed by CHRNB4 sgRNA-1, sgRNA-2, and scramble-sgRNA virus transfected into long-term NNK-treated (B) FaDu and (C) SCC25 cells. Schematic representation of the human CHRNB4 protospacer sequence (blue underline) for gene editing. The arrowhead indicates the expected Cas9 cleavage site. The protospacer adjacent motif (PAM, red underline) is the motif required for Cas9 nuclease activity. CHRNB4 sgRNA-2 and scrambled (SC) sgRNA were delivered to FaDu (D,F) and SCC25 (E,G) cells by lentivirus. After transduction, DNA from virus-infected cells was purified and subjected to Sanger sequencing of CHRNB4 gene locus. The Tracking of Indels by Decomposition (TIDE) analysis is shown for CHRNB4 sgRNA-2 virus transfected in FaDu (H) and SCC25 (J) cells, compared to SC control. The pie charts show the percentages of indels in the CHRNB4 gene editing by CHRNB4 sgRNA-2 lentivirus on FaDu (I) and SCC25 (K) cells. The gene editing efficiency of the two cell lines are presented in pink, while the two most common +1 indels and other mutations are presented in orange and brown, respectively.
Figure 7
Figure 7
Migration and invasion effects in parental and NNK-treated HNSCC cell lines with CHRNB4 gene editing. The migration and invasion assays of long-term NNK-treated (A,E) FaDu and (B,F) SCC25 cell lines with or without 0.1 μM NNK treatments were conducted and recorded. The migration and invasion of (C,G) FaDu and (D,H) SCC25 cell lines were counted and presented in a histogram. The experiments were repeated three times, and a two-sided p-value was calculated with Student’s t-test. The error bars indicate the standard error. p-values less than 0.01, and 0.001 are denoted by **, and ***, respectively.
Figure 8
Figure 8
An FDA-approved drug, varenicline, inhibits migration and invasion in NNK-treated cells. Migration ability was measured after 24 h of varenicline treatment at 0.1, 1, and 5 µM in (A,B) FaDu and (C,D) SCC25 cell lines with or without NNK treatments. Invasion ability was measured after 48 h of varenicline treatment at 0.1, 1, and 5 µM in (E,F) FaDu and (G,H) SCC25 cell lines with or without NNK treatments. The experiments were repeated three times, and a two-sided p-value was calculated with Student’s t-test. The error bars indicate the standard error. p-values less than 0.05, 0.01, and 0.001 are denoted by *, **, and ***, respectively.

Similar articles

Cited by

References

    1. Bray F., Ferlay J., Soerjomataram I., Siegel R.L., Torre L.A., Jemal A. Global Cancer Statistics 2018: Globocan Estimates of Incidence and Mortality Worldwide for 36 Cancers in 185 Countries. CA Cancer J. Clin. 2018;68:394–424. doi: 10.3322/caac.21492. - DOI - PubMed
    1. Marur S., Forastiere A.A. Head and Neck Squamous Cell Carcinoma: Update on Epidemiology, Diagnosis, and Treatment. Mayo Clin. Proc. 2016;91:386–396. doi: 10.1016/j.mayocp.2015.12.017. - DOI - PubMed
    1. Lohavanichbutr P., Houck J., Fan W., Yueh B., Mendez E., Futran N., Doody D.R., Upton M.P., Farwell D.G., Schwartz S.M., et al. Genomewide Gene Expression Profiles of Hpv-Positive and Hpv-Negative Oropharyngeal Cancer: Potential Implications for Treatment Choices. Arch. Otolaryngol. Head Neck Surg. 2009;135:180–188. doi: 10.1001/archoto.2008.540. - DOI - PMC - PubMed
    1. Leemans C.R., Braakhuis B.J., Brakenhoff R.H. The Molecular Biology of Head and Neck Cancer. Nat. Rev. Cancer. 2011;11:9–22. doi: 10.1038/nrc2982. - DOI - PubMed
    1. Suh Y., Amelio I., Urbano T.G., Tavassoli M. Clinical Update on Cancer: Molecular Oncology of Head and Neck Cancer. Cell Death Dis. 2014;5:e1018. doi: 10.1038/cddis.2013.548. - DOI - PMC - PubMed

LinkOut - more resources