. 2020 Oct;17(10):1416-1426.
doi: 10.1080/15476286.2020.1771945. Epub 2020 Jun 16.

Competitive learning suggests circulating miRNA profiles for cancers decades prior to diagnosis

Affiliations

Competitive learning suggests circulating miRNA profiles for cancers decades prior to diagnosis

Andreas Keller et al. RNA Biol. 2020 Oct.

Abstract

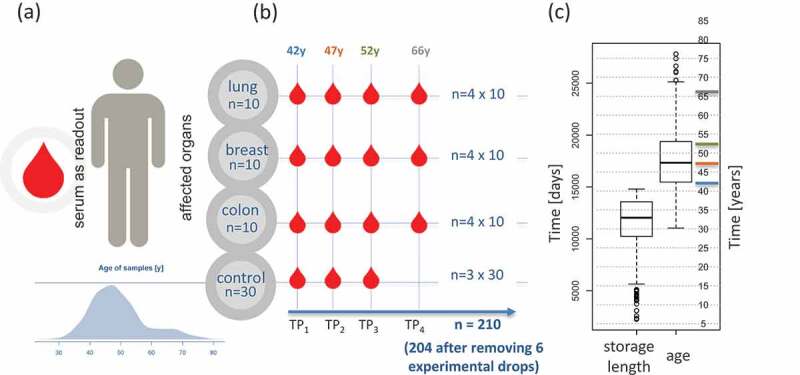
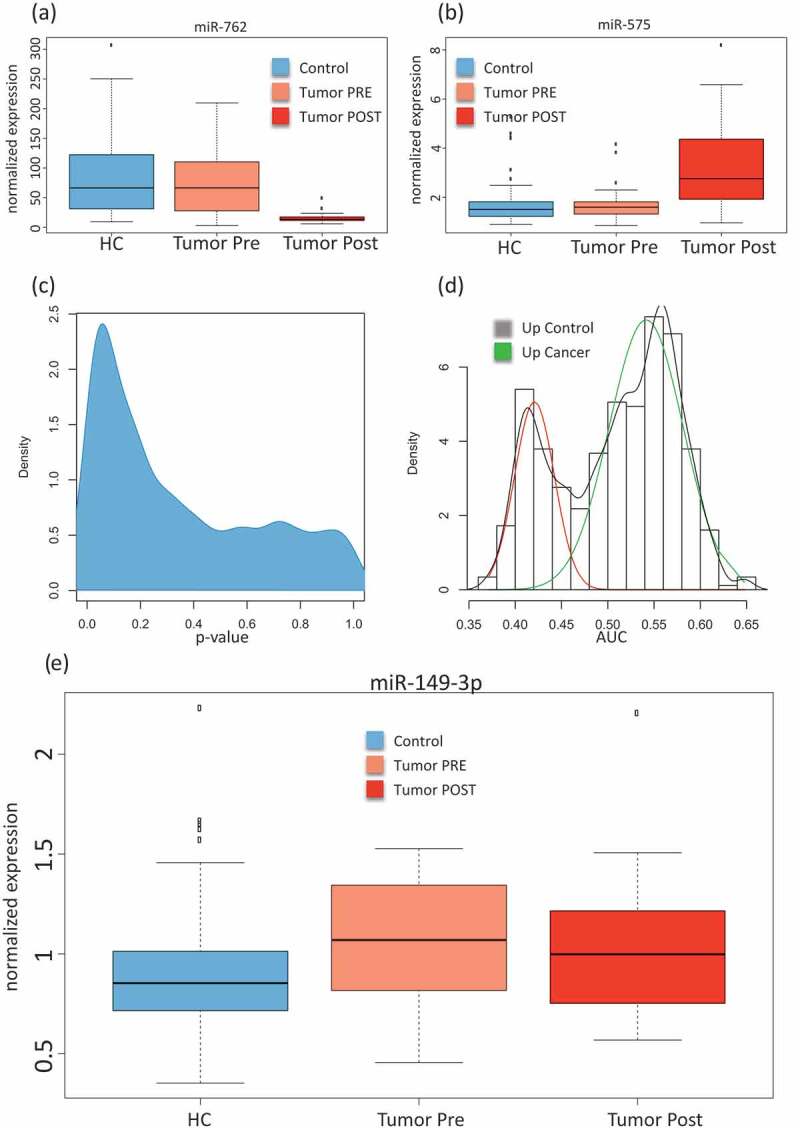
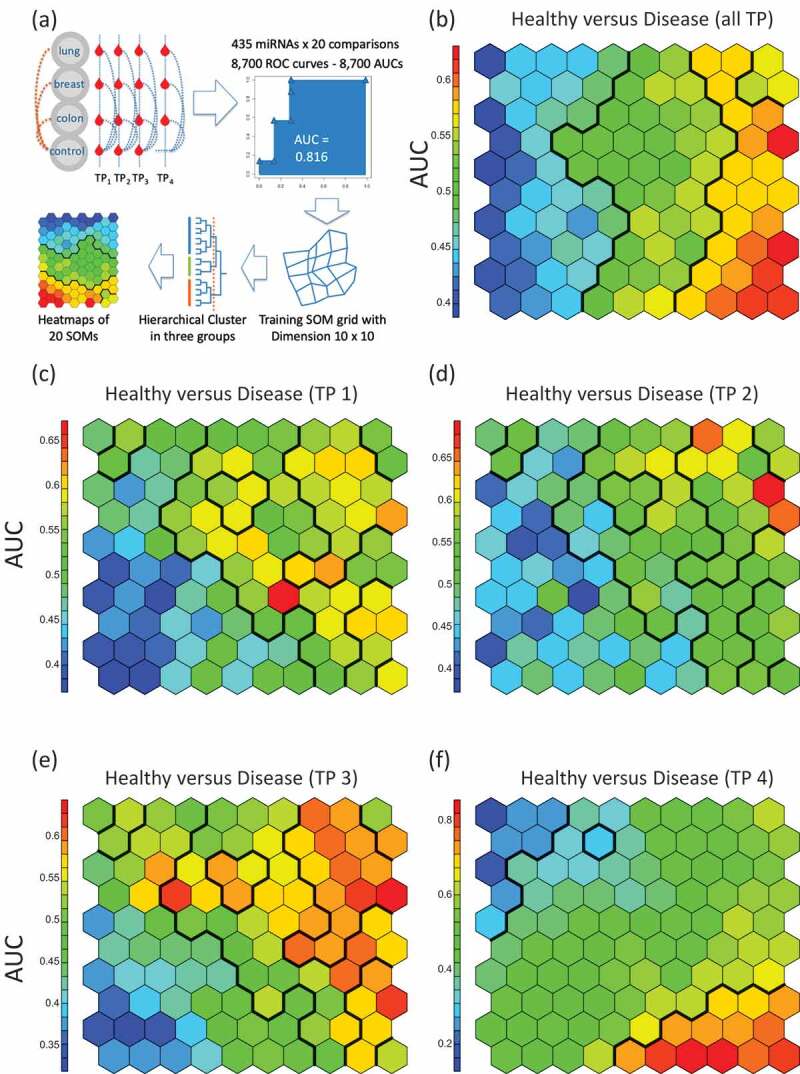
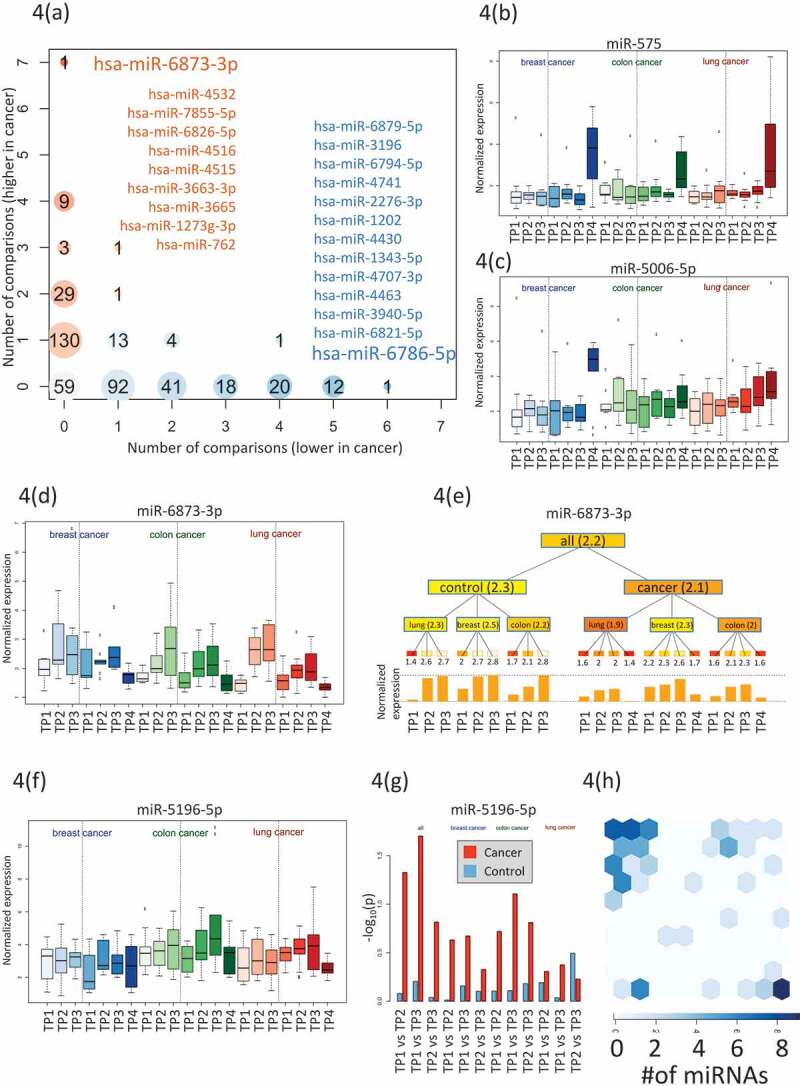
MicroRNAs are regulators of gene expressionand may be key markers in liquid biopsy.Early diagnosis is an effective means to increase patients' overall survival. We generated genome-wide miRNA profiles from serum of patients and controls from the population-based Janus Serum Bank (JSB) and analysed them by bioinformatics and artificial intelligence approaches. JSB contains sera from 318,628 originally healthy persons, more than 96,000 of whom developed cancer. We selected 210 serum samples from patients with lung, colon or breast cancer at three time points prior to diagnosis (up to 32 years prior to diagnosis with median 5 years interval between TPs), one time-point after diagnosis and from individually matched controls. The controls were matched on age and year of all pre-diagnostic sampling time-points for the corresponding case. Using ANOVA we report 70 significantly deregulated markers (adjusted p-value<0.05). The driver for the significance was the diagnostic time point (miR-575, miR-6821-5p, miR-630 with adjusted p-values<10-10). Further, 91miRNAs were differently expressed in pre-diagnostic samples as compared to controls (nominal p < 0.05). Self-organized maps (SOMs)indicated larges effects in lung cancer samples while breast cancer samples showed the least pronounced changes. SOMsalsohighlighted cancer and time point specific miRNA dys-regulation. Intriguingly, a detailed breakdown of the results highlighted that 51% of all miRNAs were highly specific, either for a time-point or a cancer entity. Pathway analysis highlighted 12 pathways including Hipo signalling and ABC transporters.Our results indicate that tumours may be indicated by serum miRNAs decades prior the clinical manifestation.

Keywords: artificial intelligence; bioinformatics; breast cancer; cancer; colon cancer; liquid biopsy; lung cancer; miRNA; non-coding RNA.


Conflict of interest statement

No potential conflict of interest was reported by the authors.

Figures

Figure 1.
Figure 1.
Study set-up and characteristicsof theparticipants.(A) Age distribution and read out. (B) Sampling bycancer type and time point (TP). TP1, 2 and 3 refer to pre-diagnostic sampling time points, TP4 is a sampling time-point after cancer diagnosis. Numbers above each TP represent the median age of all samples included in this TP.(C) Distribution of storage length and age of blood donors(in days and years)for all samples.Horizontal coloured lines represent the median of the four time points.
Figure 2.
Figure 2.
Comparison between cancer and control samples. (A) Box-plot of the normalized expression values of miR-762 in all control samples (HC; free from cancer during the study), all samples collected prior to cancer diagnosis(Tumour Pre)and all samples collected after cancer diagnosis(Tumour Post). (B) Box-plot of the normalized expression values of miR-575, the most significant miRNA in the analysis of variance. (C) Density distribution of unadjusted p-values for the comparison between all pre sampling time points and the matchedcontrols, showing an enrichment of low (significant) p-values.(D) AUC distributions for the comparison between all cancer pre sampling time points and the matchedcontrols. An AUC close to 1 indicates higher expression in cancer samples and an AUC close to 0 indicate higher expression in the control samples.The AUC was computed from all receiver operator characteristic curves (ROC) for paired comparisons of cancer to matched controls in each cancer type separately.The red curve corresponds to miRNAs with higher expression in the control samples and the green curve to miRNAs with higher expression in pre-diagnostic cancer samples. (E) Box-plot of the normalized expression values for miR-149-3p showing higher expression in pre-diagnostic cancer samplescompared to the matched controls.
Figure 3.
Figure 3.
Self-organized maps (SOMs) analysis.(A) Schematic representation of the workflow. We performed all pair-wise comparisons for tumours and matched samples as well as TP4 and all controls per cancer type (blue dotted lines) and for all cancer types together (orange dotted lines). The SOMs were trained with AUC data from all 20 comparisons. For the analysis groups, clusters were determined by using hierarchical clustering and heat maps were generated. In the heat maps, hexagons represents at least one but usually a set of miRNAs. The colorof a hexagon represents the AUC values of the miRNAs in that hexagonwith the colour code indicated to the left of each subfigure. (B) SOM for the comparison between all samples of the cancer patients and all control samples. Hierarchical clustering identified vertical sections indicating three clusters of differentially expressed miRNAs. (C) SOM for the comparison between of all samples collected at the first time point prior to cancer diagnosis as compared to matched controls. There is a cluster of miRNAs with lower expression in the pre-diagnostic cancer samples (indicated in blue in the lower left corner). (D) SOM for the comparison between all samples collected at the second time point prior to cancer diagnosis as compared to matched controls. The cluster of miRNAs with lower expression in pre-diagnostic cancer samples is less evident than for the first time point. (E) SOM for the comparison between all samples collected at the third time point prior to cancer diagnosis as compared to matched controls. There is again a cluster of miRNAs with lower expression but also a cluster with higher expression in pre-diagnostic cancer samples. (F)SOM for the comparison between all samples collected after cancer diagnosis as compared to combined controls (healthy controls). The upper left corner describes a cluster of miRNAs with lower expression while the lower right corner represents a cluster with higher expression in post-diagnostic cancer samples. The overall SOM in Fig.3blargely comprises both, the blue and red clusters from the comparisons shown in Fig. 3C-f.
Figure 4.
Figure 4.
Specific miRNA patterns. (A) Computation of the number of significantly higher- or lower expressed miRNA for each time point and each cancer. Higher expressed miRNAs are indicated in red and lower expressed miRNAs in blue. The bubble size corresponds to the number of miRNAs found for a given time point and a specific cancer.Specifically indicated in blue is miR-6786 that were lower expressed in 6 analyses and higher expressed in none of the analyses.Also indicated in blue are the 12 miRNAs with lower expression in 6 analyses and higher expression in none of the analyses.Specifically indicated in orange is miR-6873-3p that were higher expressed in 7 analyses and lower expressed in none of the analyses.Also indicated in orange are the 9 miRNAs with higher expression in 4 analyses and lower expression in none of the analyses.(B) The boxplot presents the normalized expression intensity of miR-575 in 21 groups (3 cancer types in blue, green and red shading and for each cancer type three control time points (left part in each panel) and four cancer time points (right part in each panel). This miRNA was already highest in the analysis of variance and presented in Fig. 2A.(C) Analogously to Fig. 4B we present the expression of miR-5006-5p, showing steadily increasing expression over time for lung cancer patients but not for controls. This miRNA is potentially an early lung cancer marker. (D) Analogously to Fig. 4B we present the expression of miR-6873-3p, that is steadily increasing over time both for the controls and for the cancer samples. This miRNA seems to be rather age than disease related. (E) For the same miRNA (miR-6873-3p) the expression for all groups is shown as tree structure. The leaves are the same 21 groups of three cancers time seven total time points. The numbers below the leaves represent the average expression of all samples in this group. Internal nodes contain the average of all nodes in the hierarchy below this node. The bar graph at the bottom represents the expression intensity of the leaves.(F) Analogously to Fig. 4b we present the expression of miR-5196-5p. It shows a more constant expression in all control samples but higher variability in the cancer samples. (G) For this miRNA (miR-5196-5p) we computed all pair-wise comparisons between time points (TP1 to TP2; TP1 to TP3; TP2 to TP3) for controls(blue bars) and cases (red bars). Again, the analysis has been performed once with all cancer types together (grey shaded area) and for the cancer types separately (shaded in blue, green and red respectively). The height of the bar corresponds to the negative decade logarithm of p-values.The p-values for cancer comparisonssignificantly exceed the values for the controls. (H) Allocation of 67 miRNAs, which were identified with a significantly altered expression by the different comparisons to the SOMs shown in Fig. 3. All miRNAs were identified by the SOM analysis that shown a strong enrichment for these miRNAs (upper left corner of the SOM map).

References

    1. He L, Hannon GJ.. MicroRNAs: small RNAs with a big role in gene regulation. Nat Rev Genet. 2004;5(7):522–531. - PubMed
    1. Bartel DP. MicroRNAs: genomics, biogenesis, mechanism, and function. Cell. 2004;116(2):281–297. - PubMed
    1. Hart M, Kern F, Backes C, et al. The deterministic role of 5-mers in microRNA-gene targeting. RNA Biol. 2018;15(6):819–825. - PMC - PubMed
    1. Lu J, Getz G, Miska EA, et al. MicroRNA expression profiles classify human cancers. Nature. 2005;435(7043):834–838. - PubMed
    1. Maciotta S, Meregalli M, Torrente Y. The involvement of microRNAs in neurodegenerative diseases. Front Cell Neurosci. 2013;7:265. - PMC - PubMed

Publication types

LinkOut - more resources