. 2020 May 26;21(1):125.
doi: 10.1186/s13059-020-02013-3.

FORK-seq: replication landscape of the Saccharomyces cerevisiae genome by nanopore sequencing

Affiliations

FORK-seq: replication landscape of the Saccharomyces cerevisiae genome by nanopore sequencing

Magali Hennion et al. Genome Biol. .

Abstract

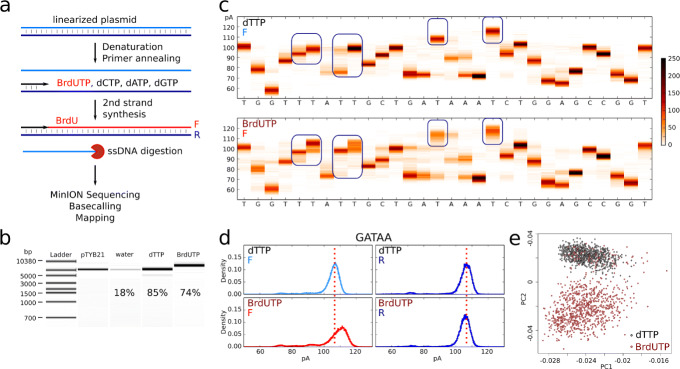
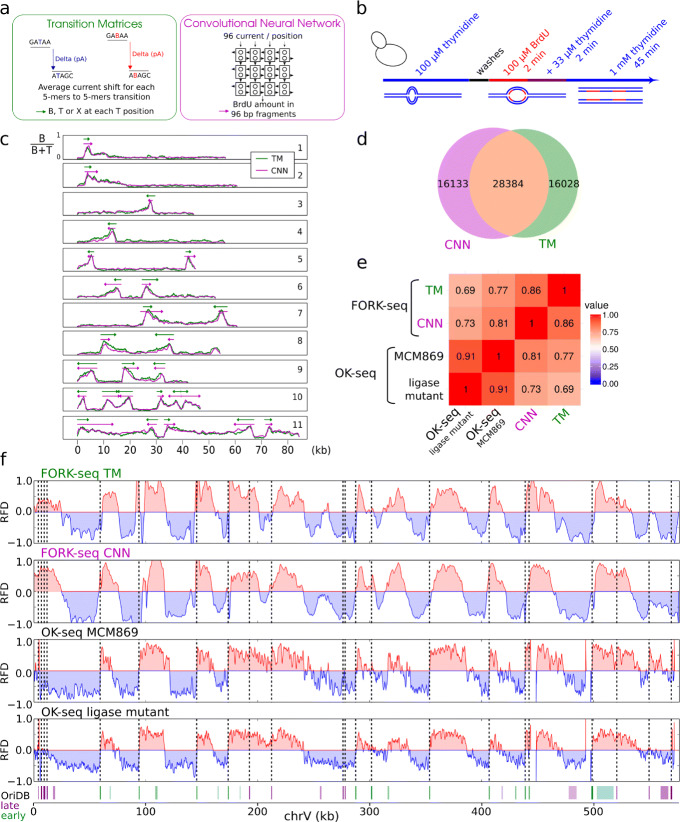
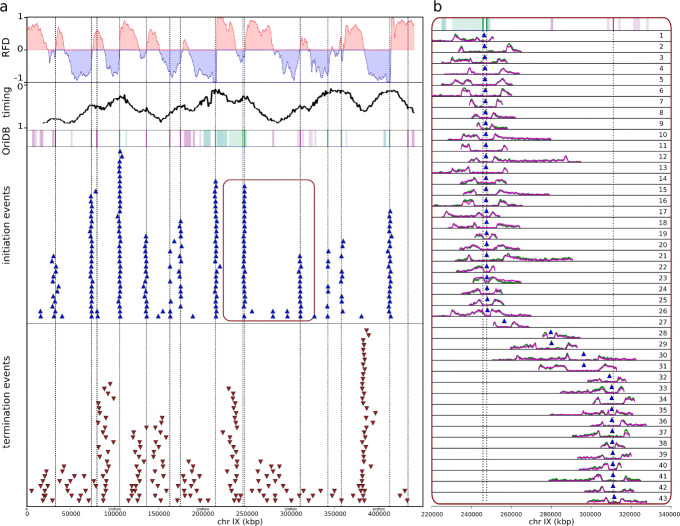
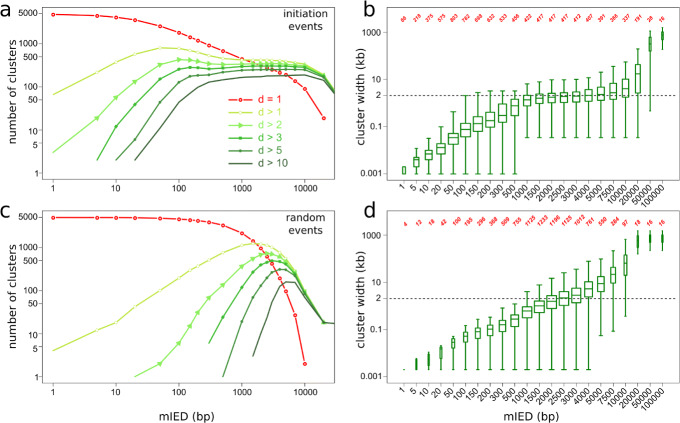
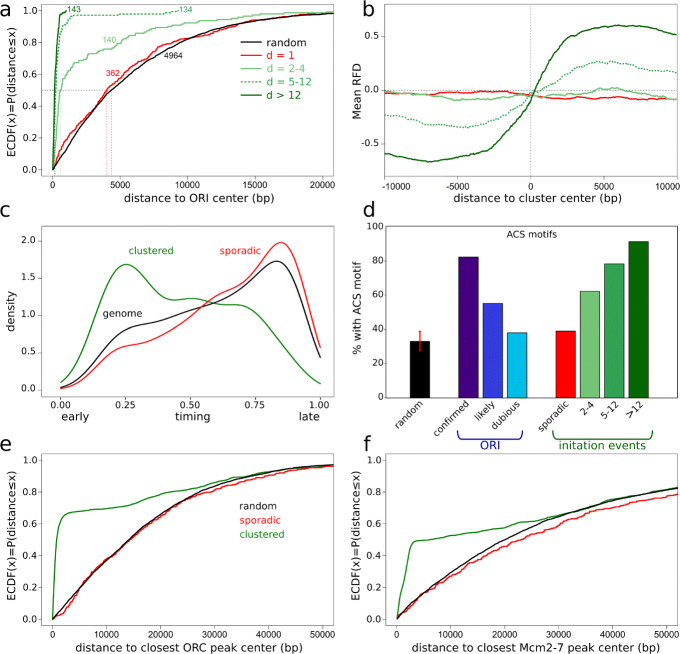
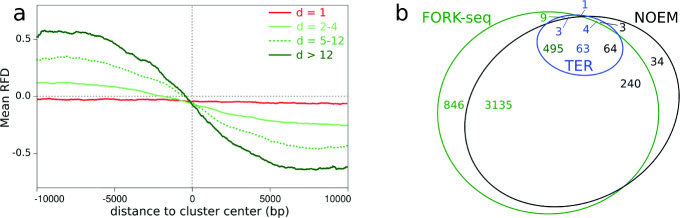
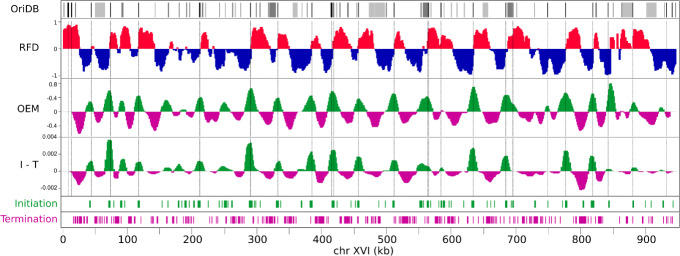
Genome replication mapping methods profile cell populations, masking cell-to-cell heterogeneity. Here, we describe FORK-seq, a nanopore sequencing method to map replication of single DNA molecules at 200-nucleotide resolution. By quantifying BrdU incorporation along pulse-chased replication intermediates from Saccharomyces cerevisiae, we orient 58,651 replication tracks reproducing population-based replication directionality profiles and map 4964 and 4485 individual initiation and termination events, respectively. Although most events cluster at known origins and fork merging zones, 9% and 18% of initiation and termination events, respectively, occur at many locations previously missed. Thus, FORK-seq reveals the full extent of cell-to-cell heterogeneity in DNA replication.

Keywords: Bromodeoxyuridine; Convolutional neural network; DNA replication; Nanopore sequencing; Replication origins; S. cerevisiae; Single-molecule analysis.


Conflict of interest statement

The authors declare that they have no competing interests.

Figures

Fig. 1
Fig. 1
Effect of BrdU incorporation into DNA on nanopore sequencing current signal. a Scheme of sample preparation. F, forward strand; R, reverse strand. b Bioanalyzer size control of the samples, with Qubit yield indicated. pTYB21, linearized plasmid; water, primer extension in the absence of dTTP and BrdUTP; dTTP, primer extension using canonical dNTPs; BrdUTP, primer extension using BrdUTP instead of dTTP. c Example of a 30-bp sequence of the forward (F) strand (positions 1000–1029) with current distribution of 500 reads at each position. Upper panel: sample obtained using canonical dNTPs. Lower panel : dTTP was replaced by BrdUTP. Blue rectangles highlight some current shifts due to the presence of BrdU. BrdU did not induce a current shift at all thymidine sites. d Current distribution for the “GATAA” pentamer for the dTTP (top) and the BrdUTP (bottom) samples on the forward (F, modified strand, left) and the reverse (R, native strand, right) strands. e Principal component analysis using as inputs 1-kb-long current value sequences (positions 100–1100 on the reference plasmid sequence) from 1000 reads for dTTP (black) and BrdUTP (brown) samples (F strand). The first two components are represented. Only “pass” reads were used in c, d,and e
Fig. 2
Fig. 2
Detection of individual replication forks. a BrdU content estimation methods. b Scheme of sample preparation. c Exemplary BrdU content profiles (B/(B+T) ratio; B, BrdU, T, thymidine) along nanopore reads using CNN (pink) or TM (green). Shown are examples for rightward- (1, 2) and leftward-moving (3, 4) forks, initiation (5, 6) and termination (7, 8) events, and multi-replicon patterns (9–11). d Venn diagram of the overlap between the CNN- and TM-detected forks. e Spearman correlation coefficients between four RFD profiles of the whole genome at 1 kb smoothing obtained by the indicated methods. Top to bottom: FORK-seq TM and CNN, sequencing of EdU-labeled Okazaki fragments from MCM869 (OK-seq) and of accumulated Okazaki fragments from a ligase mutant [14]. f RFD profiles from the four different methods for chromosome V. Bottom, known origins from OriDB [23] (violet, late, cyan, early; color intensity reflects OriDB classification: bright, confirmed, medium, likely, light, dubious). Vertical dotted line, confirmed origins
Fig. 3
Fig. 3
Detection of initiation and termination events. a Top to bottom: FORK-seq RFD profile obtained merging data obtained from CNN and TM, replication timing profile [24], known origins from OriDB [23] (see Fig. 2 legend), detected initiation (blue triangles) and termination (red inverted triangles) events of chromosome IX. Dotted vertical lines: confirmed origins [23]. b Zoom-in of all initiation events (CNN in pink, TM in green) of the indicated 120-kb segment of chromosome IX (red area)
Fig. 4
Fig. 4
Clustering of individual initiation events. ad Number of clusters of indicated dimensions (a, c) and cluster width (d> 1) distribution (b, d) against mIED for experimental (a, b) and randomized (c, d) distribution of initiation events. Box-and-whisker plots (b, d) show median, 2nd and 3rd quartile, and range of each distribution. Red numbers (b, d) indicate the number of clusters (d> 1) for each mIED
Fig. 5
Fig. 5
Landscape of individual initiation events. a Empirical cumulative distribution function (ECDF) of the distances between cluster median points, grouped according to cluster dimension, and the closest known origin (ORI, confirmed, likely and dubious origins from OriDB [23]) center. Black, random elements; red, sporadic initiation events; light, median, and dark green, initiation clusters of dimension d = 2–4, d = 5–12, and d > 12, respectively. The number of elements in each category is written next to each curve. b Averaged RFD profile for the clusters grouped according to their dimension (− 10 kb, + 10 kb from the cluster median). rDNA cluster was excluded. c Density distribution of normalized replication timing (0 = start and 1 = end of S phase) for the whole genome (black) and the clustered (green) and sporadic (red) initiation events. d ACS-motif containing fraction of the indicated elements: randomized initiation events; confirmed, likely and dubious origins from OriDB [23]; sporadic (d = 1) and clustered (d = 2–4; d = 5–12; d > 12) initiation events. For randomized elements, the randomization was repeated 1000 times and the median and [0.01,0.99] percentile interval are shown (red bar). ef ECDF of the distance between sporadic (red), clustered (green), and randomly shuffled (black) initiation events, and the center of the closest ORC [25] (e) or Mcm2-7 [27] (f) binding site
Fig. 6
Fig. 6
Landscape of individual termination events. a Averaged RFD profile for the clusters grouped according to their dimension (− 10 kb, + 10 kb from the cluster median). rDNA cluster was excluded. Red, sporadic termination events; light, median (dotted line), and dark green, termination clusters of dimension d = 2–4, d = 5–12, and d> 12, respectively. b Venn diagram showing the overlap between FORK-seq termination events, TERs [13], and negative OEM (NOEM) segments. The number of elements in each area are indicated in the same color as each class of objects
Fig. 7
Fig. 7
Similarity of initiation minus termination efficiencies computed from the FORK-seq RFD profile or from the individual initiation and termination events. Top to bottom: OriDB origins (black, confirmed, dark gray, likely, light gray, dubious [23]). RFD profile from FORK-seq data; OEM computed from RFD profile; density profile of initiation minus termination events (I-T); individual initiation events; individual termination events

References

    1. Lebofsky R, Heilig R, Sonnleitner M, Weissenbach J, Bensimon A. DNA replication origin interference increases the spacing between initiation events in human cells. Mol Biol Cell. 2006;17(12):5337–45. - PMC - PubMed
    1. Demczuk A, Gauthier MG, Veras I, Kosiyatrakul S, Schildkraut CL, Busslinger M, Bechhoefer J, Norio P. Regulation of DNA replication within the immunoglobulin heavy-chain locus during B cell commitment. PLoS Biol. 2012;10(7):1001360. - PMC - PubMed
    1. De Carli F, Gaggioli V, Millot GA, Hyrien O. Single-molecule, antibody-free fluorescent visualisation of replication tracts along barcoded DNA molecules. Int J Dev Biol. 2016;60(7-8-9):297–304. - PubMed
    1. De Carli Francesco, Menezes Nikita, Berrabah Wahiba, Barbe Valérie, Genovesio Auguste, Hyrien Olivier. High-Throughput Optical Mapping of Replicating DNA. Small Methods. 2018;2(9):1800146.
    1. Klein K, Wang W, Borrman T, Chan S, Zhang D, Weng Z, Hastie A, Chen C, Gilbert DM, Rhind N. Genome-wide identification of early-firing human replication origins by optical replication mapping. BioRXiV. 2017.

Publication types

Substances