. 2020 May 27;18(1):157.
doi: 10.1186/s12916-020-01619-5.

Evaluation of the potential incidence of COVID-19 and effectiveness of containment measures in Spain: a data-driven approach

Affiliations

Evaluation of the potential incidence of COVID-19 and effectiveness of containment measures in Spain: a data-driven approach

Alberto Aleta et al. BMC Med. .

Abstract

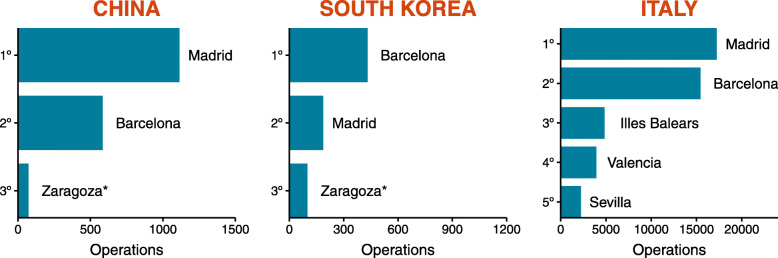
Background: We are currently experiencing an unprecedented challenge, managing and containing an outbreak of a new coronavirus disease known as COVID-19. While China-where the outbreak started-seems to have been able to contain the growth of the epidemic, different outbreaks are nowadays present in multiple countries. Nonetheless, authorities have taken action and implemented containment measures, even if not everything is known.

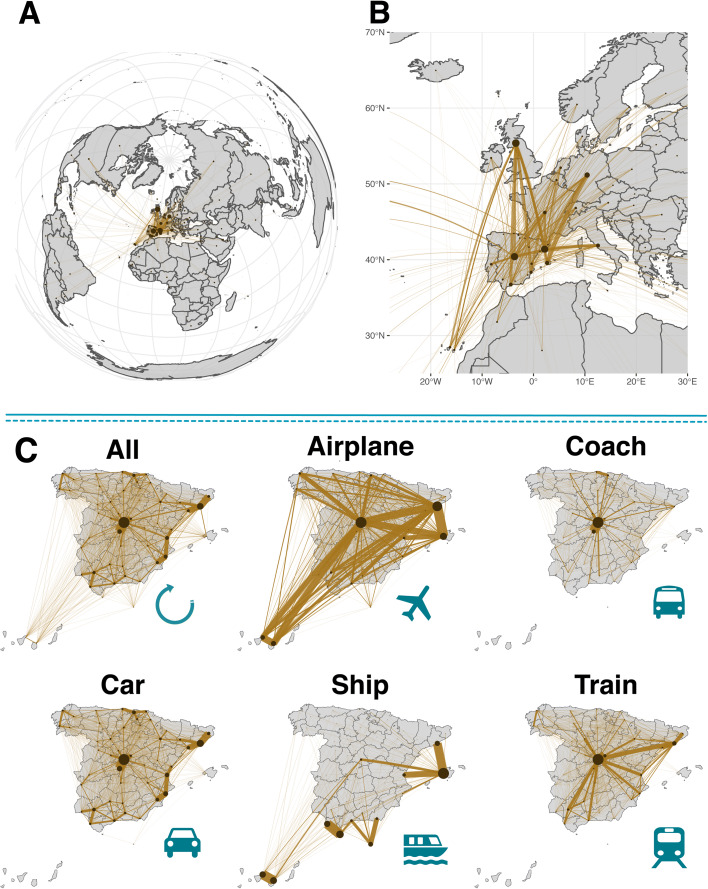
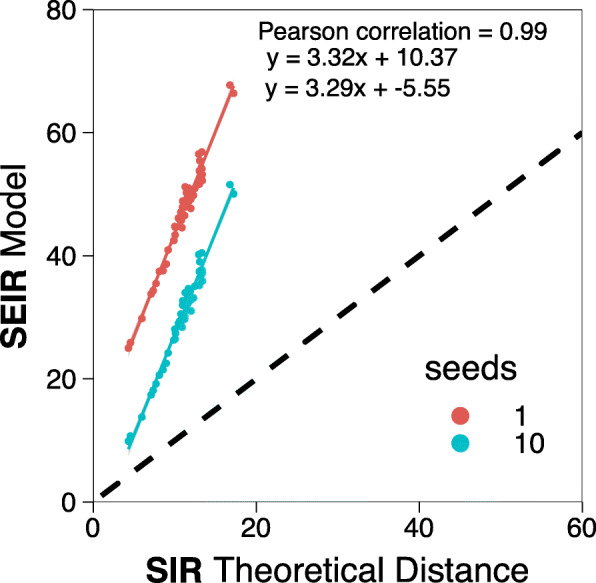
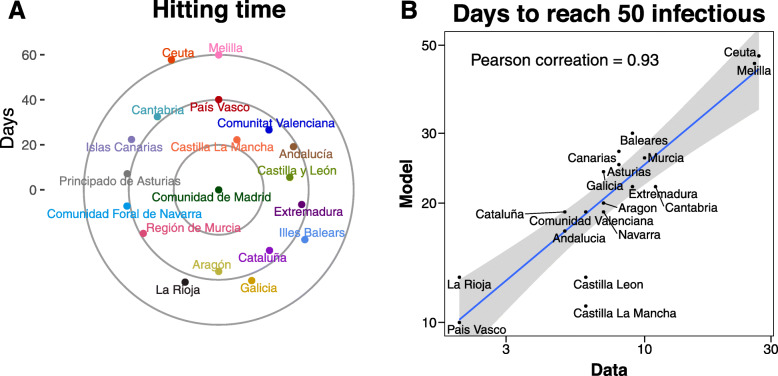
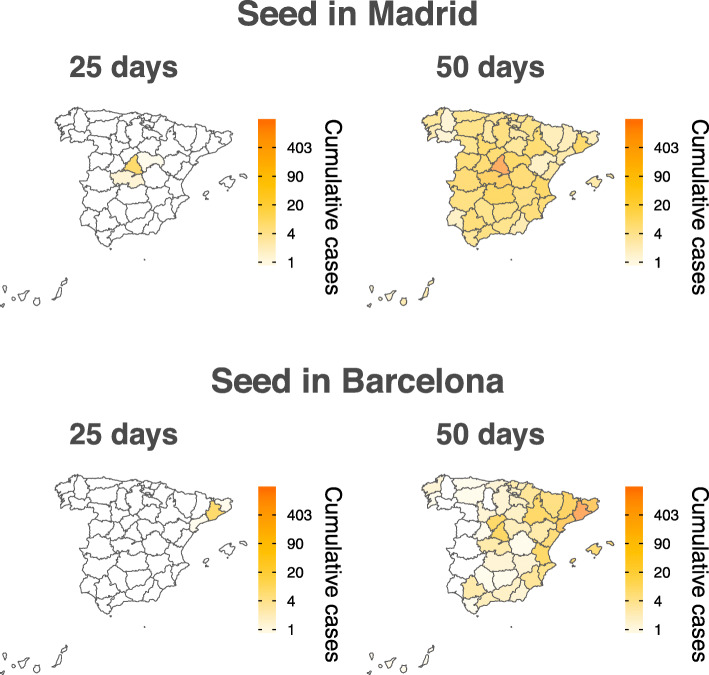
Methods: To facilitate this task, we have studied the effect of different containment strategies that can be put into effect. Our work referred initially to the situation in Spain as of February 28, 2020, where a few dozens of cases had been detected, but has been updated to match the current situation as of 13 April. We implemented an SEIR metapopulation model that allows tracing explicitly the spatial spread of the disease through data-driven stochastic simulations.

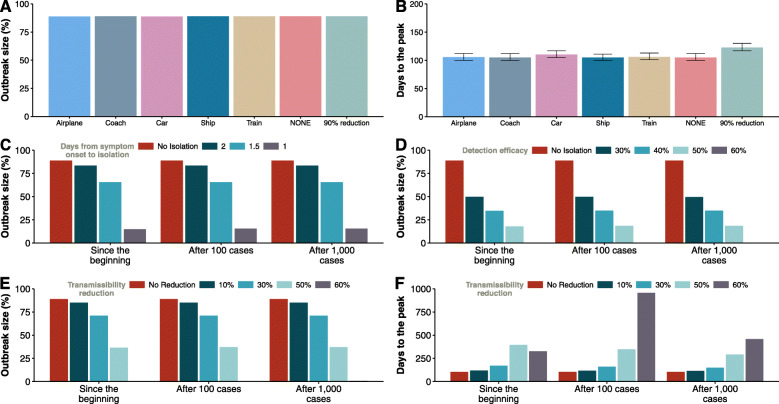
Results: Our results are in line with the most recent recommendations from the World Health Organization, namely, that the best strategy is the early detection and isolation of individuals with symptoms, followed by interventions and public recommendations aimed at reducing the transmissibility of the disease, which, although might not be sufficient for disease eradication, would produce as a second order effect a delay of several days in the raise of the number of infected cases.

Conclusions: Many quantitative aspects of the natural history of the disease are still unknown, such as the amount of possible asymptomatic spreading or the role of age in both the susceptibility and mortality of the disease. However, preparedness plans and mitigation interventions should be ready for quick and efficacious deployment globally. The scenarios evaluated here through data-driven simulations indicate that measures aimed at reducing individuals' flow are much less effective than others intended for early case identification and isolation. Therefore, resources should be directed towards detecting as many and as fast as possible the new cases and isolate them.

Keywords: COVID-19; Disease spreading; Metapopulation dynamics.


Conflict of interest statement

The authors declare that they have no competing interests.

Figures

Fig. 1
Fig. 1
Mobility dynamics in Spain. We use a dataset that includes all possible transportation means, from airplanes to cars. a, b The international fluxes to Spain. c A breakdown of inter-province flows in Spain by transportation mode. The size of the nodes is proportional to the number of individuals leaving the province. Similarly, the width of the links is proportional to the number of individuals using that route. Note that for multimodal travels, the associated mode is the one that corresponds to the largest part of the trip, which explains why there are links from the islands to provinces without ports in the matrix corresponding to maritime trips
Fig. 2
Fig. 2
International connections. The number of operations (both passengers and cargo) in 2019 from any airport in China, South Korea, and Italy to each Spanish airport. Only Madrid and Barcelona have direct passenger connections to China and South Korea, whereas Zaragoza only has freight connections to such locations. The destination provinces are ranked according to the likelihood of receiving an infected individual from each country, assuming the order is proportional to the total number of operations
Fig. 3
Fig. 3
Hitting time in SIR and SEIR models. Comparison between the hitting time obtained after 103 simulations of the SEIR model in our metapopulation scheme, with 1 or 10 seeds initially placed in the province of Barcelona, and the theoretical distance in an SIR metapopulation model
Fig. 4
Fig. 4
Temporal spreading of the epidemic. In a, we show the hitting time obtained when one seed is introduced in Madrid. In b, we compare the number of days needed to reach 50 infectious individuals since that number is reached in Madrid. The simulations are seeded with 5 individuals in Madrid, 1 in La Rioja, and 1 in Álava (País Vasco)
Fig. 5
Fig. 5
Spatial spreading of the epidemic. Estimated cumulative number of infected individuals within each region when the disease starts with 1 infected individual in Madrid (top row) or in Barcelona (bottom row). The reported values are the median over 103 simulations
Fig. 6
Fig. 6
Strategies to mitigate the impact of the disease. a, b The impact of mobility reduction. cf The effect of different measures aimed at reducing the spreading of the epidemic when they are applied since the beginning of the outbreak and after 100 or 1000 cases are detected in the whole country. a The fraction of individuals who where affected by the disease by the end of the epidemic. b The time from the arrival of the first infected individual to the country until the peak of the epidemic, i.e., the day with the maximum number of infected individuals. In c, we evaluate the size of the epidemic if individuals are hospitalized or isolated after a given number of days from the onset of disease symptoms. In d, we show the effect of only hospitalizing or isolating a certain fraction of individuals after they experience the first symptoms. In e, f, we show the size of the epidemic and the time for the disease to peak when transmission is reduced. Note that reducing the transmissibility always delays the spreading, except in situations where the disease dies out, for which the peak occurs earlier. In all cases, the spreading starts with 10 infected individuals in Barcelona

References

    1. Coronavirus disease 2019 (COVID-19) Situation Report-40. Technical report: World Health Organization; 2020. https://www.who.int/docs/default-source/coronaviruse/situation-reports/2....
    1. Coronavirus disease 2019 (COVID-19) Situation Report-84. Technical report: World Health Organization; 2020. https://www.who.int/docs/default-source/coronaviruse/situation-reports/2....
    1. Gostic K, Gomez ACR, Mummah RO, Kucharski AJ, Lloyd-Smith JO. Estimated effectiveness of symptom and risk screening to prevent the spread of COVID-19. eLife. 2020. 10.7554/eLife.55570. - PMC - PubMed
    1. Du Zhanwei, Wang Lin, Cauchemez Simon, Xu Xiaoke, Wang Xianwen, Cowling Benjamin J., Meyers Lauren Ancel. Risk for Transportation of Coronavirus Disease from Wuhan to Other Cities in China. Emerging Infectious Diseases. 2020;26(5):1049–1052. doi: 10.3201/eid2605.200146. - DOI - PMC - PubMed
    1. Chinazzi M, Davis JT, Ajelli M, Gioannini C, Litvinova M, Merler S, Pastore y.Piontti A, Mu K, Rossi L, Sun K, Viboud C, Xiong X, Yu H, Halloran ME, Longini IM, Vespignani A. The effect of travel restrictions on the spread of the 2019 novel coronavirus (COVID-19) outbreak. Science. 2020:9757. 10.1126/science.aba9757. - PMC - PubMed

LinkOut - more resources