. 2020 Jul 1;40(27):5177-5195.
doi: 10.1523/JNEUROSCI.0471-20.2020. Epub 2020 May 26.

Mouse Retinal Cell Atlas: Molecular Identification of over Sixty Amacrine Cell Types

Affiliations

Mouse Retinal Cell Atlas: Molecular Identification of over Sixty Amacrine Cell Types

Wenjun Yan et al. J Neurosci. .

Abstract

Amacrine cells (ACs) are a diverse class of interneurons that modulate input from photoreceptors to retinal ganglion cells (RGCs), rendering each RGC type selectively sensitive to particular visual features, which are then relayed to the brain. While many AC types have been identified morphologically and physiologically, they have not been comprehensively classified or molecularly characterized. We used high-throughput single-cell RNA sequencing to profile >32,000 ACs from mice of both sexes and applied computational methods to identify 63 AC types. We identified molecular markers for each type and used them to characterize the morphology of multiple types. We show that they include nearly all previously known AC types as well as many that had not been described. Consistent with previous studies, most of the AC types expressed markers for the canonical inhibitory neurotransmitters GABA or glycine, but several expressed neither or both. In addition, many expressed one or more neuropeptides, and two expressed glutamatergic markers. We also explored transcriptomic relationships among AC types and identified transcription factors expressed by individual or multiple closely related types. Noteworthy among these were Meis2 and Tcf4, expressed by most GABAergic and most glycinergic types, respectively. Together, these results provide a foundation for developmental and functional studies of ACs, as well as means for genetically accessing them. Along with previous molecular, physiological, and morphologic analyses, they establish the existence of at least 130 neuronal types and nearly 140 cell types in the mouse retina.SIGNIFICANCE STATEMENT The mouse retina is a leading model for analyzing the development, structure, function, and pathology of neural circuits. A complete molecular atlas of retinal cell types provides an important foundation for these studies. We used high-throughput single-cell RNA sequencing to characterize the most heterogeneous class of retinal interneurons, amacrine cells, identifying 63 distinct types. The atlas includes types identified previously as well as many novel types. We provide evidence for the use of multiple neurotransmitters and neuropeptides, and identify transcription factors expressed by groups of closely related types. Combining these results with those obtained previously, we proposed that the mouse retina contains ∼130 neuronal types and is therefore comparable in complexity to other regions of the brain.

Keywords: GABA; Meis2; RNA-seq; TCF4; glycine; neuropeptide.


Figures

Figure 1.
Figure 1.
Single-cell transcriptomes of mouse amacrine cells. A, Sketch of a retinal cross section showing cell classes and layers (adapted from Tran et al., 2019). ACs (purple) are interneurons that synapse with rod bipolar cells, other ACs, and RGCs. B, ACs have diverse dendritic morphologies, as illustrated by the lamination patterns of previously defined AC types. INL, Inner nuclear layer; GCL, ganglion cell layer. IPL sublaminae represented as S1–5. C, Expression patterns of a subset of marker genes used to allocate retinal cells to classes. Plot shows transcript count per cell of a randomly downsampled subset of all cells. Color bars indicate cell class. Astro, Astrocyte; Endo, endothelium; Peri, pericyte. D, Fraction of cells in each cell class, as determined by the expression of canonical markers in C. E, UMAP visualization of 63 AC clusters numbered in order of abundance. F, Relative frequencies of AC clusters, expressed as a percentage of 32,523 AC cells profiled. Clusters are numbered in order of decreasing frequency.
Figure 2.
Figure 2.
No additional AC types were detected in two other datasets. A, Comparison of AC clusters using cells obtained with selective depletion of other cell classes (this study) or without selection (Macosko et al., 2015). Transcriptional correspondence is depicted as a matrix in which circle diameter and color indicate the percentage of cells in a given AC type from the new data (x-axis) that are assigned to a particular type from Macosko et al. (2015; y-axis) by a classification algorithm (xgBoost) trained on the P19 data. For the y-axis, clusters were ordered by the degree of match to a single P19 cluster. While some AC types were not represented in the study by Macosko et al. (2015), due to lower sampling, all types detected by Macosko et al. (2015) were represented in the new dataset, suggesting selective depletion did not remove any AC types. B, Comparison of AC clusters obtained in this study with those sampled from P56 retina. While some AC types were not represented in the undersampled P56 data, all P56 types were represented in the new dataset. We renamed P56 clusters in which >50% cells mapped to single P19 clusters with their P19 counterparts' cluster ID plus “A.”
Figure 3.
Figure 3.
Molecular markers of AC types. A, Dot plots showing genes (rows) that uniquely mark AC clusters (columns). In this and subsequent dot plots, the size of each circle is proportional to the percentage of cells expressing the gene, and the color depicts the average transcript count in expressing cells, unless otherwise indicated. B, Violin plots representing the expression of Car3 in all AC types. Expression is highest in C35 (VG3 ACs) but is also substantial in C13. Violins are drawn for clusters in which transcripts were detected in >20% of cells. For clusters below this threshold, the transcript levels for Car3-expressing cells are shown by dots. C, Retinal section doubly labeled for Car3 (in situ hybridization) and VGlut3 (immunohistochemistry). VG3 ACs are Car3+. Scale bar, 20 µm. D, Violin plot showing selective expression of Cd140a in C23. E, Retinal section sparely labeled with GFP (Ptf1-cre × Cre-dependent AAV) and CD140A antibody reveals the morphology of C23 ACs. Scale bar, 40 µm.
Figure 4.
Figure 4.
Expression of cell type-specific genes in selected types of ACs at P19 and in adults. A–H, Dot plots show marker gene expression in P19 and P56 ACs for Starburst amacrine cells (C17; A), AII ACs (C3; B), A17 ACs (C6; C), SEG ACs (C4; D), C49 (E), C11 (F), C5 (G), and CAI and CAII catecholaminergic ACs (C45 and C25; H). Most markers were maintained for most types. For catecholaminergic ACs, however, levels of dopamine synthetic enzymes (Th, Ddc) and the monoamine transporter (Slc18a2) were several-fold higher in adults than at P19 in C45, suggesting that C45 is the CAI AC type. Adult cluster A14 is the closest match to the P19 C25 (Fig. 2B).
Figure 5.
Figure 5.
Evidence for multiple small molecule transmitters in ACs. A, Expression of GABAergic and glycinergic markers in ACs. Slc6a1, Slc6a13, and Slc6a11 encode GABA transporter types 1, 2, and 3, respectively. Gad1 and Gad2 encode two forms of glutamate decarboxylase. Slc6a9 and Slc6a5 encode vesicular glycine transporters 1 and 2, respectively. B, Expression of the most informative GABAergic (Gad1 and Gad2) and glycinergic (Slc6a9) markers divides ACs into the following four groups: GABAergic (43 types), glycinergic (11 types), neither (nGnGs, 4 types), and potentially dual GABAergic and glycinergic (3 types). C, Immunostaining of P22 retinas revealed sparsely populated ACs (white dot) that coexpress GABAergic (GAD65/67) and glycinergic (GLYT1) markers. Scale bar, 10 µm. D, Distinct AC clusters express glutamate transporters Slc17a7 (VGlut1; VG1 ACs) and Slc17a8 (VGlut3; VG3 ACs); none express Slc17a6 (VGlut2). E, F, Characterization of VG1 ACs, labeled in 15 VGlut1-Cre × Thy1-STP-YFP line mice and detected by immunostaining with α-GFP antibody. VG1 ACs are AP2+ (D) and VSX2 (E). Scale bars, 40 µm. G, A single cluster (C17) expresses the cholinergic markers ChAT, Slc18a3 (VAChT), and Slc5a7 (choline transporter). H, Expression of genes encoding synthetic enzymes for monoamine neurotransmitters. I, Two AC clusters express Nos1 and therefore could use NO as a transmitter.
Figure 6.
Figure 6.
Many AC types express genes encoding neuromodulatory peptides. A, Dot plot showing peptides selectively expressed by one or a few AC clusters. B, Markers that distinguish three AC types that express the neuropeptide Penk. C–E, Penk ACs were visualized by sparse viral infection using a Cre-dependent Brainbow AAV reporter (AAV9-EF1a-BbTagBy or AAV9-EF1a-BbChrT) in Penk-cre mice and immunostaining with anti-GFP antibody. Laminae are highlighted by VAChT staining in D and E; all amacrines are stained by AP2 in E. C, C35 ACs were identified by the coexpression of Penk and Ppp1r17. D, C59 ACs were Sst and Ppp1r17. E, C63 ACs were Sst+. Scale bars: C, 20 µm; D, E, 40 µm. F, Dot plot showing the expression of other neuropeptides in AC clusters.
Figure 7.
Figure 7.
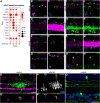
Molecular markers defining four types of nGnG ACs. A, Dot plot showing patterns of gene expression in four putative nGnG AC types (nGnGs1–4: C24, C10, C30, and C36). B, C, nGnG-1 ACs (C24) labeled by immunostaining NeuroD6-cre retinas with an antibody against Cre recombinase together with either PPP1R17 or NFIX. nGnG1 ACs coexpressed PPP1R17 but were negative for NFIX. White dashed outlines indicate CRE+ cells. Blue dashed square inset shows 2× magnification. Scale bar, 25 µm. D–H, nGnG-2 ACs (C10) labeled in the Cntn6-LacZ line and detected by immunostaining with an antibody against LACZ were negative for GLYT1 (D) and GAD65/67 (E), and coexpressed EBF3 (F) and NFIX (H), but were negative for PPP1R17 (G). I, J, nGnG-2 ACs were also labeled using the Cck-IRES-cre and detected by staining for Cre recombinase. As when labeled by the Cntn6-LacZ line, most ACs labeled with this line were PPP1R17 and NFIX+. K, nGnG-3 ACs (C30) labeled in the Cntn5-Lacz line were detected by staining for LACZ and were PPP1R17+. L–N, nGnG-4 ACs (C36) labeled in the Gbx2-CreER-GFP line and detected by immunostaining with an antibody against GFP, were GLYT1 (L) and GAD65/67 (M), but LHX9+ (N). O–Q, Dendritic lamination of nGnG ACs. O, nGnG-1 morphology revealed as PPP1R17 cells in the Neurod6-Cre line. nGnG-1 ACs were visualized by sparse viral infection using a Cre-dependent Brainbow AAV reporter (AAV9-EF1a-BbTagBy). nGnG-1 ACs (yellow asterisk) laminated S1–3, as shown by ChAT staining (S2, S4). O′ shows a 90° rotated view of the soma of the labeled AC (yellow asterisk), confirming coexpression of PPP1R17. Scale bar, 10 µm. P, nGnG-2 morphology revealed as EBF3+ cells, Mitop (a mouse line that labels nGnG-1) ACs in the Cck-IRES-cre line. nGnG-2 ACs were visualized by sparse viral infection using a Cre-dependent Brainbow AAV reporter (AAV9-EF1a-BbTagBy). nGnG-2 ACs (yellow asterisk) laminated in S1–4, as demonstrated by its positioning relative to cone bipolar type 6 axon terminals (blue asterisk), which are also labeled in this line and laminate their axon terminals in S5. O′ shows a 90° rotated view of the labeled AC's soma (yellow asterisk), confirming that the labeled AC was EBF3+, Mitop (detected by GFP staining). Scale bar, 10 µm. Q, nGnG-4 lamination pattern revealed using the Gbx2-CreER-GFP line, GFP staining showed an AC that tightly laminated in S3. Sublaminae S2 and S4, as determined by Gad65/67 staining (data not shown), are represented by dashed white lines. Scale bar, 25 µm.
Figure 8.
Figure 8.
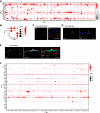
Expression of neurotransmitter and neuromodulator receptors in ACs, BCs, and RGCs. A–C, Dot plots showing selected neurotransmitter and neuromodulator receptor expression in ACs (A, red), BCs (B, dark blue; Shekhar et al., 2016), and RGCs (C, dark green; Tran et al., 2019). Some receptors were broadly expressed in most cell classes, some were selective to a certain class, and others were specific to certain types in certain classes. Expression of additional receptors in ACs is shown in Figure 9.
Figure 9.
Figure 9.
Expression of neurotransmitter and neuropeptide receptors in ACs. Dot plot showing the expression of neurotransmitter and neuropeptide receptors in ACs.
Figure 10.
Figure 10.
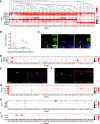
Transcription factors expressed by ACs. A, Dot plot showing row-normalized expression of selected transcription factors by AC types. Dendrogram shows transcriptional relationships among AC clusters as determined by hierarchical clustering of average gene signatures (Euclidean distance metric, average linkage). Color indicates the average normalized transcript level per cluster in expressing cells. B, Immunostaining shows that MEIS2+ ACs (dots) were largely GAD+ (detected by an anti-GAD65/67 antibody) and GlyT1 (magenta dots) in P21 mouse retina inner nuclear layer (INL), a rare population of MEIS2+ ACs, were double positive for these markers (white dots). Scale bar, 25 µm. C, The majority of TCF4+ ACs were GLYT1+, GAD (magenta dots). A subset was double negative (yellow dots) and a rare population was double positive (white dots). D, MEIS2 and TCF4 mark mutually exclusive groups of ACs. Scale bar, 25 µm. E, Quantification of fluorescent intensity of MEIS2 (x-axis) and TCF4+ (y-axis) cells in the INL at P21. Raw fluorescent intensity values were background subtracted and normalized to the maximum intensity value for each marker (225 cells scored). F, EOMES+ cells in the INL were GAD+ (magenta dot). G, The majority of NEUROD2+ cells in the INL are GLYT1+ (blue dot), and a subset is GLYT1 (yellow dots). H, EOMES+ ACs are a subset of MEIS2+ ACs. I, Quantification of fluorescence intensity of MEIS2+ (x-axis) and EOMES+ (y-axis) cells in the INL at P21 (217 cells scored). J, NEUROD2+ ACs are MEIS2. K, Quantification of fluorescence intensity of MEIS2+ (x-axis) and NEUROD2+ (y-axis) cells in the INL at P21 (222 cells scored).

References

    1. Akrouh A, Kerschensteiner D (2015) Morphology and function of three VIP-expressing amacrine cell types in the mouse retina. J Neurophysiol 114:2431–2438. 10.1152/jn.00526.2015 - DOI - PMC - PubMed
    1. Badea TC, Nathans J (2004) Quantitative analysis of neuronal morphologies in the mouse retina visualized by using a genetically directed reporter. J Comp Neurol 480:331–351. 10.1002/cne.20304 - DOI - PubMed
    1. Baden T, Berens P, Franke K, Rosón MR, Bethge M, Euler T (2016) The functional diversity of retinal ganglion cells in the mouse. Nature 529:345–350. 10.1038/nature16468 - DOI - PMC - PubMed
    1. Bae JA, Mu S, Kim JS, Turner NL, Tartavull I, Kemnitz N, Jordan CS, Norton AD, Silversmith WM, Prentki R, Sorek M, David C, Jones DL, Bland D, Sterling ALR, Park J, Briggman KL, Seung HS (2018) Digital museum of retinal ganglion cells with dense anatomy and physiology. Cell 173:1293–1306.e19. 10.1016/j.cell.2018.04.040 - DOI - PMC - PubMed
    1. Boehning D, Snyder SH (2003) Novel neural modulators. Annu Rev Neurosci 26:105–131. 10.1146/annurev.neuro.26.041002.131047 - DOI - PubMed

Publication types

MeSH terms