. 2020 Jul 8;40(28):5347-5361.
doi: 10.1523/JNEUROSCI.0250-20.2020. Epub 2020 May 26.

A Role of Low-Density Lipoprotein Receptor-Related Protein 4 (LRP4) in Astrocytic Aβ Clearance

Affiliations

A Role of Low-Density Lipoprotein Receptor-Related Protein 4 (LRP4) in Astrocytic Aβ Clearance

Hongsheng Zhang et al. J Neurosci. .

Abstract

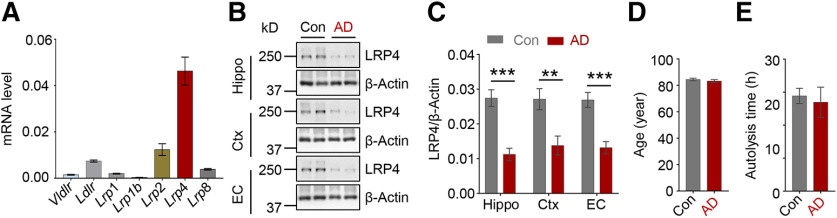
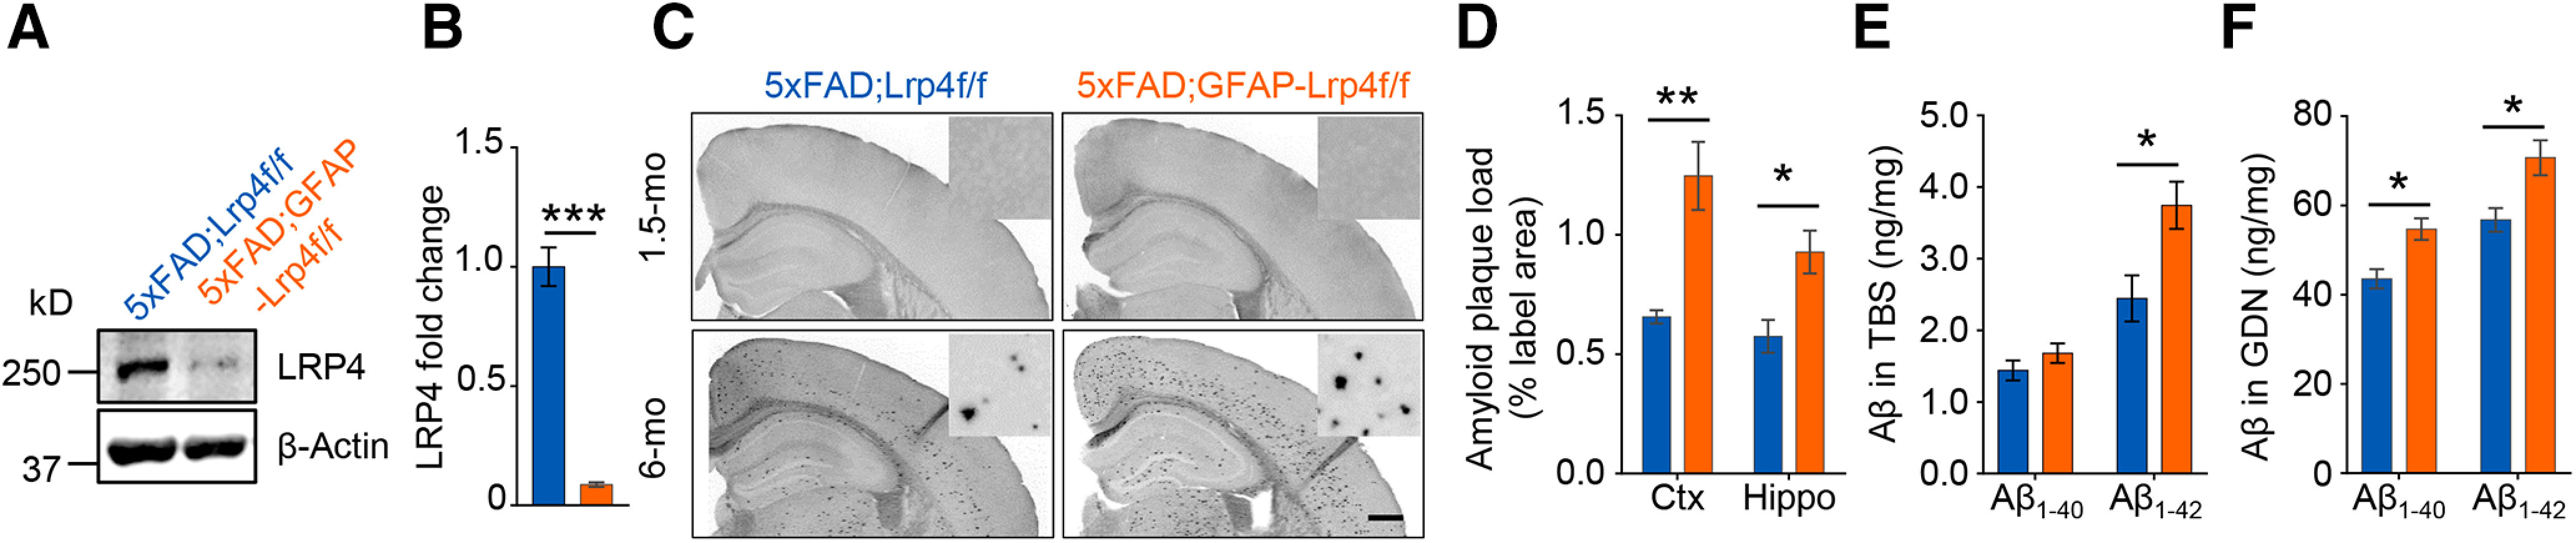
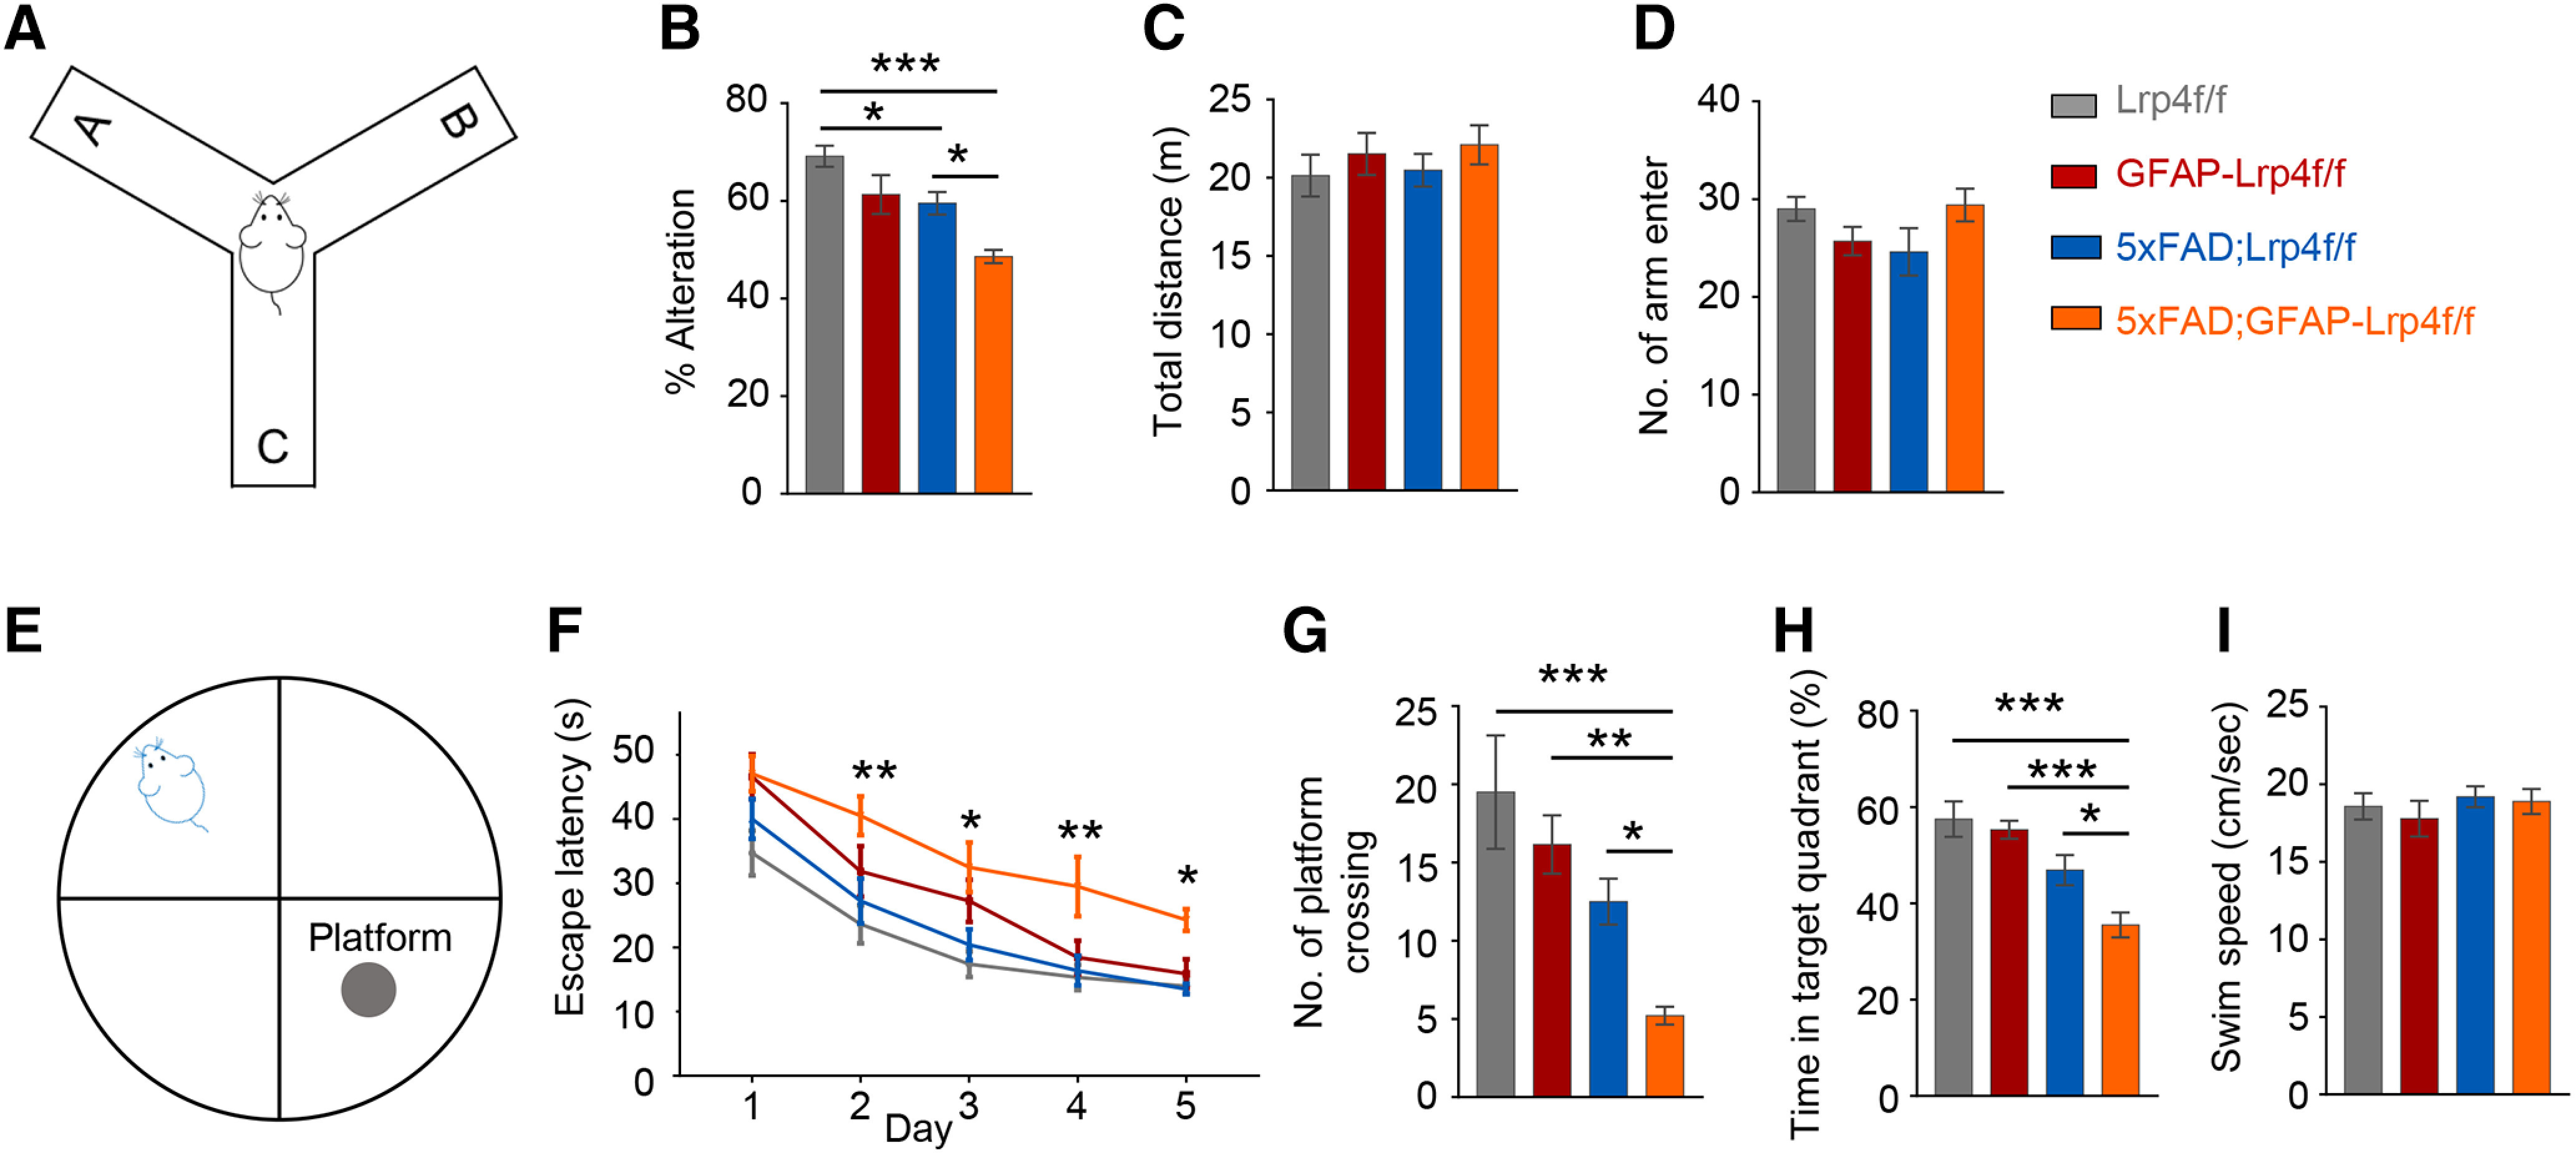
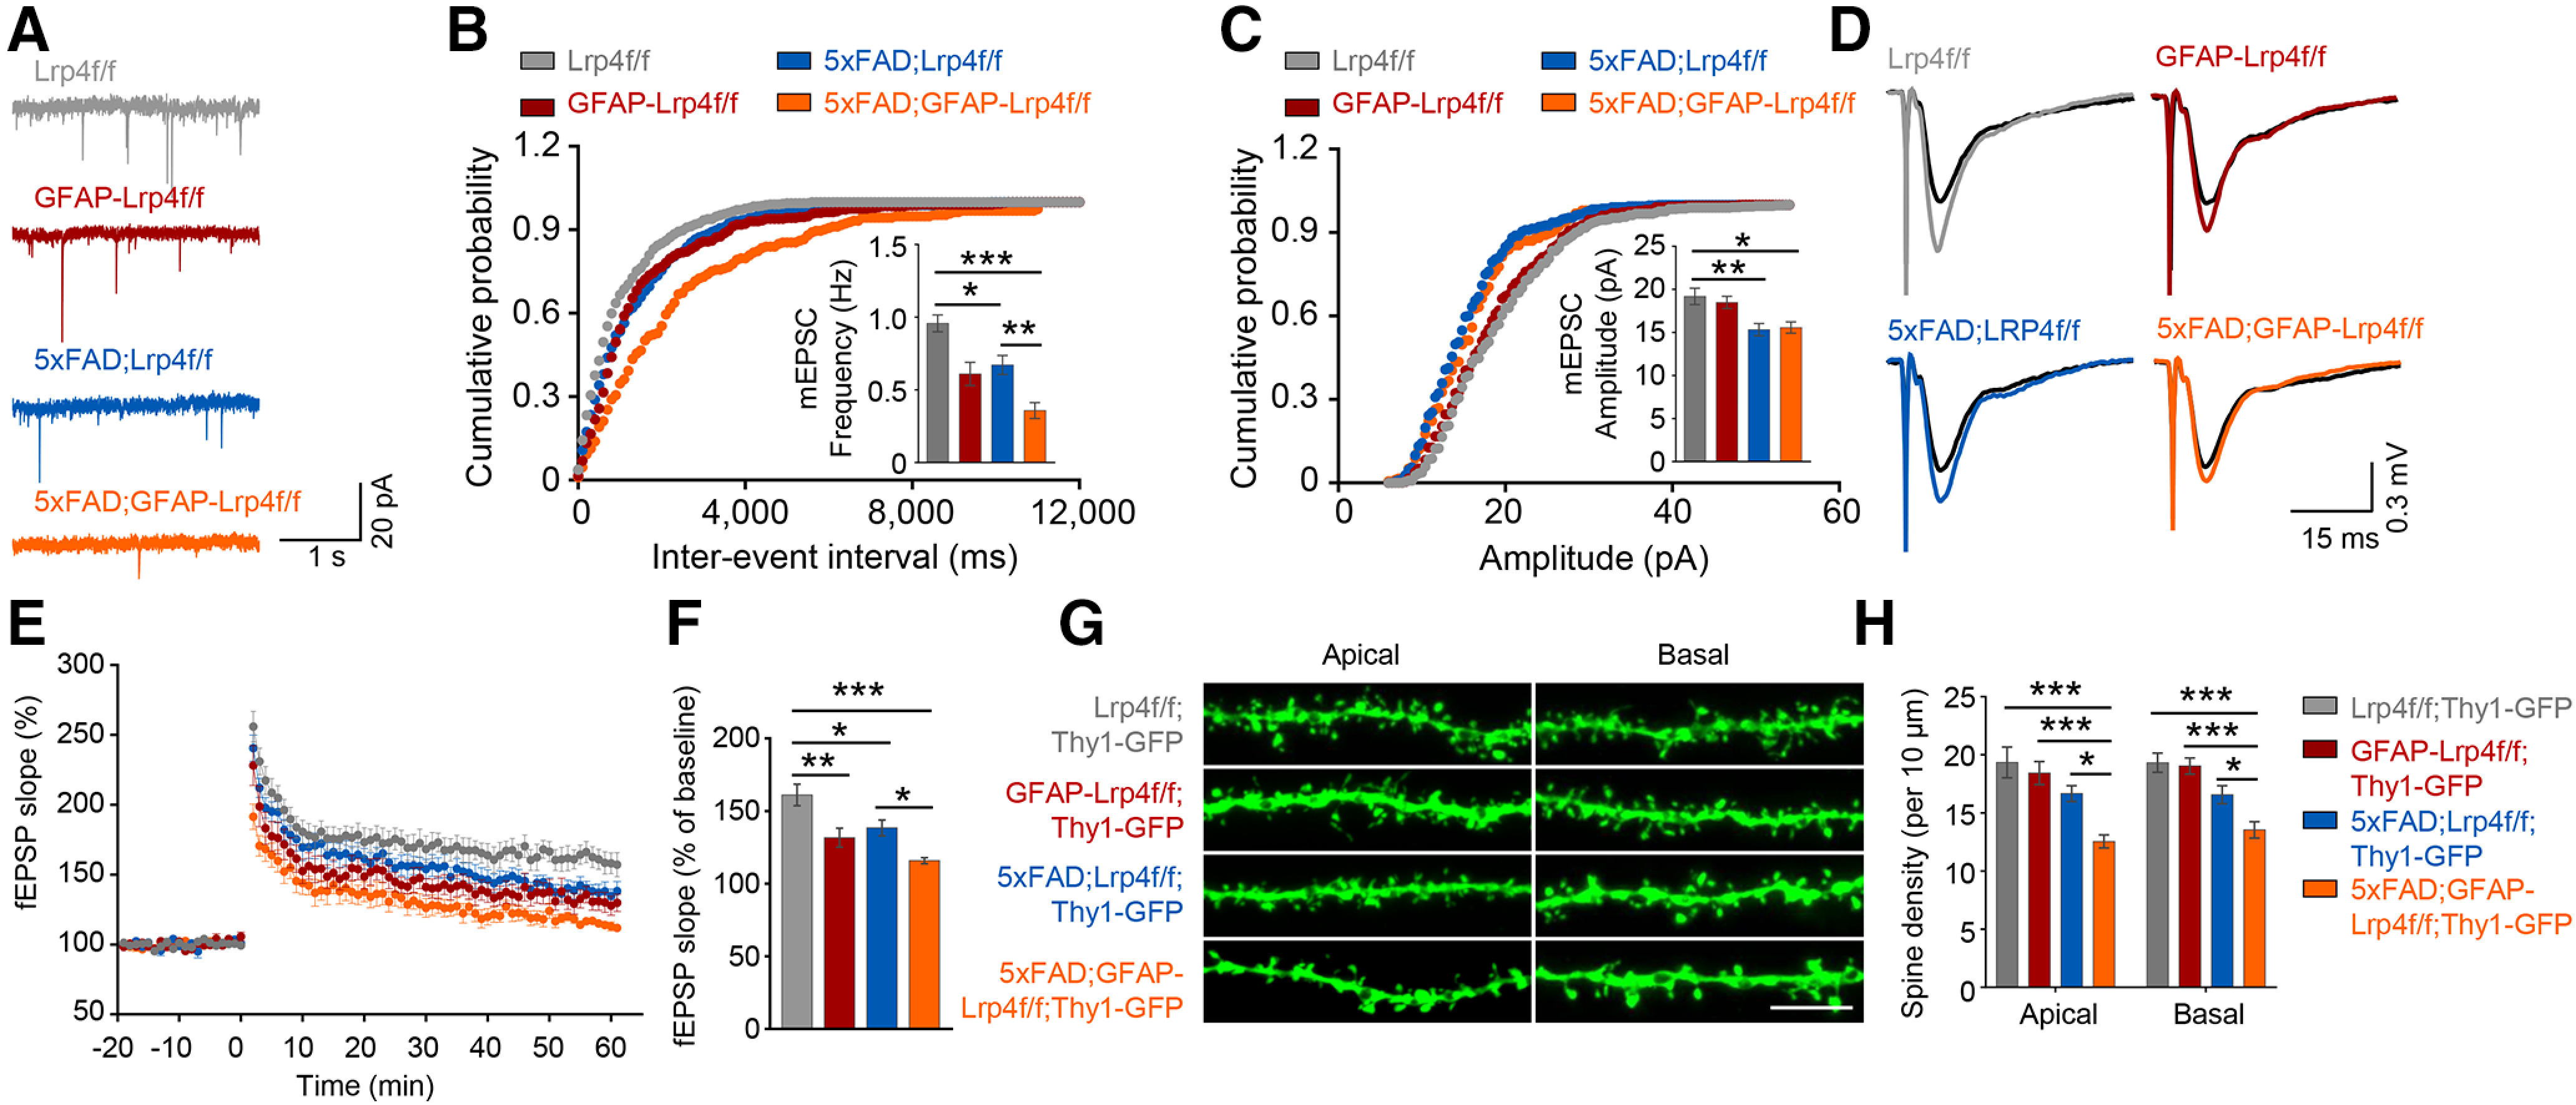
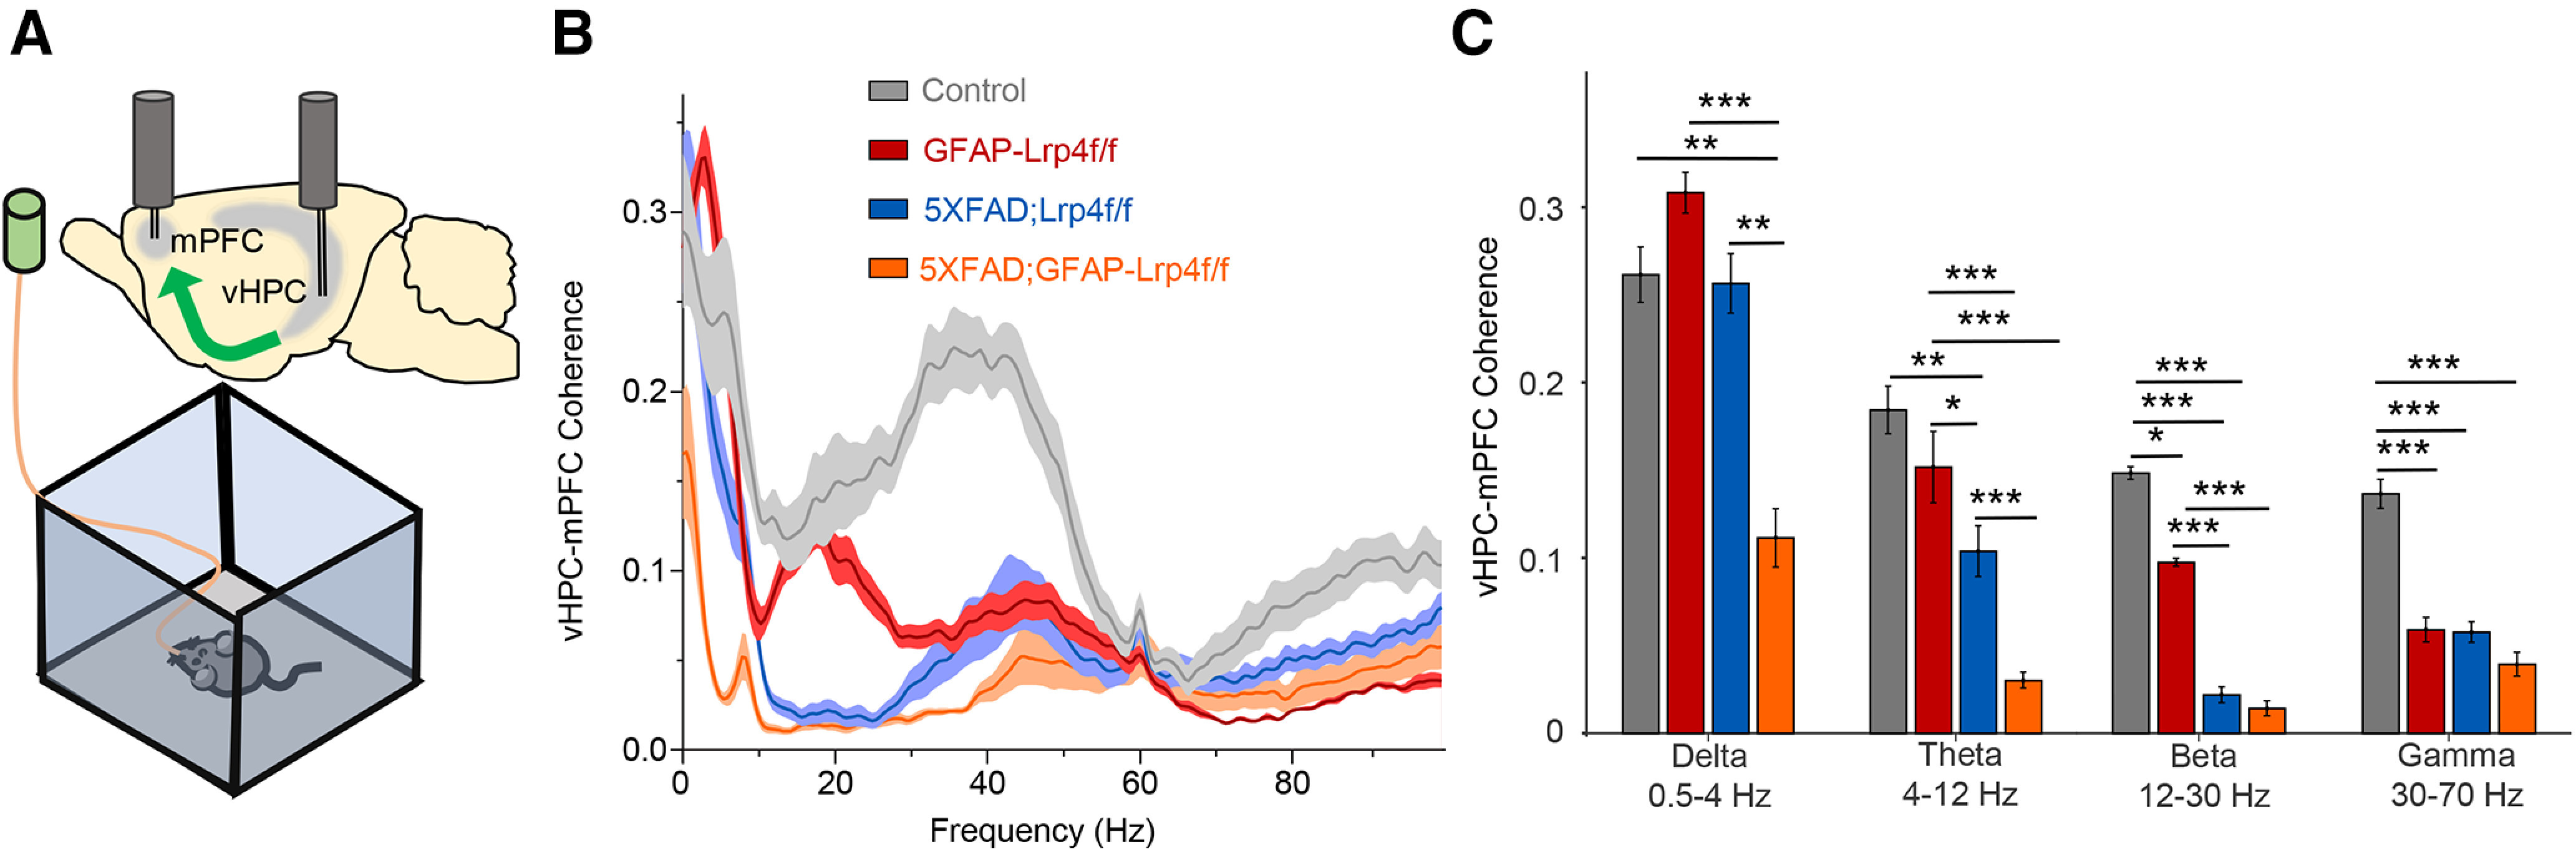
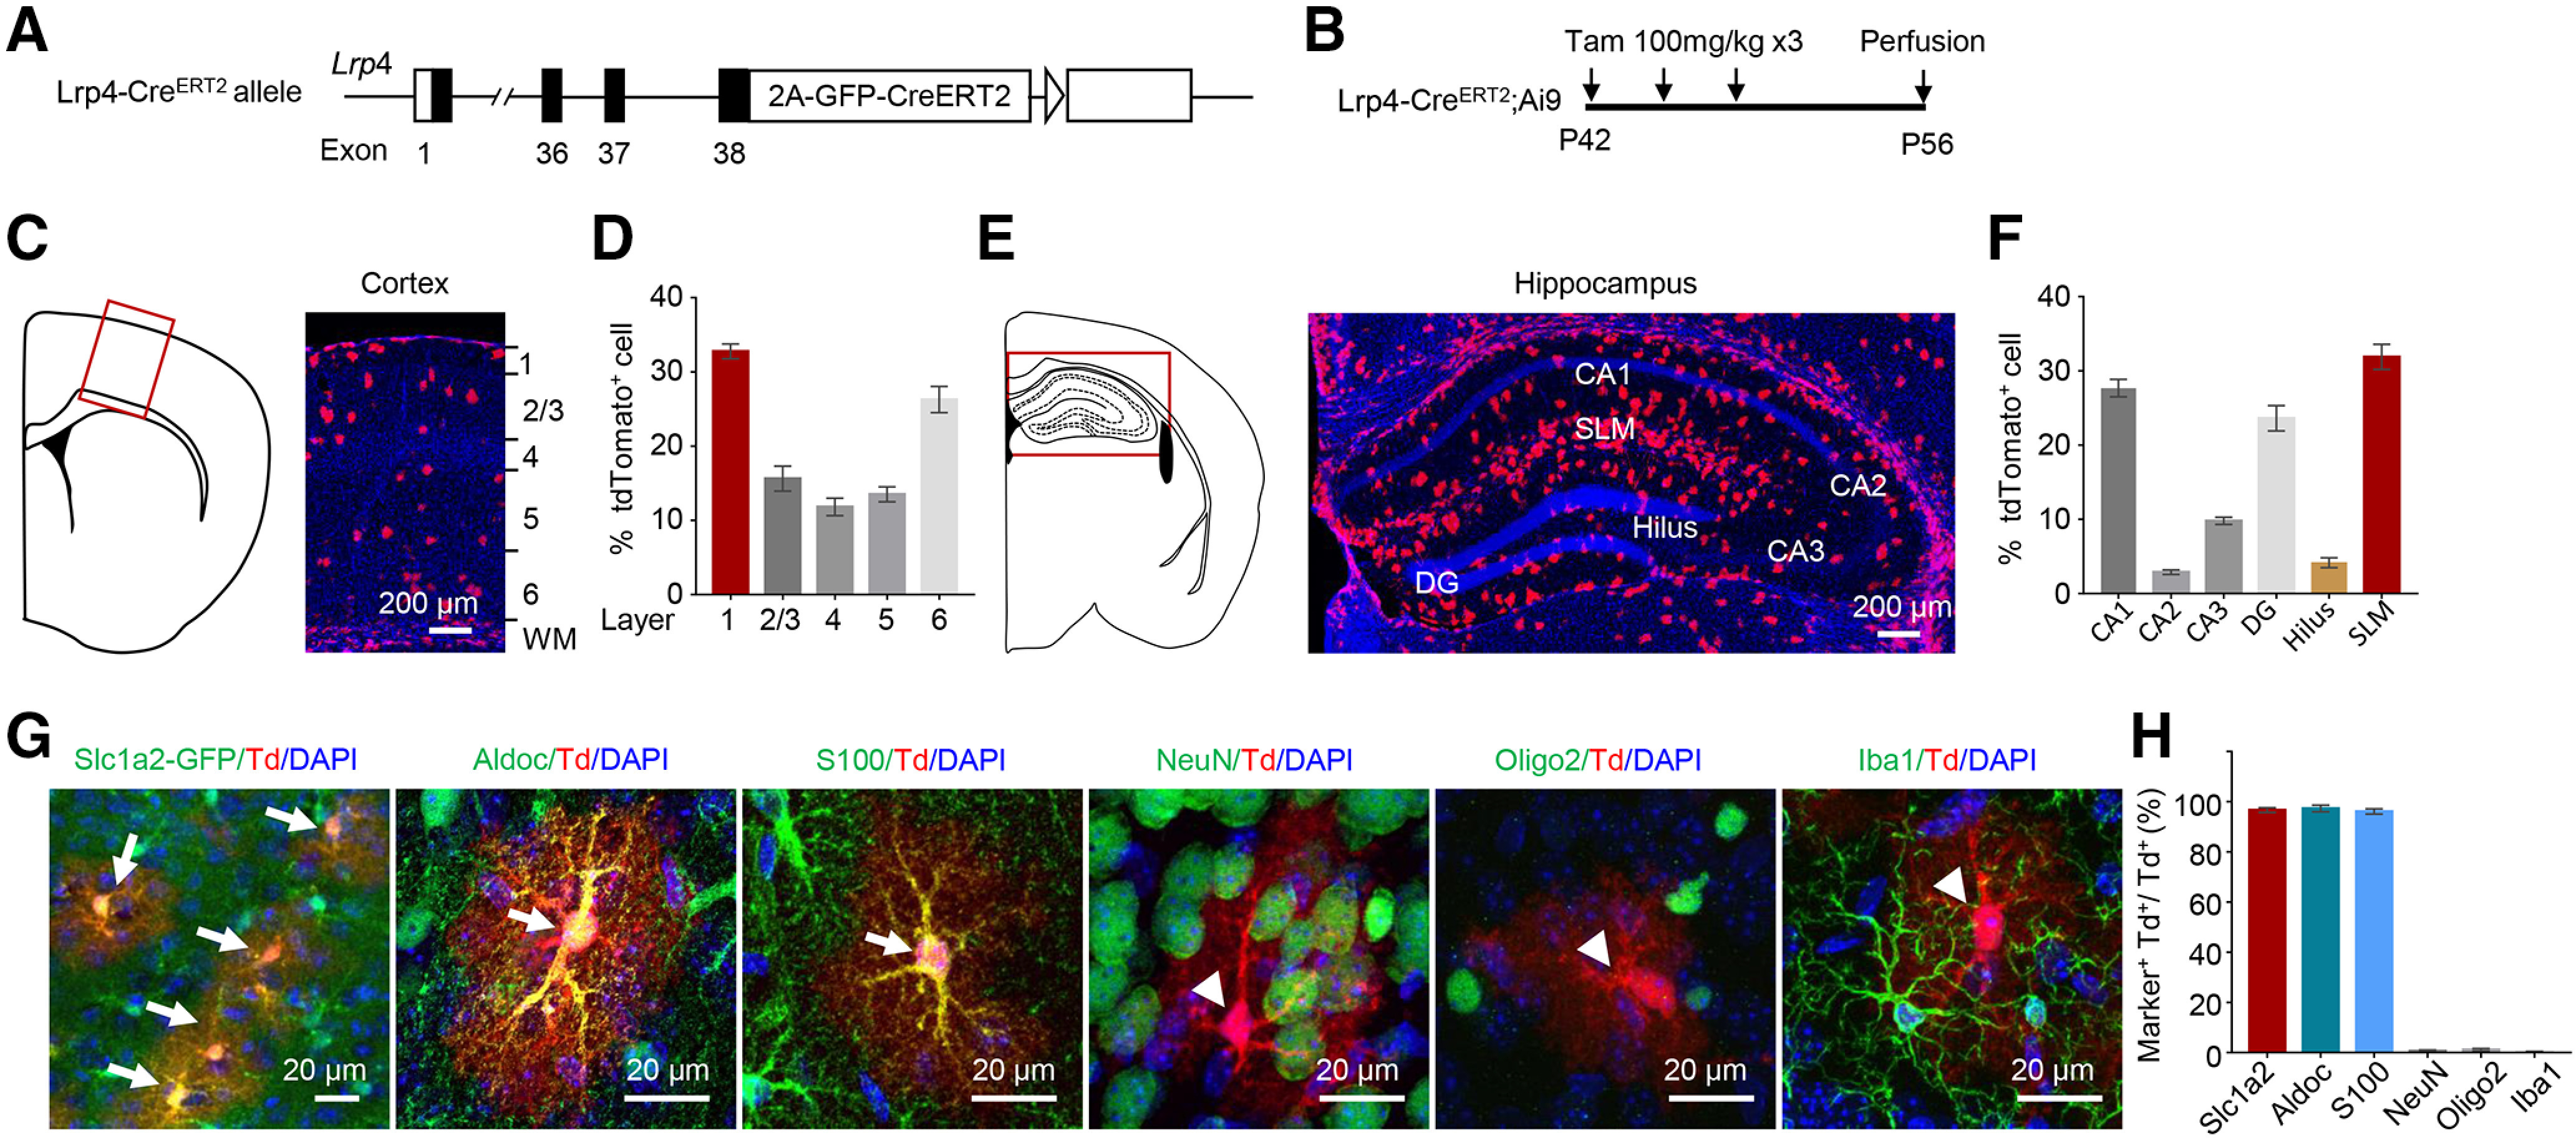
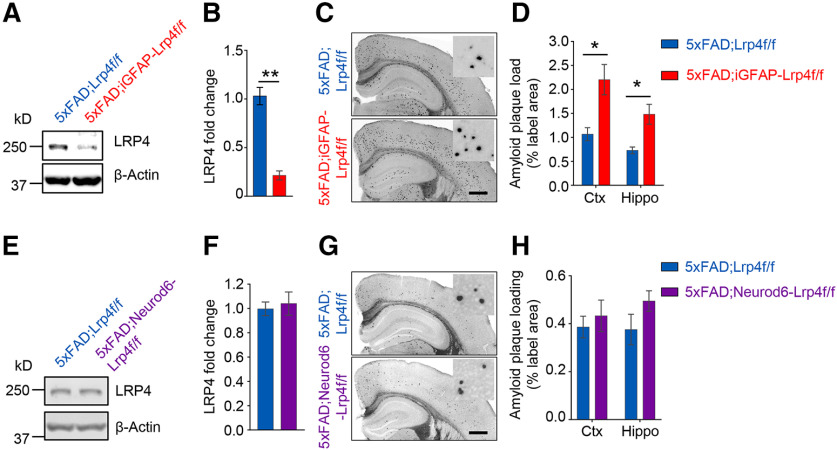
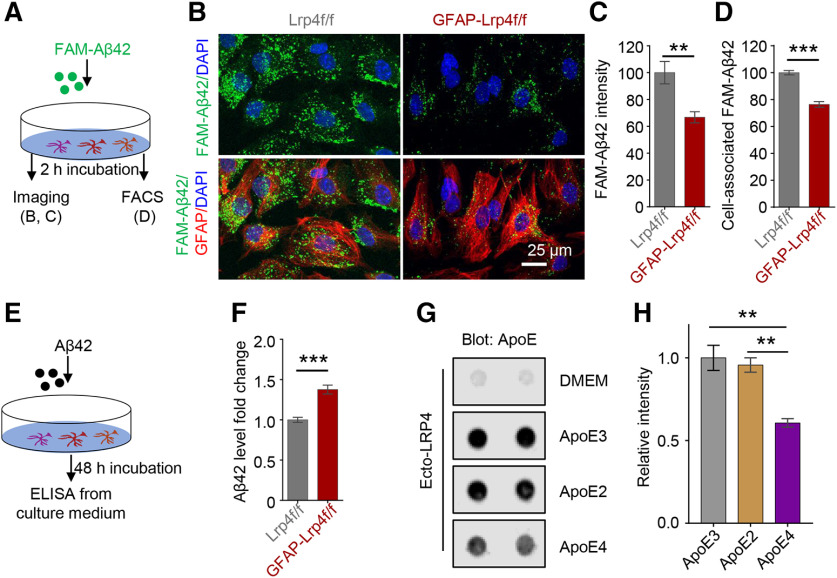
Amyloid-β (Aβ) deposition occurs years before cognitive symptoms appear and is considered a cause of Alzheimer's disease (AD). The imbalance of Aβ production and clearance leads to Aβ accumulation and Aβ deposition. Increasing evidence indicates an important role of astrocytes, the most abundant cell type among glial cells in the brain, in Aβ clearance. We explored the role of low-density lipoprotein receptor-related protein 4 (LRP4), a member of the LDLR family, in AD pathology. We show that Lrp4 is specifically expressed in astrocytes and its levels in astrocytes were higher than those of Ldlr and Lrp1, both of which have been implicated in Aβ uptake. LRP4 was reduced in postmortem brain tissues of AD patients. Genetic deletion of the Lrp4 gene augmented Aβ plaques in 5xFAD male mice, an AD mouse model, and exacerbated the deficits in neurotransmission, synchrony between the hippocampus and PFC, and cognition. Mechanistically, LRP4 promotes Aβ uptake by astrocytes likely by interacting with ApoE. Together, our study demonstrates that astrocytic LRP4 plays an important role in Aβ pathology and cognitive function.SIGNIFICANCE STATEMENT This study investigates how astrocytes, a type of non-nerve cells in the brain, may contribute to Alzheimer's disease (AD) development. We demonstrate that the low-density lipoprotein receptor-related protein 4 (LRP4) is reduced in the brain of AD patients. Mimicking the reduced levels in an AD mouse model exacerbates cognitive impairment and increases amyloid aggregates that are known to damage the brain. We show that LRP4 could promote the clearance of amyloid protein by astrocytes. Our results reveal a previously unappreciated role of LRP4 in AD development.

Keywords: Alzheimer's disease; LRP4; amyloid-β; astrocyte.


Figures

Figure 1.
Figure 1.
Reduced LRP4 protein in the AD postmortem brains. A, qPCR of LDLR core members in primary cultured astrocytes. n = 4 for each group. B, Western analysis of brain tissues from unaffected Con and AD. Three independent replicated experiments were performed. Con, controls; AD, Alzheimer's disease; Hippo, Hippocampus; Ctx, cortex; EC, entorhinal cortex. C, Quantification of LRP4/β-actin ratio. n = 9 brain samples for AD and 9 samples for control. Hippo: t(16) = 5.446, p < 0.0001; Ctx: t(16) = 3.269, p = 0.0048; EC: t(16) = 4.974, p = 0.0001, unpaired t test. D, No difference in the ages of subjects between the two groups, n = 9 for each group, t(16) = 0.8205, p = 0.424, unpaired t test. E, No difference in autolysis time. n = 9 for each group, t(16) = 0.3709, p = 0.7156, unpaired t test. Data are mean ± SEM. **p < 0.01,. ***p < 0.001.
Figure 2.
Figure 2.
Exacerbated Aβ pathology in LRP4 deficiency 5xFAD mice. A, Reduced LRP4 protein in 5xFAD;GFAP-Lrp4f/f mice compared with 5xFAD;Lrp4f/f. B, Quantitative data in A. n = 3 for each group. t(4) = 11.2, p = 0.0004, unpaired t test. C, D, Increased Aβ deposition in 6-mo 5xFAD;GFAP-Lrp4f/f mice cortex and hippocampus, compared with 5xFAD;Lrp4f/f. Scale bar, 500 µm. Representative images (C) and quantification of area covered by Aβ plaque (D). n = 4 for each group. Ctx: t(6) = 4.061, p = 0.0066; Hippo: t(6) = 3.121, p = 0.0205, unpaired t test mo, month old. E, Increased TBS-soluble Aβ1-42 in 6-mo 5xFAD;GFAP-Lrp4f/f mice brain, compared with 5xFAD;Lrp4f/f. n = 4 for each group. Aβ1-40: t(6) = 1.231, p = 0.2642; Aβ1-42: t(6) = 2.822, p = 0.0303, unpaired t test. F, Increased GDN-soluble Aβ1-40 and Aβ1-42 levels in 6-mo 5xFAD;GFAP-Lrp4f/f mice brain, compared with 5xFAD;Lrp4f/f. n = 4 for each group. Aβ1-40: t(6) = 3.455, p = 0.0135; Aβ1-42: t(6) = 2.557, p = 0.0431, unpaired t test. Data are mean ± SEM. *p < 0.05, **p < 0.01, ***p < 0.001.
Figure 3.
Figure 3.
Precipitated cognitive deficits in Lrp4 mutant 5xFAD mice. A, Spatial working memory of Lrp4f/f (n = 13), GFAP-Lrp4f/f (n = 10), 5xFAD;Lrp4f/f (n = 10), and 5xFAD;GFAP-Lrp4f/f (n = 10) was assessed by spontaneous alternation in the Y maze. B, 5xFAD;GFAP-Lrp4f/f further reduced the spontaneous alternation compared with 5xFAD;Lrp4f/f at 6 months: F(3,39) = 11.21, p < 0.0001, ANOVA. C, The total distance explored in the Y maze was not different between the four groups: F(3,39) = 0.5198, p = 0.6711, ANOVA. D, The total number of arm entries was not different in the four groups: F(3,39) = 1.947, p = 0.1380, ANOVA. E, Spatial learning and memory of Lrp4f/f (n = 10), GFAP-Lrp4f/f (n = 13), 5xFAD;Lrp4f/f (n = 15), and 5xFAD;GFAP-Lrp4f/f (n = 12) was assessed in water maze. F-H, Six-mo 5xFAD;GFAP-Lrp4f/f exhibited increase the latency to the hidden platform (F), F(3,230) = 19.6, p < 0.0001, ANOVA; decrease the number of platform crossing (G), F(3,46) = 8.852, p< 0.0001, ANOVA; reduce the time in the target quadrant (H), F(3,46) = 11.35, p < 0.0001, ANOVA, compared with Lrp4f/f and 5xFAD;Lrp4f/f groups. I, Four groups of mice showed similar swim speed in the water maze: F(3,46) = 0.5068, p = 0.6795, ANOVA. Data are mean ± SEM. *p < 0.05, **p < 0.01, ***p < 0.001.
Figure 4.
Figure 4.
LRP4 deficiency further reduced mEPSC frequency, LTP, and spine density of 6-mo 5xFAD mice. A, Representative mEPSC traces. B, Cumulative distributions of mEPSC frequency, F(3,31) = 13.59, p < 0.0001, ANOVA. C, Cumulative distributions of mEPSC amplitude. Data are summarized in histograms. Data were from 3 mice of each genotype with 2 or 3 neurons per mouse, F(3,31) = 6.792, p = 0.0012, ANOVA. D, Representative fEPSP traces. E, The plot of fEPSP slope against time. F, Quantitative data in E. Shown were potentiation at 50-60 min after high-frequency stimulation. Data were from 4 mice of each genotype and >2 slices per mouse, F(3,29) = 10.41, p < 0.0001, ANOVA. G, Representative basal and apical dendritic spine. H, Quantitative data. The dendritic spine was collected from 4 mice of each genotype and >5 neurons per mouse: apical: F(3,78) = 11.78, p < 0.0001, ANOVA; basal: F(3,81) = 13.33, p < 0.0001, ANOVA. Data are mean ± SEM. *p < 0.05, **p < 0.01, ***p < 0.001.
Figure 5.
Figure 5.
A further disconnect of the vHPC-PFC by Lrp4 mutation in 5xFAD mice. A, Schematic diagram of in vivo recording. Two tetrodes were implanted in vHPC and PFC, respectively. LFPs were recorded in free-moving 6-mo mice in an open field. B, Coherence between vHPC and PFC LFPs of Lrp4f/f (n = 10), GFAP-Lrp4f/f (n = 9), 5xFAD;Lrp4f/f (n = 14), and 5xFDA;GFAP-Lrp4f/f (n = 11) mice. C, vHPC-PFC synchrony at different frequencies: Delta, F(3,40) = 8.389, p = 0.0002, ANOVA; Theta, F(3,40) = 14.84, p < 0.0001, ANOVA; Beta, F(3,40) = 35.28, p < 0.0001, ANOVA; Gamma, F(3,40) = 15.76, p < 0.0001, ANOVA. Data are mean ± SEM. *p < 0.05, **p < 0.01, ***p < 0.001.
Figure 6.
Figure 6.
Lrp4 is mainly expressed in astrocytes, not neurons, oligodendrocytes, or microglia. A, Knock-in of the 2A-CreERT2 cassette in exon 38 of the Lrp4 allele. B, The protocol of Tam administration. Lrp4-CreERT2;Ai9 mice at P42 were treated with Tam (100 mg/kg, i.p., three times, once every other day) and killed at P56. Shown are brain sections of the cortex (C,D), hippocampus (E,F), and enlarged views of cortical cells costained with the different maker (G), except that the Slc1a2+ cells are labeled by Slc1a2-GFP (in Slc1a2-GFP; Lrp4-CreERT2;Ai9 mice). tdTomato+ cell costained with astrocytes marker Aldoc and S100β (arrow), but not the with NeuN, Oligo2, and Iba1 (arrowhead). Scale bar, 20 µm. H, Quantification of double-positive cells. n = 3 for each group. Td, tdTomato. Data are mean ± SEM.
Figure 7.
Figure 7.
Augmented Aβ deposition in astrocyte-specific Lrp4 KO 5xFAD mice. A, B, LRP4 protein was reduced in the brain of Tam-treated 5xFAD;iGFAP-Lrp4f/f mice, compared with Tam-treated 5xFAD;Lrp4f/f mice. Representative images (A) and quantification (B). n = 3 for each group, t(4) = 8.121, p = 0.0013, unpaired t test. C, D, Increase of Aβ deposition in Tam-treated 5xFAD;iGFAP-Lrp4f/f mice, compared with Tam-treated 5xFAD;Lrp4f/f mice at 7 months. Representative images (C) and quantification (D). Scale bar: C, 500 µm. n = 4 for each group: Ctx, t(6) = 3.312, p = 0.0162, unpaired t test; Hippo, t(6) = 3.433, p = 0.0139, unpaired t test. E, F, LRP4 protein level is similar between 5xFAD;Lrp4f/f and 5xFAD;Neurod6-Lrp4f/f brain. Representative images (E) and quantification (F). n = 3 for each group, t(4) = 0.5513, p = 0.6108, unpaired t test. G, H, Similar Aβ deposition in 5xFAD;Lrp4f/f and 5xFAD;Neurod6-Lrp4f/f mice at 6 months. Representative images (G) and quantification (H). Scale bar. G, 500 μm. n = 3 for each group: Ctx, t(4) = 0.5835, p = 0.5909, unpaired t test; Hippo, t(4) = 1.546, p = 0.1971, unpaired t test. Data are mean ± SEM. *p < 0.05, **p < 0.001.
Figure 8.
Figure 8.
No effect on Aβ production by Lrp4 mutation in 5xFAD mice. A, qPCR analysis of App and genes involved in its processing in 5xFAD;Lrp4f/f and 5xFAD;GFAP-Lrp4f/f mice at 1.5 months in the hippocampus. n = 3 for each group: App, t(4) = 0.3824, p = 0.7216; Bace1, t(4) = 0.3053, p = 0.7754; Bace2, t(4) = 1.109, p = 0.3296; Psen1, t(4) = 0.3639, p = 0.7343; Psen2, t(4) = 0.1852, p = 0.8621; APP, t(4) = 0.8909, p = 0.4233; PSEN1, t(4) = 0.3018, p = 0.7778, unpaired t test. B, Illustration of human APP structure and its cleavage sites. The indication of the epitopes for the antibodies 6E10 and 8717 and the cleavage fragments CTFβ and CTFα. C, Western blot analysis of APP-FL, βCTF, and αCTF levels using the indicated antibodies. Homogenates of cortex and hippocampus from 5xFAD;Lrp4f/f and 5xFAD;GFAP-Lrp4f/f mice at 1.5 months of age were subjected to Western blot. n = 3 for each group. Three independent replicated experiments were performed. D, Quantification of APP-FL: Ctx, t(4) = 0.0061, p = 0.9954; Hippo, t(4) = 0.9009, p = 0.4186, unpaired t test. E, Quantification of cleavage products βCTF: Ctx, t(4) = 0.2929, p = 0.7842; Hippo, t(4) = 0.8861, p = 0.4256, unpaired t test. F, Quantification of cleavage products αCTF: Ctx, t(4) = 0.8065, p = 0.4652; Hippo, t(4) = 0.9339, p = 0.4032, unpaired t test. Data are mean ± SEM. *p < 0.05.
Figure 9.
Figure 9.
Impaired Aβ uptake in Lrp4 mutated primary astrocytes. A, Experimental design. Primary astrocytes derived from P3 Lrp4f/f and GFAP-Lrp4f/f mice brain were incubated with FAM-Aβ42 for imaging (B) and FACS (D). B, Reduced FAM-Aβ42 intensity in astrocytes. Scale bar, 25 µm. C, Quantitative analysis of data in B. n = 8 for Lrp4f/f, n = 6 for GFAP-Lrp4f/f, t(12) = 3.212, p = 0.0075, unpaired t test. D, Decreased cell-associated Aβ42 in astrocyte-derived from GFAP-Lrp4f/f mice compared with astrocyte-derived from Lrp4f/f mice by FACS. n = 4 for each group, t(6) = 8.869, p = 0.0001, unpaired t test. E, F, Increased Aβ42 level in the Lrp4 mutant astrocyte medium compared with Lrp4f/f astrocytes medium, n = 8 for each group, t(14) = 5.887, p < 0.0001, unpaired t test. G, H, Reduced LRP4 interaction with the ApoE4. The nitrocellulose membrane was spotted with 500 ng of Ecto-LRP4 and incubated with different human ApoEs. ApoE was produced by mouse astrocytes that express lipidated and secrete human ApoE isoforms. Bound ApoE was detected using a biotinylated anti-ApoE antibody. Representative dot blots (G) and quantitative data (H), F(2,6) = 16.84, p = 0.0035, ANOVA. Data are mean ± SEM. **p < 0.01. ***p < 0.0001.

Comment in

References

    1. Albert MS, DeKosky ST, Dickson D, Dubois B, Feldman HH, Fox NC, Gamst A, Holtzman DM, Jagust WJ, Petersen RC, Snyder PJ, Carrillo MC, Thies B, Phelps CH (2011) The diagnosis of mild cognitive impairment due to Alzheimer's disease: recommendations from the National Institute on Aging-Alzheimer's Association workgroups on diagnostic guidelines for Alzheimer's disease. Alzheimers Dement 7:270–279. 10.1016/j.jalz.2011.03.008 - DOI - PMC - PubMed
    1. Alzheimer's Association (2019) 2019 Alzheimer's disease facts and figures. Alzheimers Dement 15:321–387.
    1. Appel JR, Ye S, Tang F, Sun D, Zhang H, Mei L, Xiong WC (2018) Increased microglial activity, impaired adult hippocampal neurogenesis, and depressive-like behavior in microglial VPS35-depleted mice. J Neurosci 38:5949–5968. 10.1523/JNEUROSCI.3621-17.2018 - DOI - PMC - PubMed
    1. Atagi Y, Liu CC, Painter MM, Chen XF, Verbeeck C, Zheng H, Li X, Rademakers R, Kang SS, Xu H, Younkin S, Das P, Fryer JD, Bu G (2015) Apolipoprotein E is a ligand for triggering receptor expressed on myeloid cells 2 (TREM2). J Biol Chem 290:26043–26050. 10.1074/jbc.M115.679043 - DOI - PMC - PubMed
    1. Barik A, Lu Y, Sathyamurthy A, Bowman A, Shen C, Li L, Xiong WC, Mei L (2014) LRP4 is critical for neuromuscular junction maintenance. J Neurosci 34:13892–13905. 10.1523/JNEUROSCI.1733-14.2014 - DOI - PMC - PubMed

Publication types

Substances