Review
. 2020 Jun;65(6):772-792.
doi: 10.4187/respcare.07425.

Esophageal Manometry

Affiliations
Review

Esophageal Manometry

Tài Pham et al. Respir Care. 2020 Jun.

Abstract

The estimation of pleural pressure with esophageal manometry has been used for decades, and it has been a fertile area of physiology research in healthy subject as well as during mechanical ventilation in patients with lung injury. However, its scarce adoption in clinical practice takes its roots from the (false) ideas that it requires expertise with years of training, that the values obtained are not reliable due to technical challenges or discrepant methods of calculation, and that measurement of esophageal pressure has not proved to benefit patient outcomes. Despites these criticisms, esophageal manometry could contribute to better monitoring, optimization, and personalization of mechanical ventilation from the acute initial phase to the weaning period. This review aims to provide a comprehensive but comprehensible guide addressing the technical aspects of esophageal catheter use, its application in different clinical situations and conditions, and an update on the state of the art with recent studies on this topic and on remaining questions and ways for improvement.

Keywords: ARDS; asynchrony; mechanical ventilation; mechanical ventilator weaning; physiologic monitoring; respiratory mechanics.


Conflict of interest statement

Dr Pham has disclosed a relationship with BetterCare. Dr Telias has disclosed relationships with the Canadian Institutes for Health Research, Covidien, and MbMed SA. Dr Beitler has disclosed no conflicts of interest.

Figures
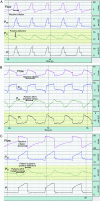
Fig. 1.
Fig. 1.
Examples of flow (pink), airway pressure (Paw blue), esophageal pressure (Pes, green), transpulmonary pressure (PL, black) in patients with different breathing conditions (passive, active, or partially active). (A) Flow, Paw, Pes, and PL waveforms in a passive patient during volume assist control ventilation. Machine inflation creates a positive deflection on the Pes tracing that comes back to baseline during exhalation. (B) Flow, Paw, Pes, and PL waveforms in a patient breathing actively and triggering all of the breaths during pressure support ventilation. The patient’s effort creates a negative swing in the Pes tracing, triggering machine inflation. (C) Flow, Paw, Pes, and PL waveforms in a patient triggering the machine but not sustaining effort. The patient’s effort creates an initial negative swing in the Pes tracing. When the patient’s effort stops during the second phase of inspiration, the patient is passive and the machine inflation creates a positive pressure transmitted to the Pes, leading to a positive deflection. During exhalation, Pes goes back to baseline.
Fig. 2.
Fig. 2.
Pressure waveforms during insertion of an esophageal catheter. Paw = airway pressure; Pes = esophageal pressure; Pg = gastric pressure; PS = pressure support. From Reference 13, with permission.
Fig. 3.
Fig. 3.
Static esophageal balloon pressure-volume curves showing the relationship between balloon filling volume and static values of esophageal pressure (Pes), both at end-expiration (circles) and at end-inspiration (squares). On the end-expiratory pressure-volume curve, the intermediate linear section was graphically detected and analyzed for its lower and upper limits (VMIN and VMAX, respectively). The range between VMIN and VMAX was considered to correspond to appropriate balloon filling, with volumes below VMIN denoting underfilling and volumes above VMAX denoting overdistention. The elastance of the esophagus (cm H2O/mL) was considered equivalent to the slope of this section of the end-expiratory pressure-volume curve. Within the appropriate filling range, we identified VBEST as the filling volume associated with the maximum difference between end-inspiratory Pes and end-expiratory Pes. From Reference 17, with permission.
Fig. 4.
Fig. 4.
Example of frequent esophageal spasm hampering esophageal pressure (Pes) monitoring. Regular spasm lasting around 4 s occur every 5 s. During spasms, Pes as high as 38 cm H2O is not representative of pleural pressure anymore and end-expiratory transpulmonary pressure (PL) falsely reads -20 cm H2O. Paw = airway pressure.
Fig. 5.
Fig. 5.
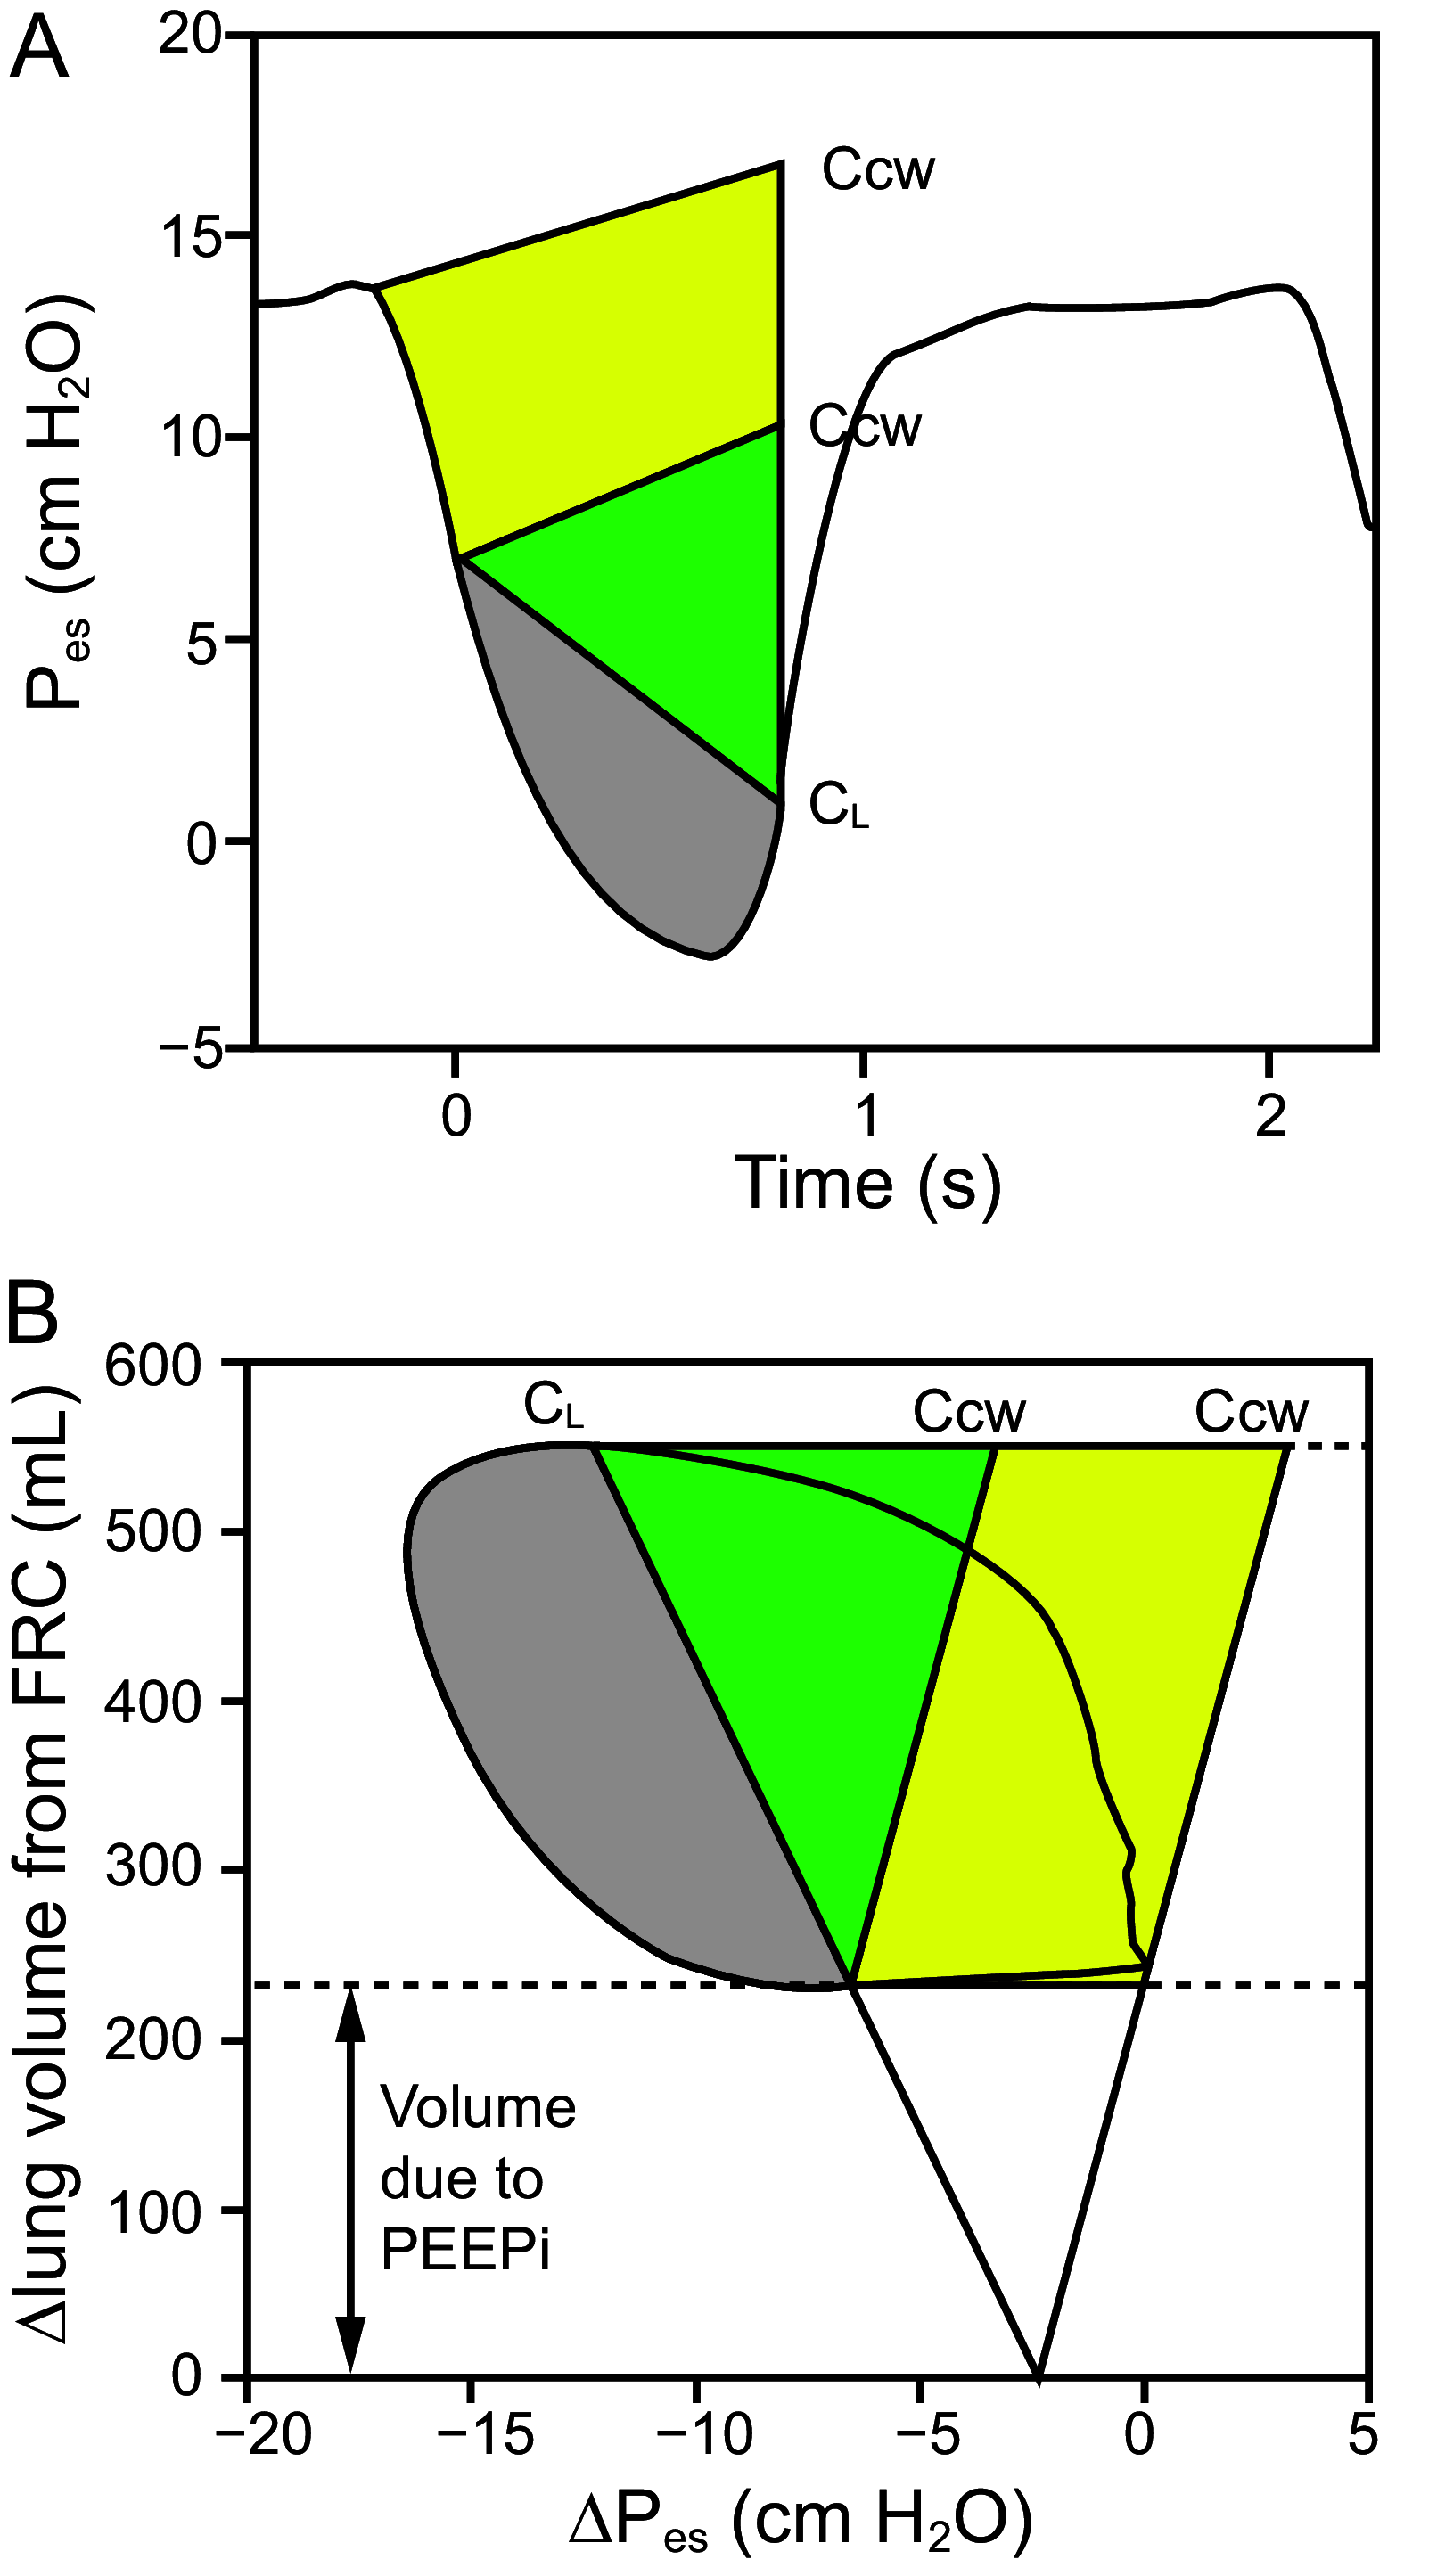
Examples of ways to assess patient effort with esophageal pressure. (A) Esophageal pressure (Pes) tracings. Ccw, estimated at 4% of vital capacity, has been superimposed on Pes at the onset of the fall in Pes and at the onset of inspiratory flow generation (ie, the first vertical line), together with dynamic CL. The colored area comprises the total pressure-time product (PTP) of respiratory muscle pressure. The yellow area is the PTP attributed to intrinsic PEEP, the green area represents elastic PTP, and the gray area represents resistive PTP. (B) Pressure-volume curve of Pes and lung volume. The Ccw and CL intersect at FRC. The yellow area represents work of breathing (WOB) attributed to intrinsic PEEP, the green area represents elastic WOB, and the gray area represents resistive WOB. Ccw = compliance of the chest wall; CL = compliance of the lung; FRC = functional residual capacity; PEEP = positive end-expiratory pressure; FRC = functional residual capacity; VC = vital capacity; PEEPi = intrinsic PEEP. Redrawn from data in reference .
Fig. 6.
Fig. 6.
Flow (pink), airway pressure (Paw, blue), and esophageal pressure (Pes, green) waveforms showing patient-ventilator dyssynchronies. (A) In pressure assist controlled mode, the machine inflation time (Ti-M) lasts longer than the patient’s neural inspiration (Ti-N), creating delayed cycling. This excess assistance causes ineffective effort in the following breath because the patient’s respiratory muscle contraction is not strong enough to trigger an inflation (ie, wasted effort). This is clearly seen on the Pes tracing, which shows a negative deflection failing to trigger a machine inflation. This can also be suggested by the concomitant bump seen on the flow tracing during the expiration phase. (B) In pressure controlled continuous mandatory ventilation mode, the Ti-M is shorter than the patient’s Ti-N, creating premature cycling. The patient’s inspiratory effort continues beyond machine inspiration and prevents the peak expiration flow usually seen when the expiration valve opens and the exhalation is passive (ie, the patient tries to get flow in while the circuit is supposed to let the flow go out). The bump in the early phase of the exhalation is also suggestive of the patient effort continuing during expiration. (C) In volume controlled continuous ventilation mode, the initial inflation is passive in all breaths, and the machine starts the inspiration phase on a time command. At the end of the inspiration phase, the patient’s effort occurs (ie, the negative swing seen on the first breath), and there is a muscle contraction continuing during the expiration. As during ineffective effort or short cycling, this can be suggested by the bump on the flow seen during expiration. This likely creates an eccentric diaphragm contraction that could be injurious. This sequence of passive inflation followed by a muscle contraction is defined as reverse triggering. Of note, the fourth breath shows the same type of asynchrony, but this reverse triggering is strong enough to trigger a second inflation and breath stacking. This type of reverse triggering with breath stacking can injure the lung by providing tidal volume as high as twice the value set on the machine.

References

    1. Luciani L. Esame comparativo dei metodi per registrare la pressione toracica e addominale. In: Delle oscillazioni della pressione intratoracica e intraddominale. Torino, Italy: Vicenzo Bona; 1877:2-18.
    1. Buytendijk HJ. Oesophagusdruk en longelasticiteit. Dissertation, University of Groningen 1949.
    1. Mead J, McIlroy MB, Selverstone NJ, Kriete BC. Measurement of intraesophageal pressure. J Appl Physiol 1955;7(5):491-495. - PubMed
    1. Mead J, Gaensler EA. Esophageal and pleural pressures in man, upright and supine. J Appl Physiol 1959;14(1):81-83. - PubMed
    1. Milic-Emili G, Petit JM. Relationship between endoesophageal and intrathoracic pressure variations in dog. J Appl Physiol 1959;14(4):535-537.

LinkOut - more resources