. 2020 May 26;11(1):2634.
doi: 10.1038/s41467-020-16278-6.

Confidence drives a neural confirmation bias

Affiliations

Confidence drives a neural confirmation bias

Max Rollwage et al. Nat Commun. .

Abstract

A prominent source of polarised and entrenched beliefs is confirmation bias, where evidence against one's position is selectively disregarded. This effect is most starkly evident when opposing parties are highly confident in their decisions. Here we combine human magnetoencephalography (MEG) with behavioural and neural modelling to identify alterations in post-decisional processing that contribute to the phenomenon of confirmation bias. We show that holding high confidence in a decision leads to a striking modulation of post-decision neural processing, such that integration of confirmatory evidence is amplified while disconfirmatory evidence processing is abolished. We conclude that confidence shapes a selective neural gating for choice-consistent information, reducing the likelihood of changes of mind on the basis of new information. A central role for confidence in shaping the fidelity of evidence accumulation indicates that metacognitive interventions may help ameliorate this pervasive cognitive bias.


Conflict of interest statement

All authors declare no competing interests.

Figures

Fig. 1
Fig. 1. Task design and results of behavioural study 1 (n = 28 participants).
a Trial timeline. Note that participants first had to indicate a binary left versus right decision (i.e. a two alternative forced-choice), and then indicate their confidence in this decision by moving a cursor along the selected scale. b, c A psychophysical manipulation of positive evidence selectively increased confidence of the first decision (c) while keeping accuracy constant (b). This increase in confidence was replicated across all three studies. Data are presented as mean values ± SEM; grey dots represent individual participant data. Paired t-test (two-tailed): **p = .005. LPE = low positive evidence condition; HPE = high positive evidence condition. d Between-subject relationship between the degree to which positive evidence increased confidence (x-axis: confidence in the high positive evidence condition—confidence in the low positive evidence condition) and its effect on changes of mind (y-axis: changes of mind in the high positive evidence condition—changes of mind in the low positive evidence condition). This correlation was replicated in all three studies. Orange data points represent subjects showing the opposite of the intended effect of the manipulation on confidence (higher confidence in the low positive evidence condition). Pearson correlation (two-tailed): ***p < .0001.
Fig. 2
Fig. 2. Drift-diffusion modelling fits to the second decision (behavioural study 2, n = 23 participants).
a Illustration of how confidence may reduce changes of mind through either a shift in starting point towards the decision bound of the initial decision (upper panel) and/or a selective increase of drift-rate for evidence supporting the initial decision (lower panel). b, c Model simulations (of the best fitting model) reproduce behavioural patterns of accuracy and reaction times of the second decision when plotted as a function of the initial decision and initial confidence. Due to the task structure participants received confirming post-decision evidence when they were initially correct and disconfirming post-decision evidence after initial mistakes. Model simulations are shown as dotted lines, behavioural data as solid lines. Data are presented as mean values +/− 95% confidence intervals. The righthand panel of (c) plots the full distribution of response times and model predictions for the different trial types (high confidence and no change of mind, low confidence and no change of mind, high confidence and change of mind, low confidence and change of mind). d Posterior distribution of model parameters of the best-fitting model. The dependencies of the drift rate (purple lines) and starting point (green lines) on initial confidence (left panel), initial decision (middle panel) and the interaction between confidence × initial decision (right panel) are presented. The dotted vertical lines represent an effect of zero/no effect. Note that these dependencies are simultaneously fitted, controlling for mutual influences. Markov-Chain Monte-Carlo sampling of posterior parameter distribution: ***P(parameter > 0)>0.999. Sec=seconds.
Fig. 3
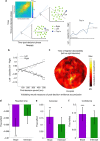
Fig. 3. Outline of MEG analysis for quantifying accumulation of post-decision evidence at a neural level (MEG study 3, n = 25 participants).
a We trained a machine-learning classification algorithm on the pre-decision phase using MEG activity to predict left vs. right choices, and reapplied this classifier to the corresponding time point during the post-decision phase. The distance of each trial to the separating hyperplane provides a graded measure of neural evidence for a left or right decision, with changes in the classifier prediction within each trial providing a neural metric of evidence accumulation (see right hand panel). The inset shows the temporal generalization of decoding accuracy from the pre- to post-decision phases, indicating that the pre-decision classifier generalises to the post-decision phase along the major diagonal (i.e. corresponding time-points). AUC = area under the curve, DV = decision variable. b Grand average of the left/right classifier prediction in response to post-decision evidence. The light grey line shows the change in neural representation when rightward motion is presented and the black line shows the change in neural representation when leftward motion is presented. Regression lines show fits to the group-averaged data for visualisation purposes. Note that positive classifier values indicate evidence for a rightward decision and negative values evidence for a leftward decision. c Contributions of sensors to decoding left versus right decisions. The group average of contributions for each sensor is presented. In line with previous research on the neural correlates of evidence accumulation, sensors in centro-parietal regions made the highest contributions to decodability of (abstract) left versus right decisions. df Validation of neural metrics of post-decision evidence accumulation. Neural measures of the slope and starting point (intercept) of evidence accumulation extracted from the post-decision phase were entered as simultaneous predictors of (d) reaction times (e) accuracy and (f) confidence of the final decision. Fixed effects from a hierarchical regression model are presented ± SEM. Hierarchical regression (two-tailed): d **p = 0.005; e *p = 0.045, **p = 0.002; f **p = 0.002, ***p = 0.0004.
Fig. 4
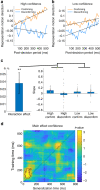
Fig. 4. MEG analysis investigating the influence of confidence on post-decision evidence processing (MEG study 3, n = 25 participants).
a, b Neural metrics of post-decision accumulation separated into confirming (consistent with initial decision) and disconfirming (inconsistent with initial decision) post-decision evidence and as a function of high (a) and low (b) initial confidence. More positive values on the y-axis indicate stronger (more veridical) representation of the presented motion. Weighted group averages (grand average) are presented and regression lines are fits to this averaged data. c Effects of initial decision and confidence on the slope of neural evidence accumulation in response to post-decision evidence (slope). The righthand panel shows weighted mean values ± SEM for the strength of neural evidence integration (slope) within each condition. Grey dots represent individual participants’ data. The lefthand bar shows the fixed effect ± SEM for the initial decision × confidence interaction effect from a hierarchical regression (two-tailed): **p = 0.008. d Effect of confidence on temporal generalization of decoding accuracy from the pre- to the post-decision phase. Higher confidence is associated with higher decodability of the initial decision (i.e. stronger representation of the initial decision, yellow colours). A stronger representation of the initial decision was seen at the beginning of the post-decision period when confidence was high, consistent with confidence shifting a starting point towards the bound of the initial decision. The contoured area represents a cluster of timepoints with a significant main effect of confidence (permutation test, p < 0.05 corrected for multiple comparisons). The time window starts with stimulus presentation (0 ms) and ends when the response options are presented (850 ms). Dotted lines indicate the offset of the stimulus (pre- or post-decision stimulus respectively).

References

    1. Pomerantz EM, Chaiken S, Tordesillas RS. Attitude strength and resistance processes. J. Pers. Soc. Psychol. 1995;69:408. - PubMed
    1. Park, J., Konana, P., Gu, B., Kumar, A. & Raghunathan, R. Confirmation bias, overconfidence, and investment performance: Evidence from stock message boards. McCombs Res. Pap. Ser. No. IROM-07-10 (2010).
    1. Nickerson RS. Confirmation bias: a ubiquitous phenomenon in many guises. Rev. Gen. Psychol. 1998;2:175–220.
    1. Lord CG, Ross L, Lepper MR. Biased assimilation and attitude polarization: The effects of prior theories on subsequently considered evidence. J. Pers. Soc. Psychol. 1979;37:2098.
    1. Kaplan JT, Gimbel SI, Harris S. Neural correlates of maintaining one’s political beliefs in the face of counterevidence. Sci. Rep. 2016;6:1–11. - PMC - PubMed

Publication types