. 2020 May 26;11(1):2622.
doi: 10.1038/s41467-020-16439-7.

Treatment of atherosclerosis by macrophage-biomimetic nanoparticles via targeted pharmacotherapy and sequestration of proinflammatory cytokines

Affiliations

Treatment of atherosclerosis by macrophage-biomimetic nanoparticles via targeted pharmacotherapy and sequestration of proinflammatory cytokines

Cheng Gao et al. Nat Commun. .

Abstract

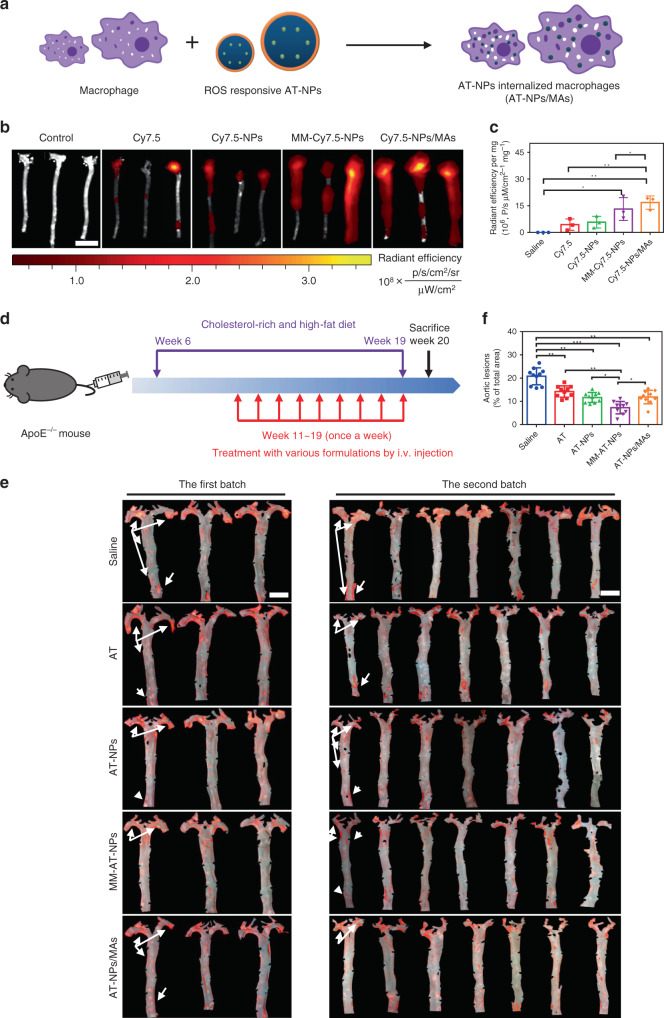
Vascular disease remains the leading cause of death and disability, the etiology of which often involves atherosclerosis. The current treatment of atherosclerosis by pharmacotherapy has limited therapeutic efficacy. Here we report a biomimetic drug delivery system derived from macrophage membrane coated ROS-responsive nanoparticles (NPs). The macrophage membrane not only avoids the clearance of NPs from the reticuloendothelial system, but also leads NPs to the inflammatory tissues, where the ROS-responsiveness of NPs enables specific payload release. Moreover, the macrophage membrane sequesters proinflammatory cytokines to suppress local inflammation. The synergistic effects of pharmacotherapy and inflammatory cytokines sequestration from such a biomimetic drug delivery system lead to improved therapeutic efficacy in atherosclerosis. Comparison to macrophage internalized with ROS-responsive NPs, as a live-cell based drug delivery system for treatment of atherosclerosis, suggests that cell membrane coated drug delivery approach is likely more suitable for dealing with an inflammatory disease than the live-cell approach.


Conflict of interest statement

The authors declare no competing interests.

Figures

Fig. 1
Fig. 1. Preparation and characterization of ROS responsive NPs and MM-NPs.
a Schematic illustration of the preparation of AT-NPs. b Representative TEM image of ROS responsive NPs. Scale bar: 100 nm. c Hydrolysis rate of NPs in PBS with different concentration of H2O2 (0, 0.01 mM, 0.25 mM, 0.50 mM and 1.00 mM). d In vitro drug release profile of AT-NPs w and w/o 1.00 mM of H2O2. e Schematic illustration of preparation of MM-NPs through an extrusion method. f Representative TEM image of MM-NPs. Scale bar: 500 nm. Inset: the amplified TEM image of a single MM-NP. Scale bar: 50 nm. g, h Zeta potentials and particle sizes of NPs and MM-NPs analyzed by DLS. i Characteristic protein bands of NPs, macrophage membrane derived vesicles, and MM-NPs resolved by Western blotting. j Quantitative analysis on the integrated density of TNFR2 and CCR2, measured in NPs (100 μL of suspensions), macrophages (2.5 × 107 cells) and MM-NPs (100 μL of suspensions, 0.25 mg/mL protein content). In g, h, j, statistical comparison was made between MM-NPs and NPs, and between macrophage vesicles and NPs, respectively. All the experiments were repeated for three times (n = 3) and data was presented as mean ± s.d. Statistical analysis was conducted using one-way ANOVA. *P ≤ 0.05, **P ≤ 0.01, and ***P ≤ 0.001. Source data are provided as a Source Data file.
Fig. 2
Fig. 2. Attenuation effects on LPS-induced inflammation and oxLDL-induced foam cells formation by MM-AT-NPs.
a Viability of RAW264.7 co-treated with LPS (10 ng mL−1) and AT, AT-NPs, and MM-AT-NPs, respectively, at 0, 1.25, 5, and 20 μM AT. b, c Intracellular ROS levels (by flow cytometry analysis) in RAW264.7 cells treated with LPS (400 ng mL−1), w or w/o AT, AT-NPs, or MM-AT-NPs, respectively at 0.4 mM AT for 24 h. d NO production of RAW264.7 cells treated with LPS (100 ng mL−1), w or w/o AT, AT-NPs or MM-AT-NPs, respectively at 0.1 mM AT for 24 h. e Cellular uptake (including quantitative analysis) of Cy5-NPs and MM-Cy5-NPs by RAW264.7 cells treated with LPS and oxLDL, respectively. Scale bar: 50 μm. f Intracellular payload release (including quantitative analysis) of MM-NR-NPs in LPS- and oxLDL-treated macrophage. Scale bar: 50 μm. The experiments were repeated for three times (n = 3) and data were presented as mean ± s.d. Statistical analysis for cell viability was performed using two-way ANOVA. Analysis for mean DCFH-DA fluorescence, NO production and apoptosis rate were conducted using one-way ANOVA. *P ≤ 0.05, **P ≤ 0.01, and ***P ≤ 0.001. Source data are provided as a Source Data file.
Fig. 3
Fig. 3. Targeting efficiency and therapeutic efficacy of MM-AT-NPs and AT-NPs/MAs.
a Schematic illustration of preparation of AT-NPs/MAs. b, c Ex vivo fluorescence bio-imaging and quantitative analysis of Cy7.5 fluorescent signal in aorta tissues. ApoE−/− mice fed with high fat food for 1 month were i.v. administered with Cy7.5, Cy7.5-NPs, MM-Cy7.5-NPs, and Cy7.5-NPs/MAs, respectively. n = 3 aorta tissues from different mice. Scale bar: 15 mm. d Schematic illustration of atherosclerotic mouse model development and treatment with various formulations (AT, AT-NPs, MM-AT-NPs, and AT-NPs/MAs). e ORO stained aorta tissues collected from atherosclerotic mice after treatment with various formulations (AT, AT-NPs, MM-AT-NPs, and AT-NPs/MAs) at equivalent dosage of 2 mg kg−1 AT per week. n = 10 aorta tissues from different mice. Scale bar: 5 mm. f Quantitative analysis of lesion area in aorta tissues (n = 10). All data were presented as mean ± s.d. Statistical analysis was conducted using one-way ANOVA. *P ≤ 0.05, **P ≤ 0.01, and ***P ≤ 0.001. Source data are provided as a Source Data file.
Fig. 4
Fig. 4. MM-AT-NPs ameliorated plaque and inflammation in an atherosclerotic mouse model.
a Representative photographs and quantitative analysis of aorta root sections stained by H&E, CD14 antibody, MMP-9 antibody, Masson’s trichrome, and α-SMA antibody (n = 6). Scale bar: 500 μm. bd The levels of TNF-α, IL-1β, and IL-6 in aorta tissues collected from atherosclerotic mice after treatment with various formulations (saline, AT, AT-NPs, MM-AT-NPs, and AT-NPs/MAs) at a dose of 2 mg kg−1 AT per week (n = 6). eg The levels of TNF-α, IL-6 and oxPL-LDL in blood serum (n = 6). h The levels of TC, HDL-C, and Non-HDL-C in the blood serum (n = 6). i The changes of body weight in atherosclerotic mice treated with various formulations (saline, AT, AT-NPs, MM-AT-NPs, and AT-NPs/MAs) (n = 7). All data were presented as mean ± s.d. Statistical analysis was conducted using one-way ANOVA. *P ≤ 0.05, **P ≤ 0.01, and ***P ≤ 0.001. Source data are provided as a Source Data file.
Fig. 5
Fig. 5. Anti-atherosclerotic actions by MM-AT-NPs.
a DHE-stained sections of the aorta root, aorta arch and brachiocephalic artery, from atherosclerotic mice treated with various formulations (AT, AT-NPs, MM-AT-NPs, and AT-NPs/MAs) at a dose of 2 mg kg−1 AT per week. Scale bar in aorta root and aorta arch: 400 μm. Scale bar in brachiocephalic artery: 800 μm. b Binding profiles of MM-NPs with TNF-α and IL-1β, MCP-1 (10 ng mL−1 each), and oxLDL (20 μg mL−1), with MM-NP varied from 0 to 4 mg mL−1. Nonlinear regression fitting with inhibitory dose–response model (variable slope model) was employed to process data using Graphpad Prism 6. c, d MM-NP’s dose-dependent inhibition of macrophage inflammation induced by MCP-1 and oxLDL, respectively, with MM-NP varied from 0 to 4 mg mL−1. e Representative microscopic images of ORO stained RAW264.7 cells treated with oxLDL (20 μg mL−1) and MM-NPs (0.25, 0.5, 1, and 2 mg mL−1, respectively). Scale bar: 50 μm. f Quantified contents of ORO in foam cells derived from RAW264.7 cells. The experiments were conducted for three times independently. All data were presented as mean ± s.d. Statistical analysis was conducted using one-way ANOVA. *P ≤ 0.05, **P ≤ 0.01, and ***P ≤ 0.001. For DHE-stained aorta tissues, n = 3 aorta tissues from different mice. For binding capacity, inhibition of macrophage inflammation and ORO stained RAW264.7 cells, n = 3 independent experiments using same batch of MM-NPs. IC50 was calculated by variable slope model using GraphPad Prism 6. Source data are provided as a Source Data file.

Comment in

References

    1. Roth GA, et al. Global, regional, and national burden of cardiovascular diseases for 10 causes, 1990 to 2015. J. Am. Coll. Cardiol. 2017;70:1–25. - PMC - PubMed
    1. Allahverdian S, Chaabane C, Boukais K, Francis GA, Bochaton-Piallat ML. Smooth muscle cell fate and plasticity in atherosclerosis. Cardiovasc. Res. 2018;114:540–550. - PMC - PubMed
    1. Allahverdian S, Chehroudi AC, McManus BM, Abraham T, Francis GA. Contribution of intimal smooth muscle cells to cholesterol accumulation and macrophage-like cells in human atherosclerosis. Circulation. 2014;129:1551–1559. - PubMed
    1. Moore KJ, Sheedy FJ, Fisher EA. Macrophages in atherosclerosis: a dynamic balance. Nat. Rev. Immunol. 2013;13:709–721. - PMC - PubMed
    1. Tabas I, Bornfeldt KE. Macrophage phenotype and function in different stages of atherosclerosis. Circ. Res. 2016;118:653–667. - PMC - PubMed

Publication types