

Tep1 Regulates Yki Activity in Neural Stem Cells in Drosophila Glioma Model
- PMID: 32457905
- PMCID: PMC7225285
- DOI: 10.3389/fcell.2020.00306
Tep1 Regulates Yki Activity in Neural Stem Cells in Drosophila Glioma Model
Abstract
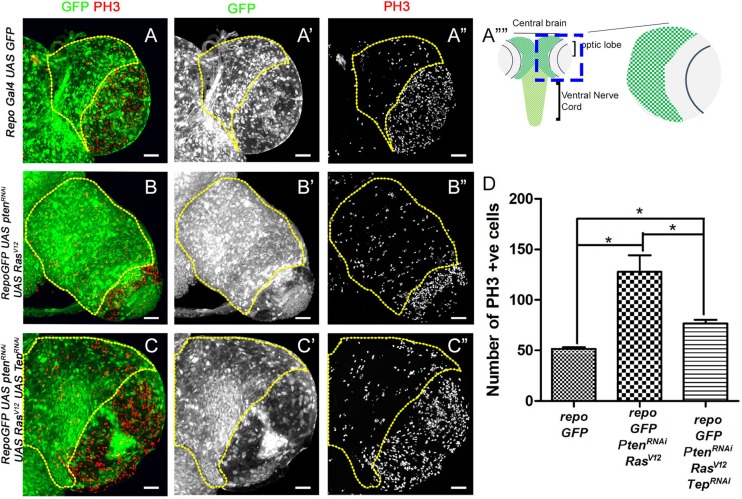
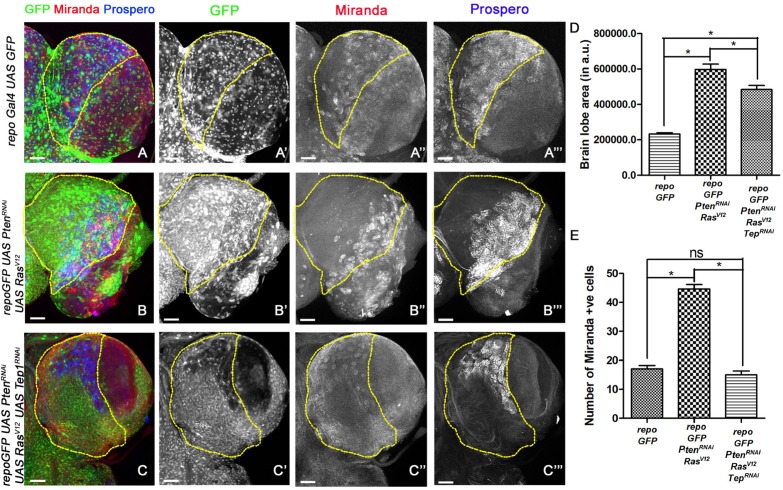
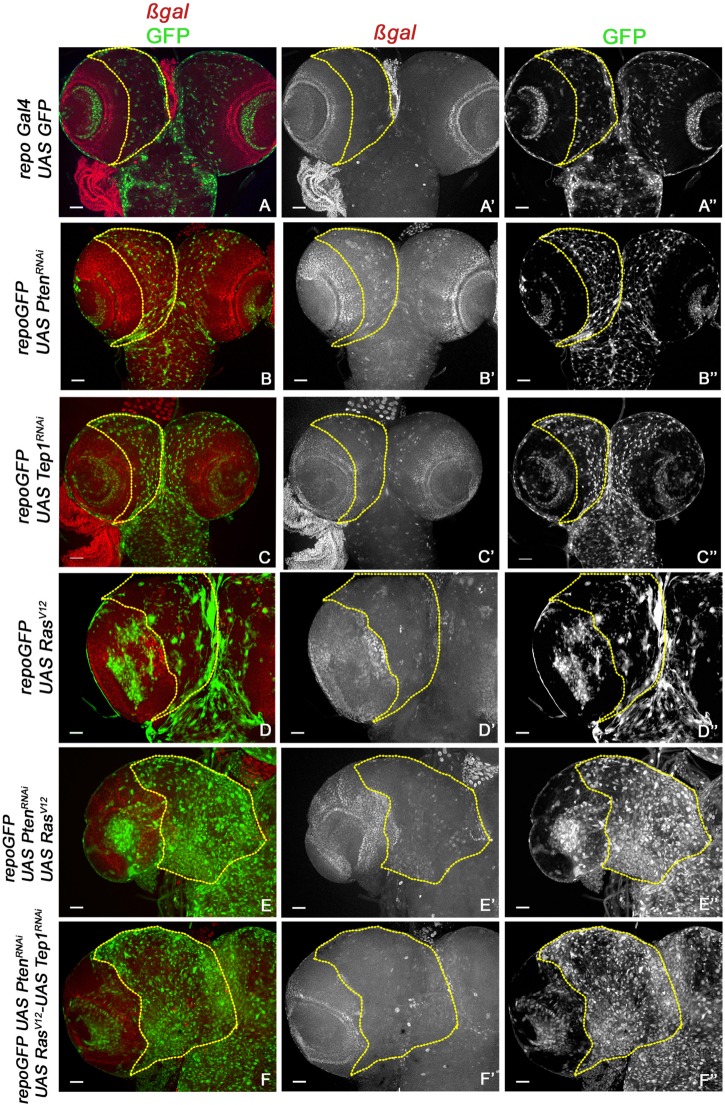
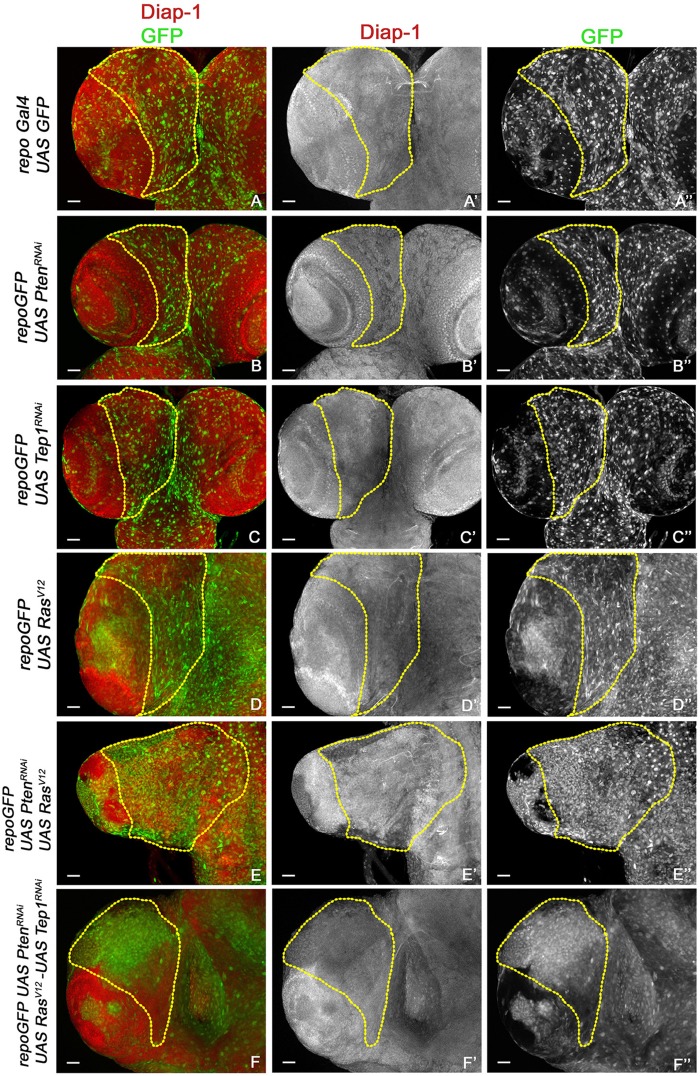
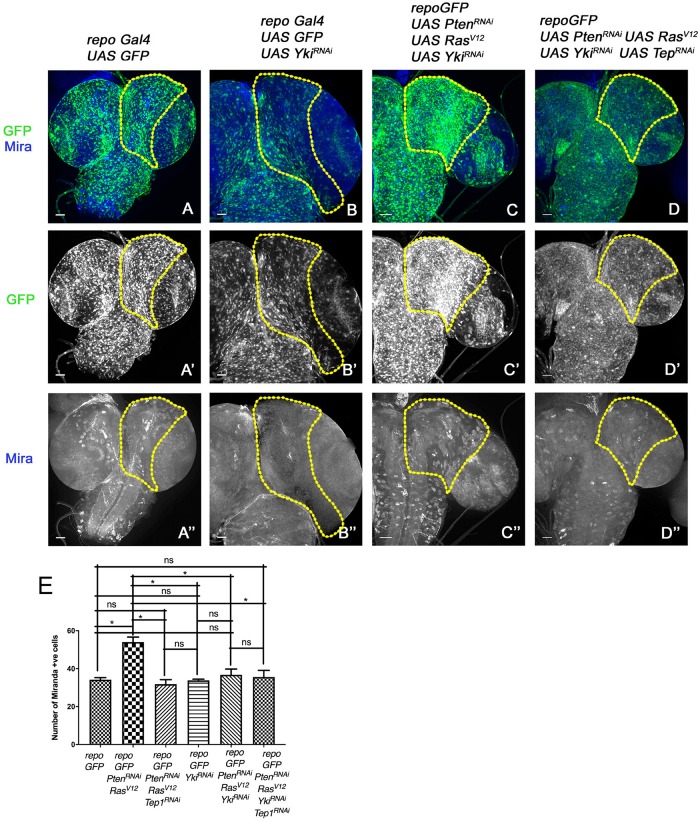
Glioblastoma Multiforme (GBM) is the most common form of malignant brain tumor with poor prognosis. Amplification of Epidermal Growth Factor Receptor (EGFR), and mutations leading to activation of Phosphatidyl-Inositol-3 Kinase (PI3K) pathway are commonly associated with GBM. Using a previously published Drosophila glioma model generated by coactivation of PI3K and EGFR pathways [by downregulation of Pten and overexpression of oncogenic Ras] in glial cells, we showed that the Drosophila Tep1 gene (ortholog of human CD109) regulates Yki (the Drosophila ortholog of human YAP/TAZ) via an evolutionarily conserved mechanism. Oncogenic signaling by the YAP/TAZ pathway occurs in cells that acquire CD109 expression in response to the inflammatory environment induced by radiation in clinically relevant models. Further, downregulation of Tep1 caused a reduction in Yki activity and reduced glioma growth. A key function of Yki in larval CNS is stem cell renewal and formation of neuroblasts. Other reports suggest different upstream regulators of Yki activity in the optic lobe versus the central brain regions of the larval CNS. We hypothesized that Tep1 interacts with the Hippo pathway effector Yki to regulate neuroblast numbers. We tested if Tep1 acts through Yki to affect glioma growth, and if in normal cells Tep1 affects neuroblast number and proliferation. Our data suggests that Tep1 affects Yki mediated stem cell renewal in glioma, as reduction of Tep significantly decreases the number of neuroblasts in glioma. Thus, we identify Tep1-Yki interaction in the larval CNS that plays a key role in glioma growth and progression.
Keywords: Drosophila; Hippo pathway; Tep; Tep1; Yki; glioma; neural stem cell.
Copyright © 2020 Gangwani, Snigdha and Kango-Singh.
Figures
Similar articles
-
CDK7 regulates organ size and tumor growth by safeguarding the Hippo pathway effector Yki/Yap/Taz in the nucleus.Genes Dev. 2020 Jan 1;34(1-2):53-71. doi: 10.1101/gad.333146.119. Epub 2019 Dec 19. Genes Dev. 2020. PMID: 31857346 Free PMC article.
-
Modulation of the Hippo pathway and organ growth by RNA processing proteins.Proc Natl Acad Sci U S A. 2018 Oct 16;115(42):10684-10689. doi: 10.1073/pnas.1807325115. Epub 2018 Sep 26. Proc Natl Acad Sci U S A. 2018. PMID: 30257938 Free PMC article.
-
The Hippo pathway integrates PI3K-Akt signals with mechanical and polarity cues to control tissue growth.PLoS Biol. 2019 Oct 15;17(10):e3000509. doi: 10.1371/journal.pbio.3000509. eCollection 2019 Oct. PLoS Biol. 2019. PMID: 31613895 Free PMC article.
-
Hippo-Independent Regulation of Yki/Yap/Taz: A Non-canonical View.Front Cell Dev Biol. 2021 Apr 1;9:658481. doi: 10.3389/fcell.2021.658481. eCollection 2021. Front Cell Dev Biol. 2021. PMID: 33869224 Free PMC article. Review.
-
Hippo Signaling in Cancer: Lessons From Drosophila Models.Front Cell Dev Biol. 2019 May 24;7:85. doi: 10.3389/fcell.2019.00085. eCollection 2019. Front Cell Dev Biol. 2019. PMID: 31231648 Free PMC article. Review.
Cited by
-
Modeling Brain Tumors: A Perspective Overview of in vivo and Organoid Models.Front Mol Neurosci. 2022 May 30;15:818696. doi: 10.3389/fnmol.2022.818696. eCollection 2022. Front Mol Neurosci. 2022. PMID: 35706426 Free PMC article. Review.
-
Cracking the Code of Neuronal Cell Fate.Cells. 2023 Mar 30;12(7):1057. doi: 10.3390/cells12071057. Cells. 2023. PMID: 37048129 Free PMC article. Review.
-
Regenerative neurogenic response from glia requires insulin-driven neuron-glia communication.Elife. 2021 Feb 2;10:e58756. doi: 10.7554/eLife.58756. Elife. 2021. PMID: 33527895 Free PMC article.
-
Cell Surface Processing of CD109 by Meprin β Leads to the Release of Soluble Fragments and Reduced Expression on Extracellular Vesicles.Front Cell Dev Biol. 2021 Mar 2;9:622390. doi: 10.3389/fcell.2021.622390. eCollection 2021. Front Cell Dev Biol. 2021. PMID: 33738281 Free PMC article.
-
Upregulation of CD109 Promotes the Epithelial-to-Mesenchymal Transition and Stemness Properties of Lung Adenocarcinomas via Activation of the Hippo-YAP Signaling.Cells. 2020 Dec 25;10(1):28. doi: 10.3390/cells10010028. Cells. 2020. PMID: 33375719 Free PMC article.
References
Grants and funding
LinkOut - more resources
Full Text Sources
Molecular Biology Databases
Research Materials
Miscellaneous