. 2020 Sep 10;136(11):1303-1316.
doi: 10.1182/blood.2019001808.

Aldehyde dehydrogenase 3a2 protects AML cells from oxidative death and the synthetic lethality of ferroptosis inducers

Affiliations

Aldehyde dehydrogenase 3a2 protects AML cells from oxidative death and the synthetic lethality of ferroptosis inducers

Rushdia Zareen Yusuf et al. Blood. .

Abstract

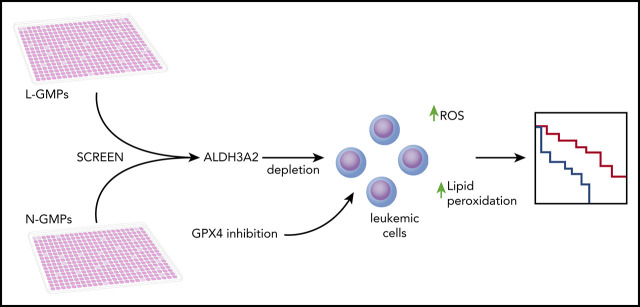
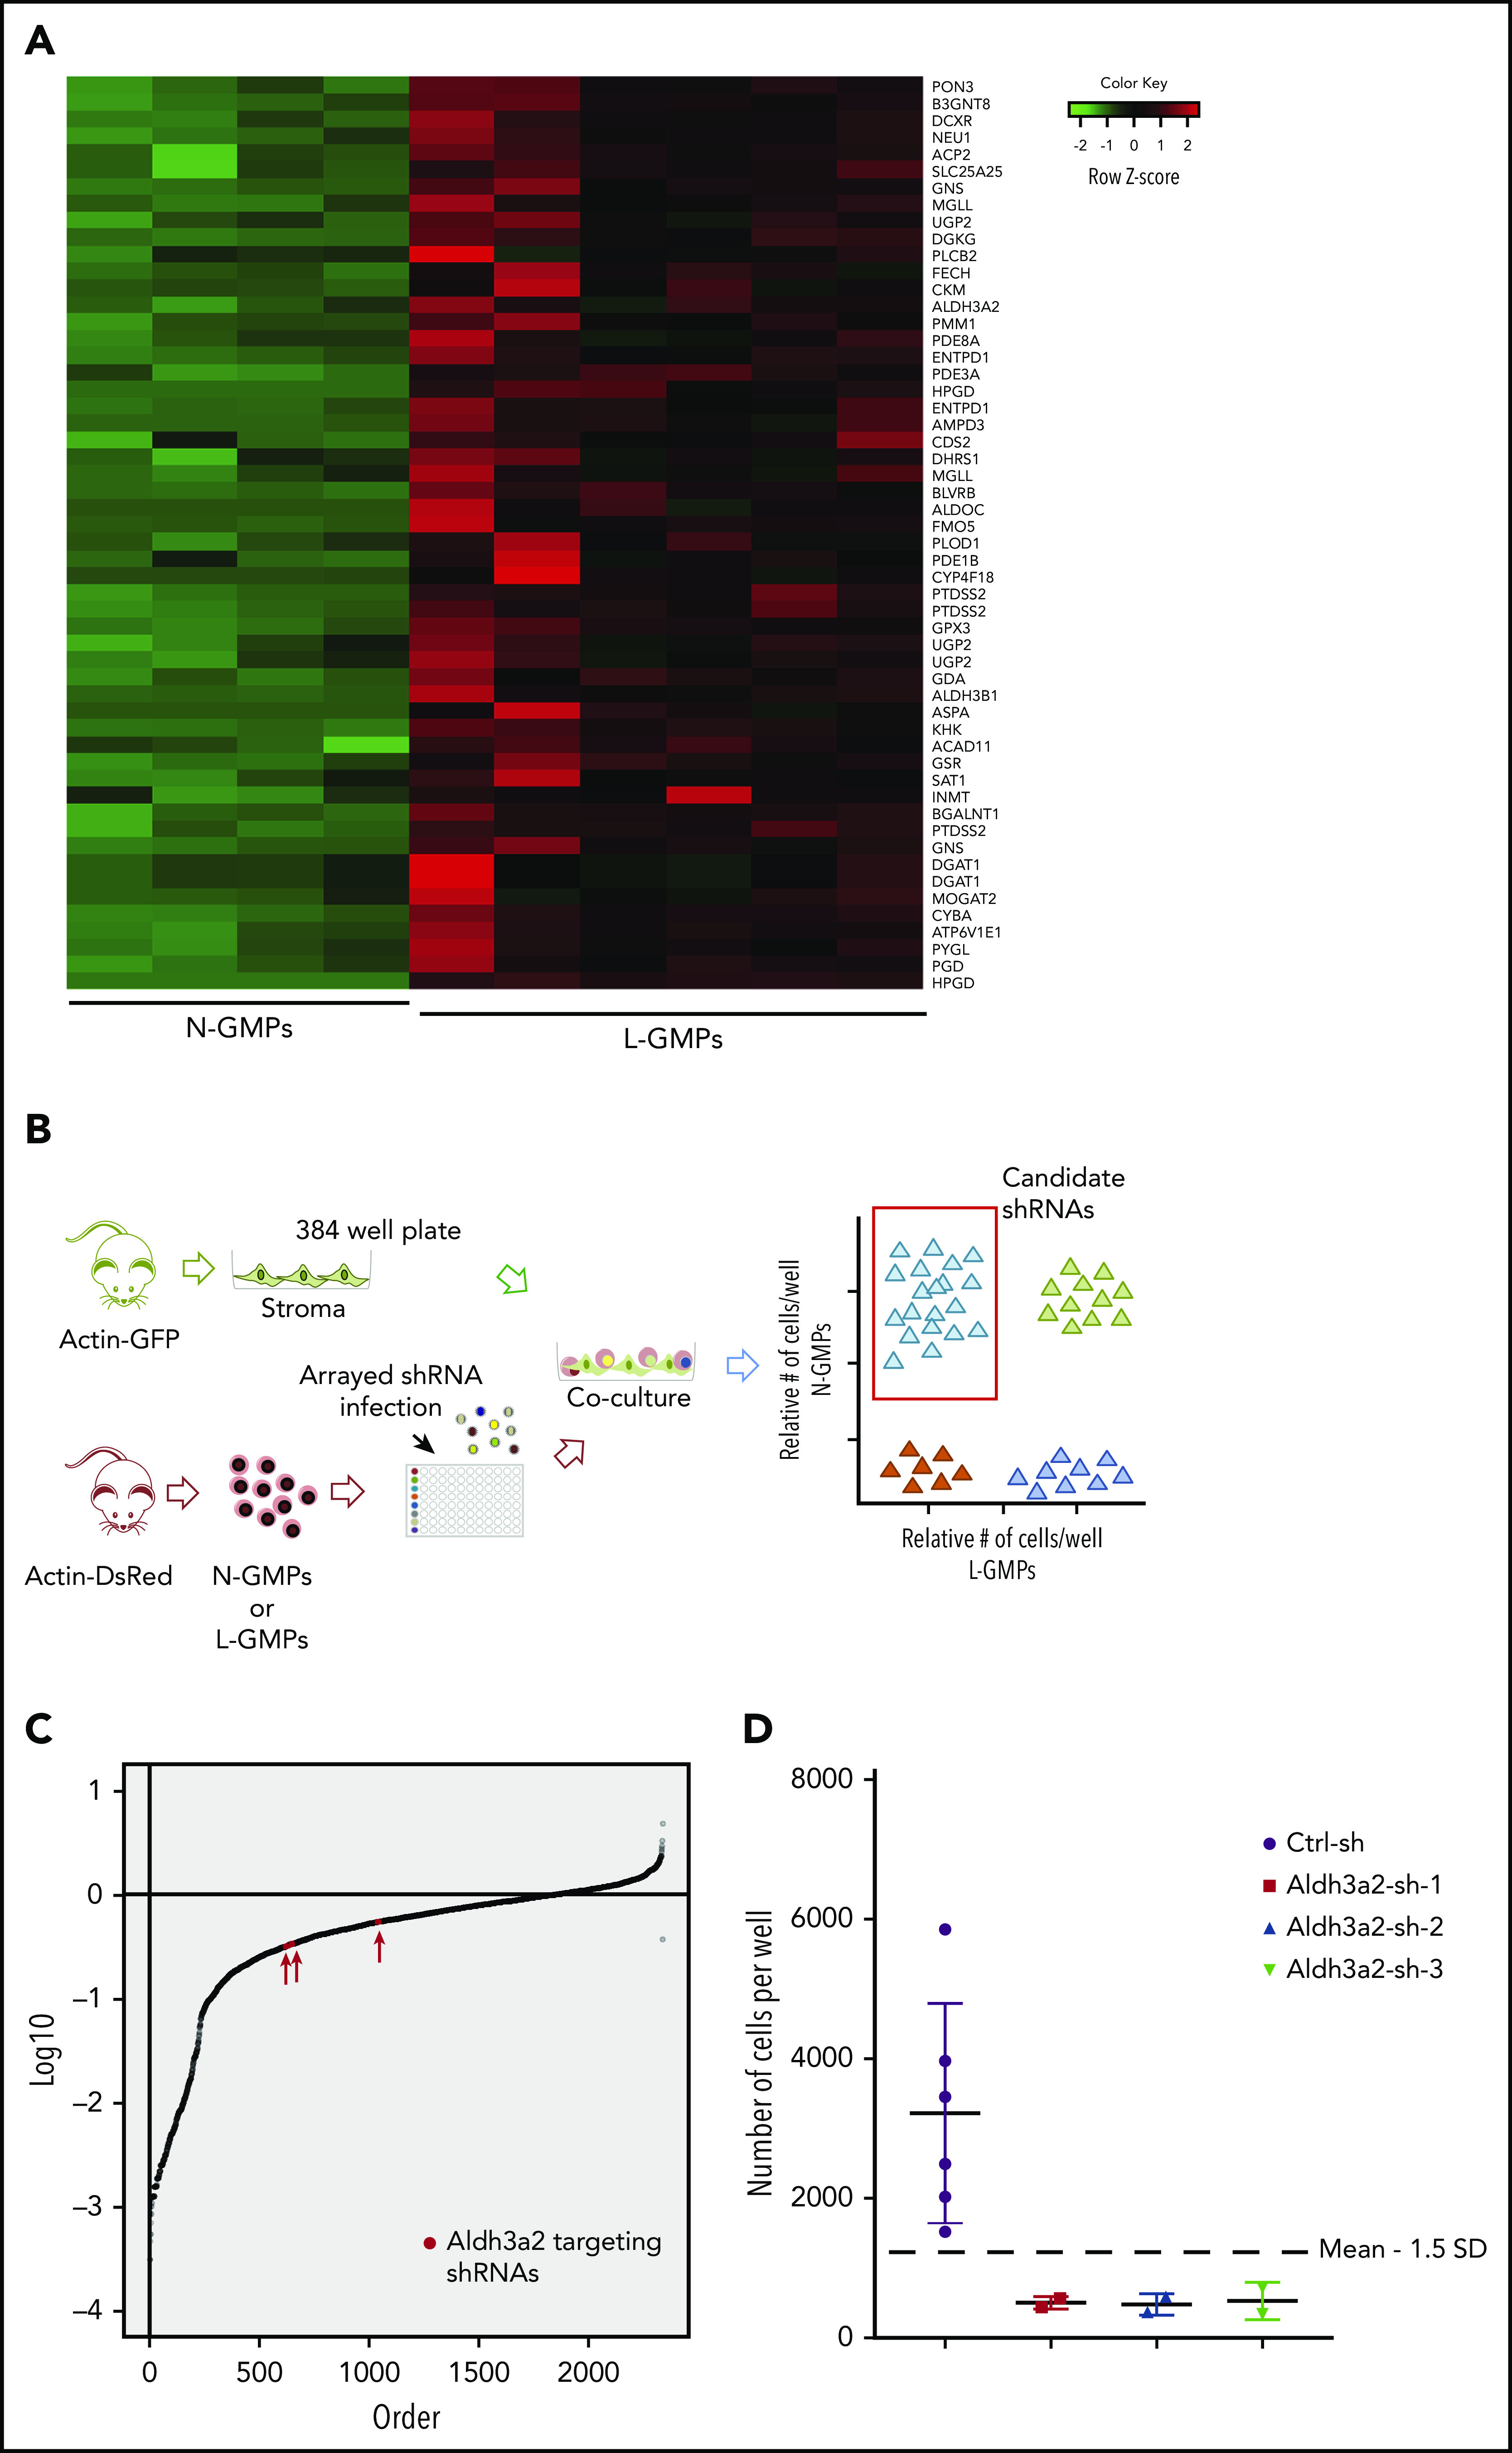
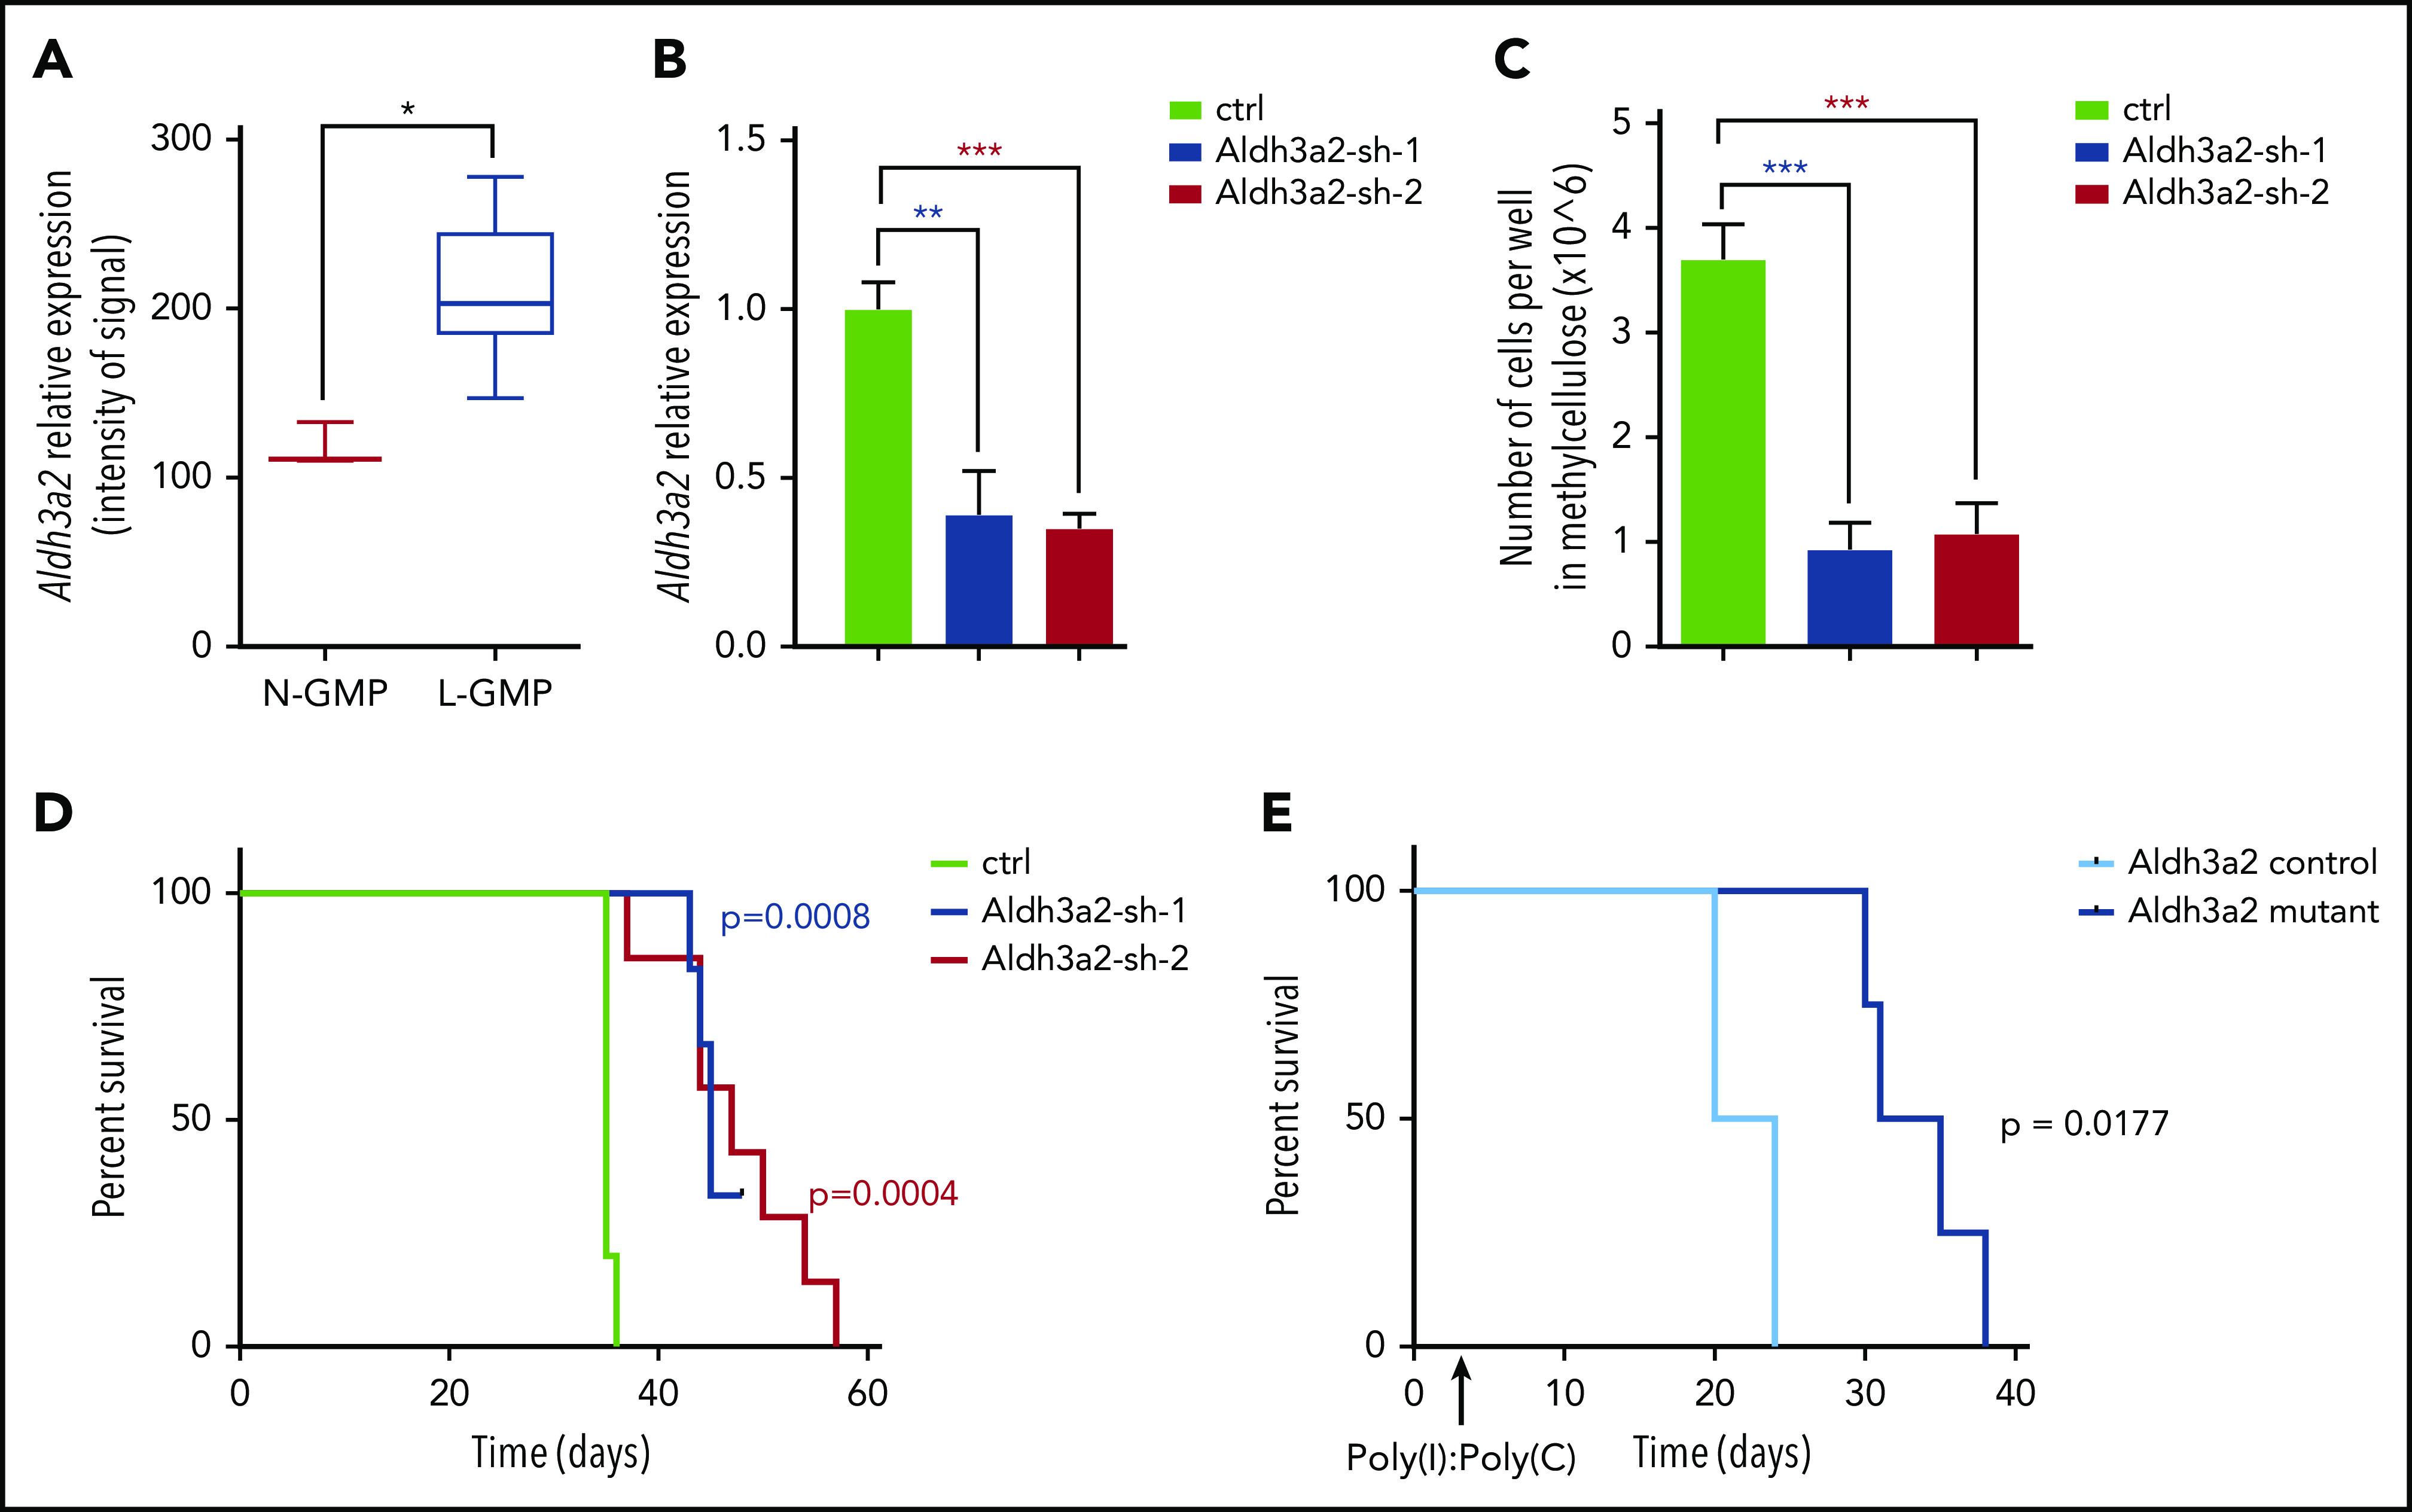
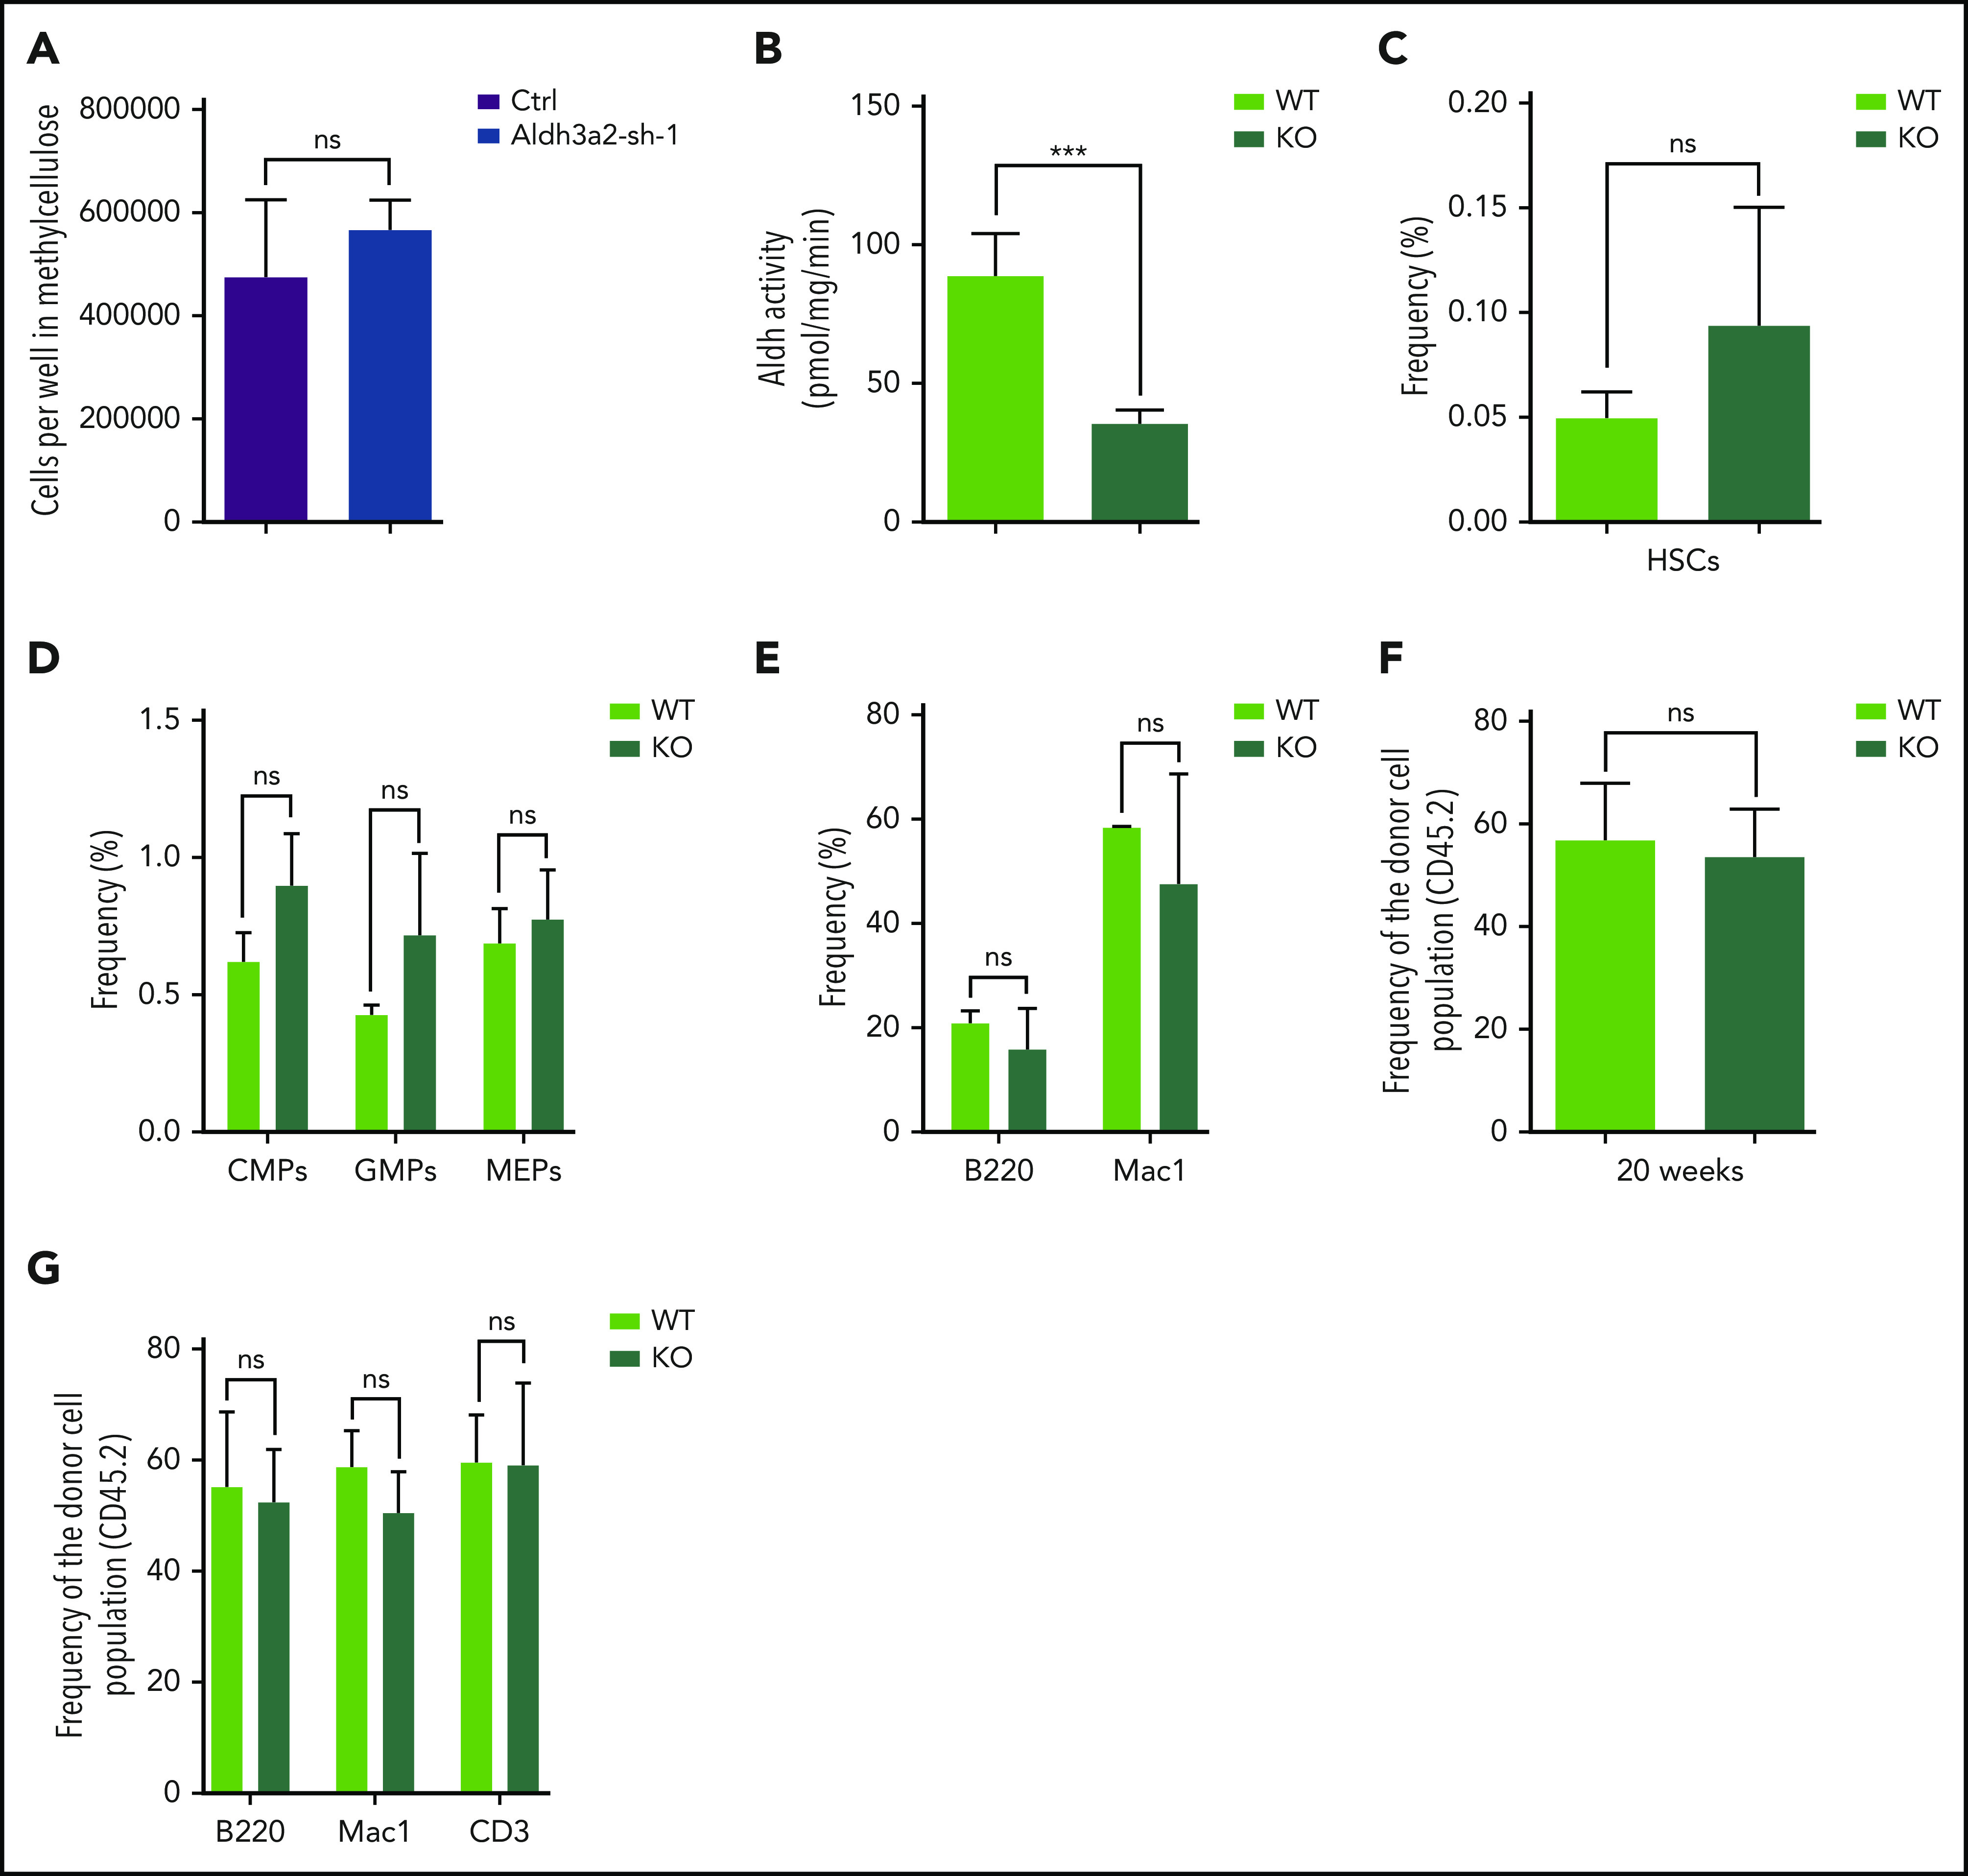
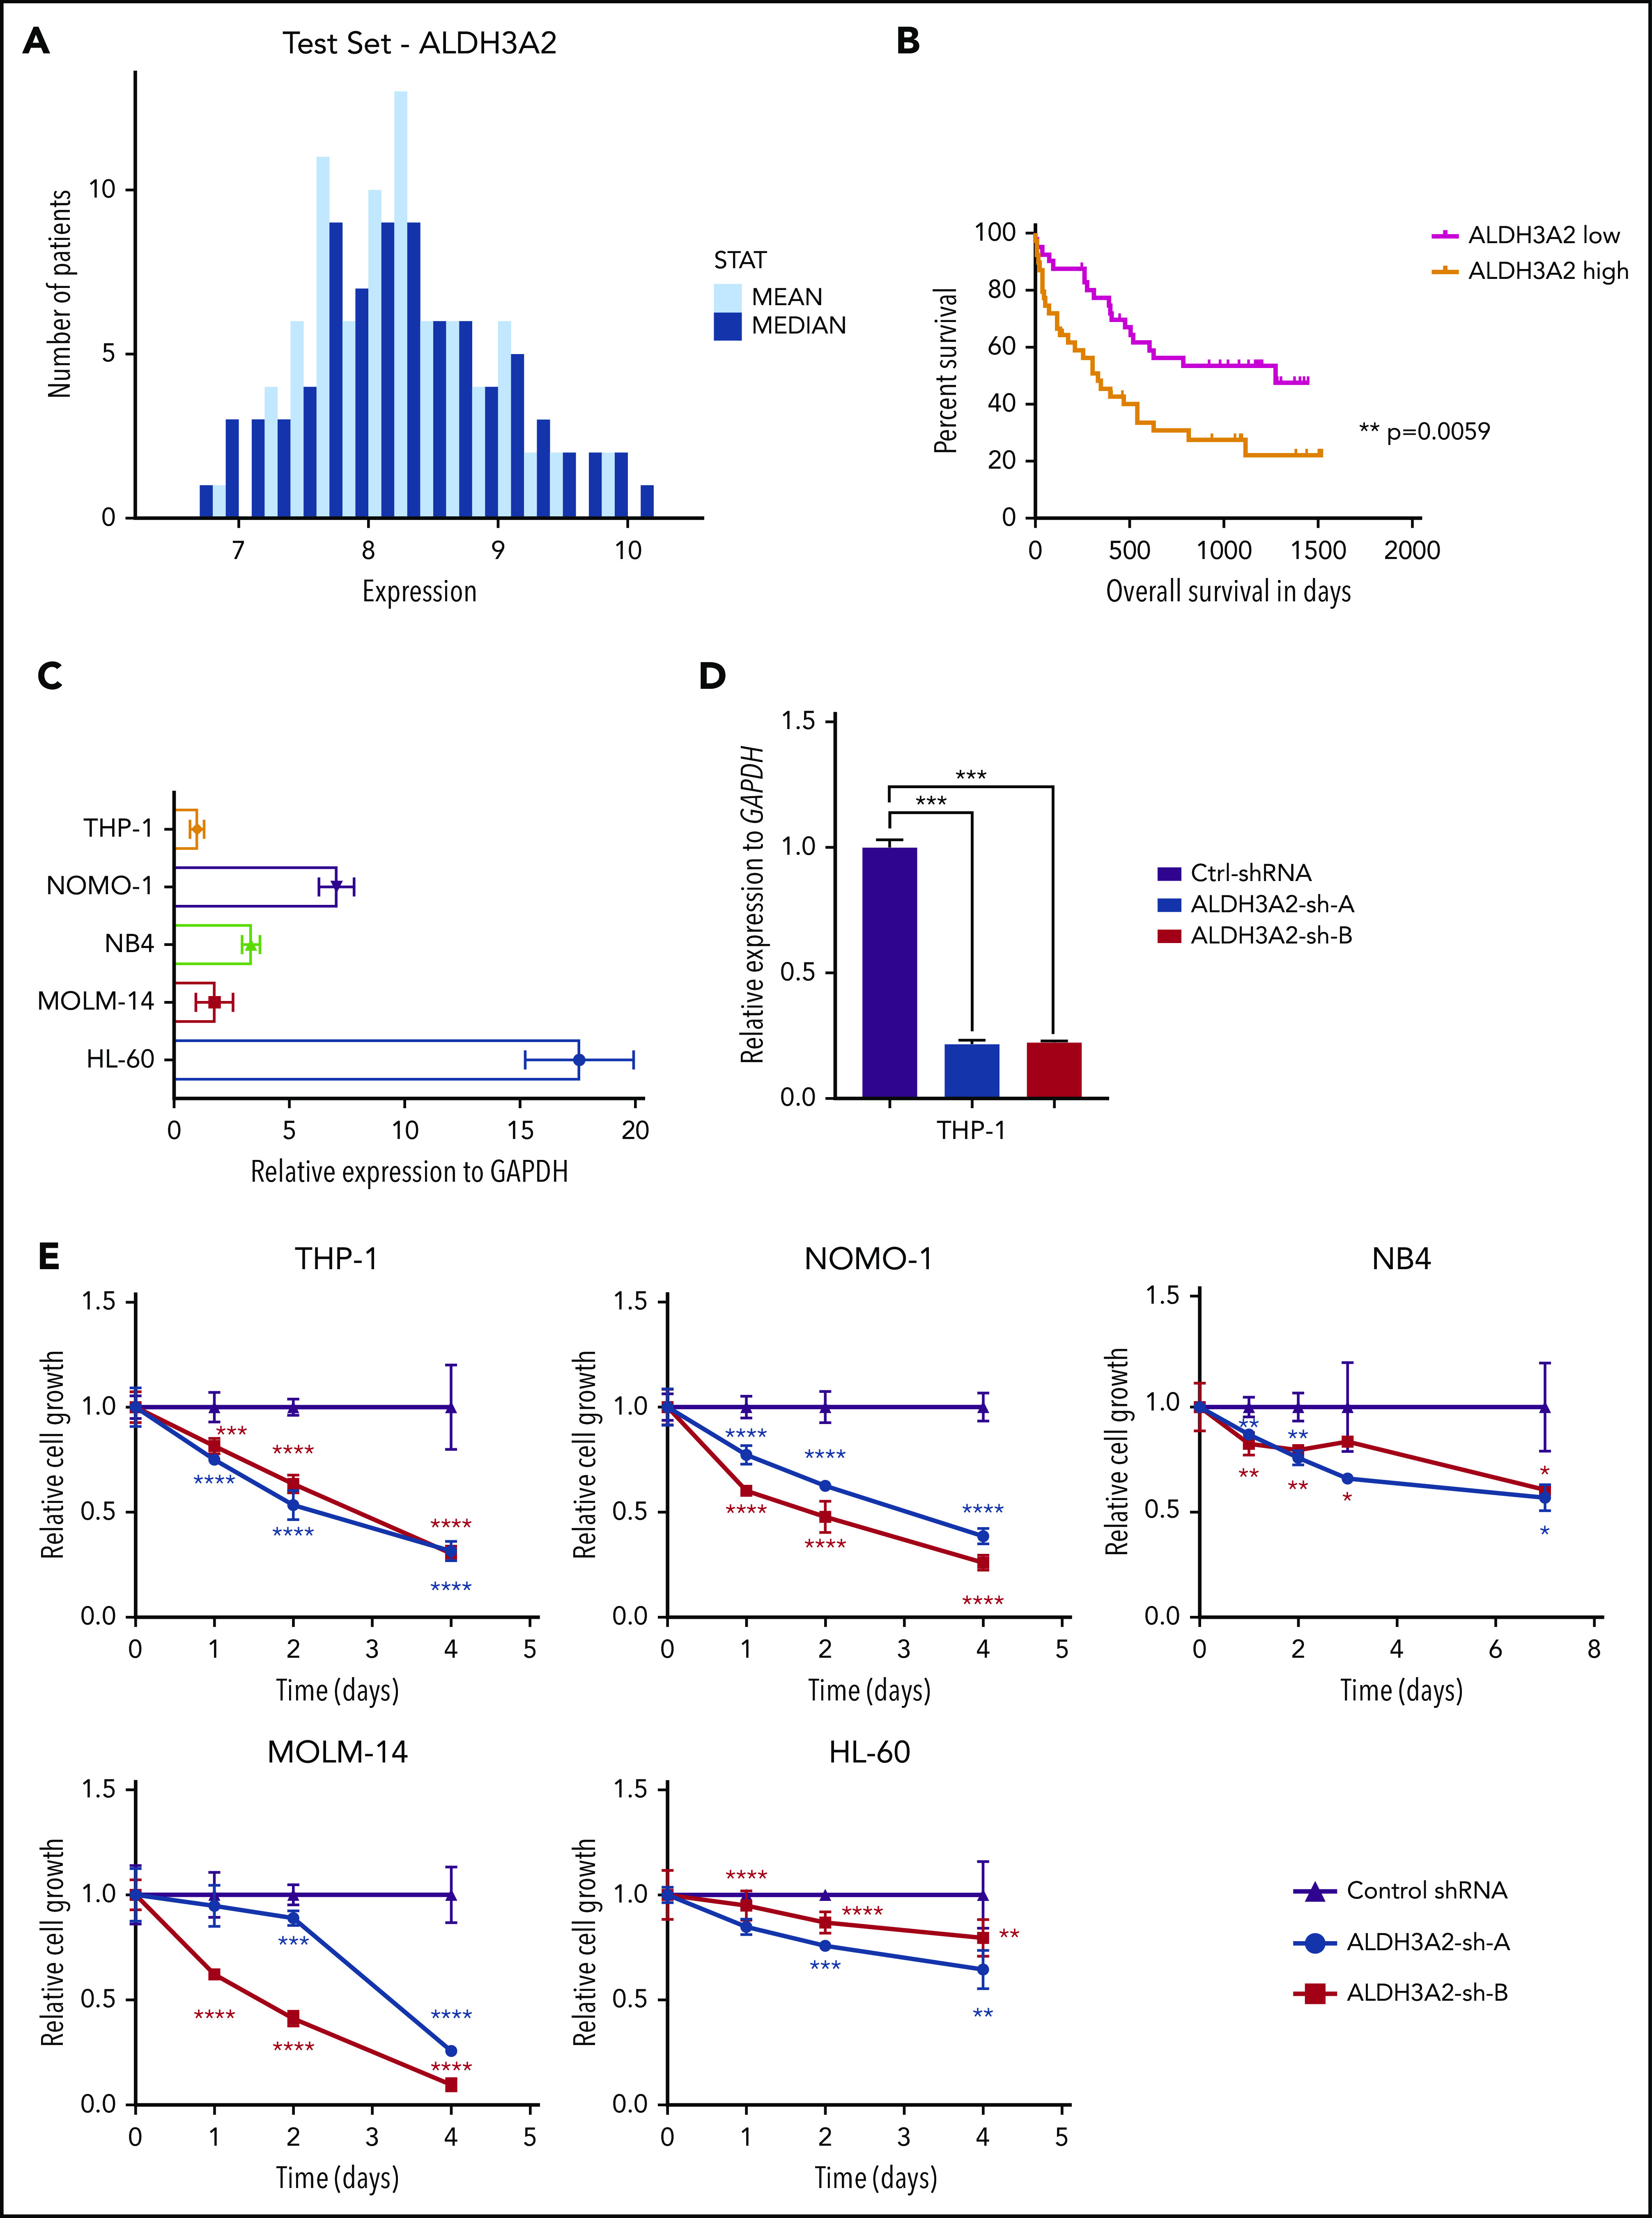
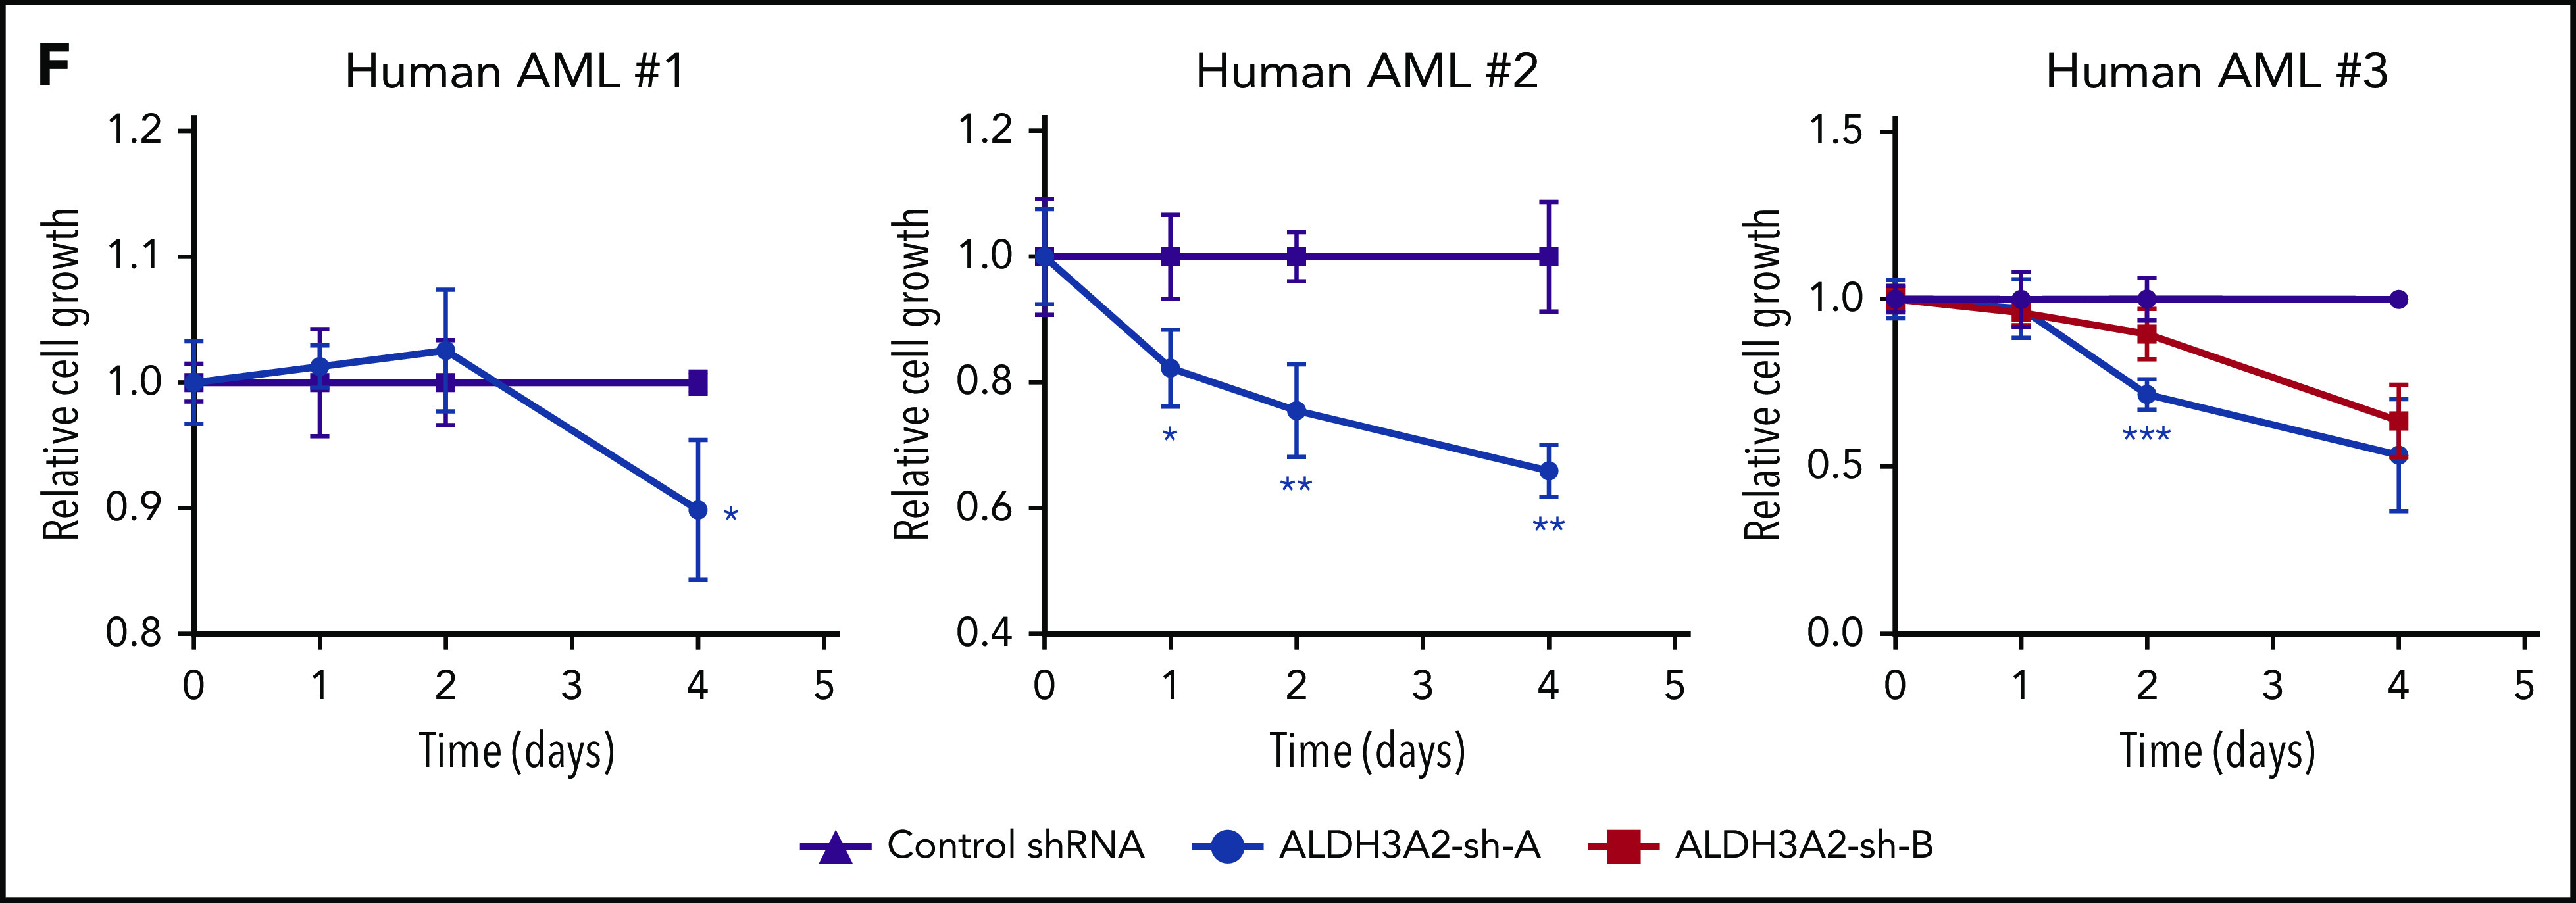
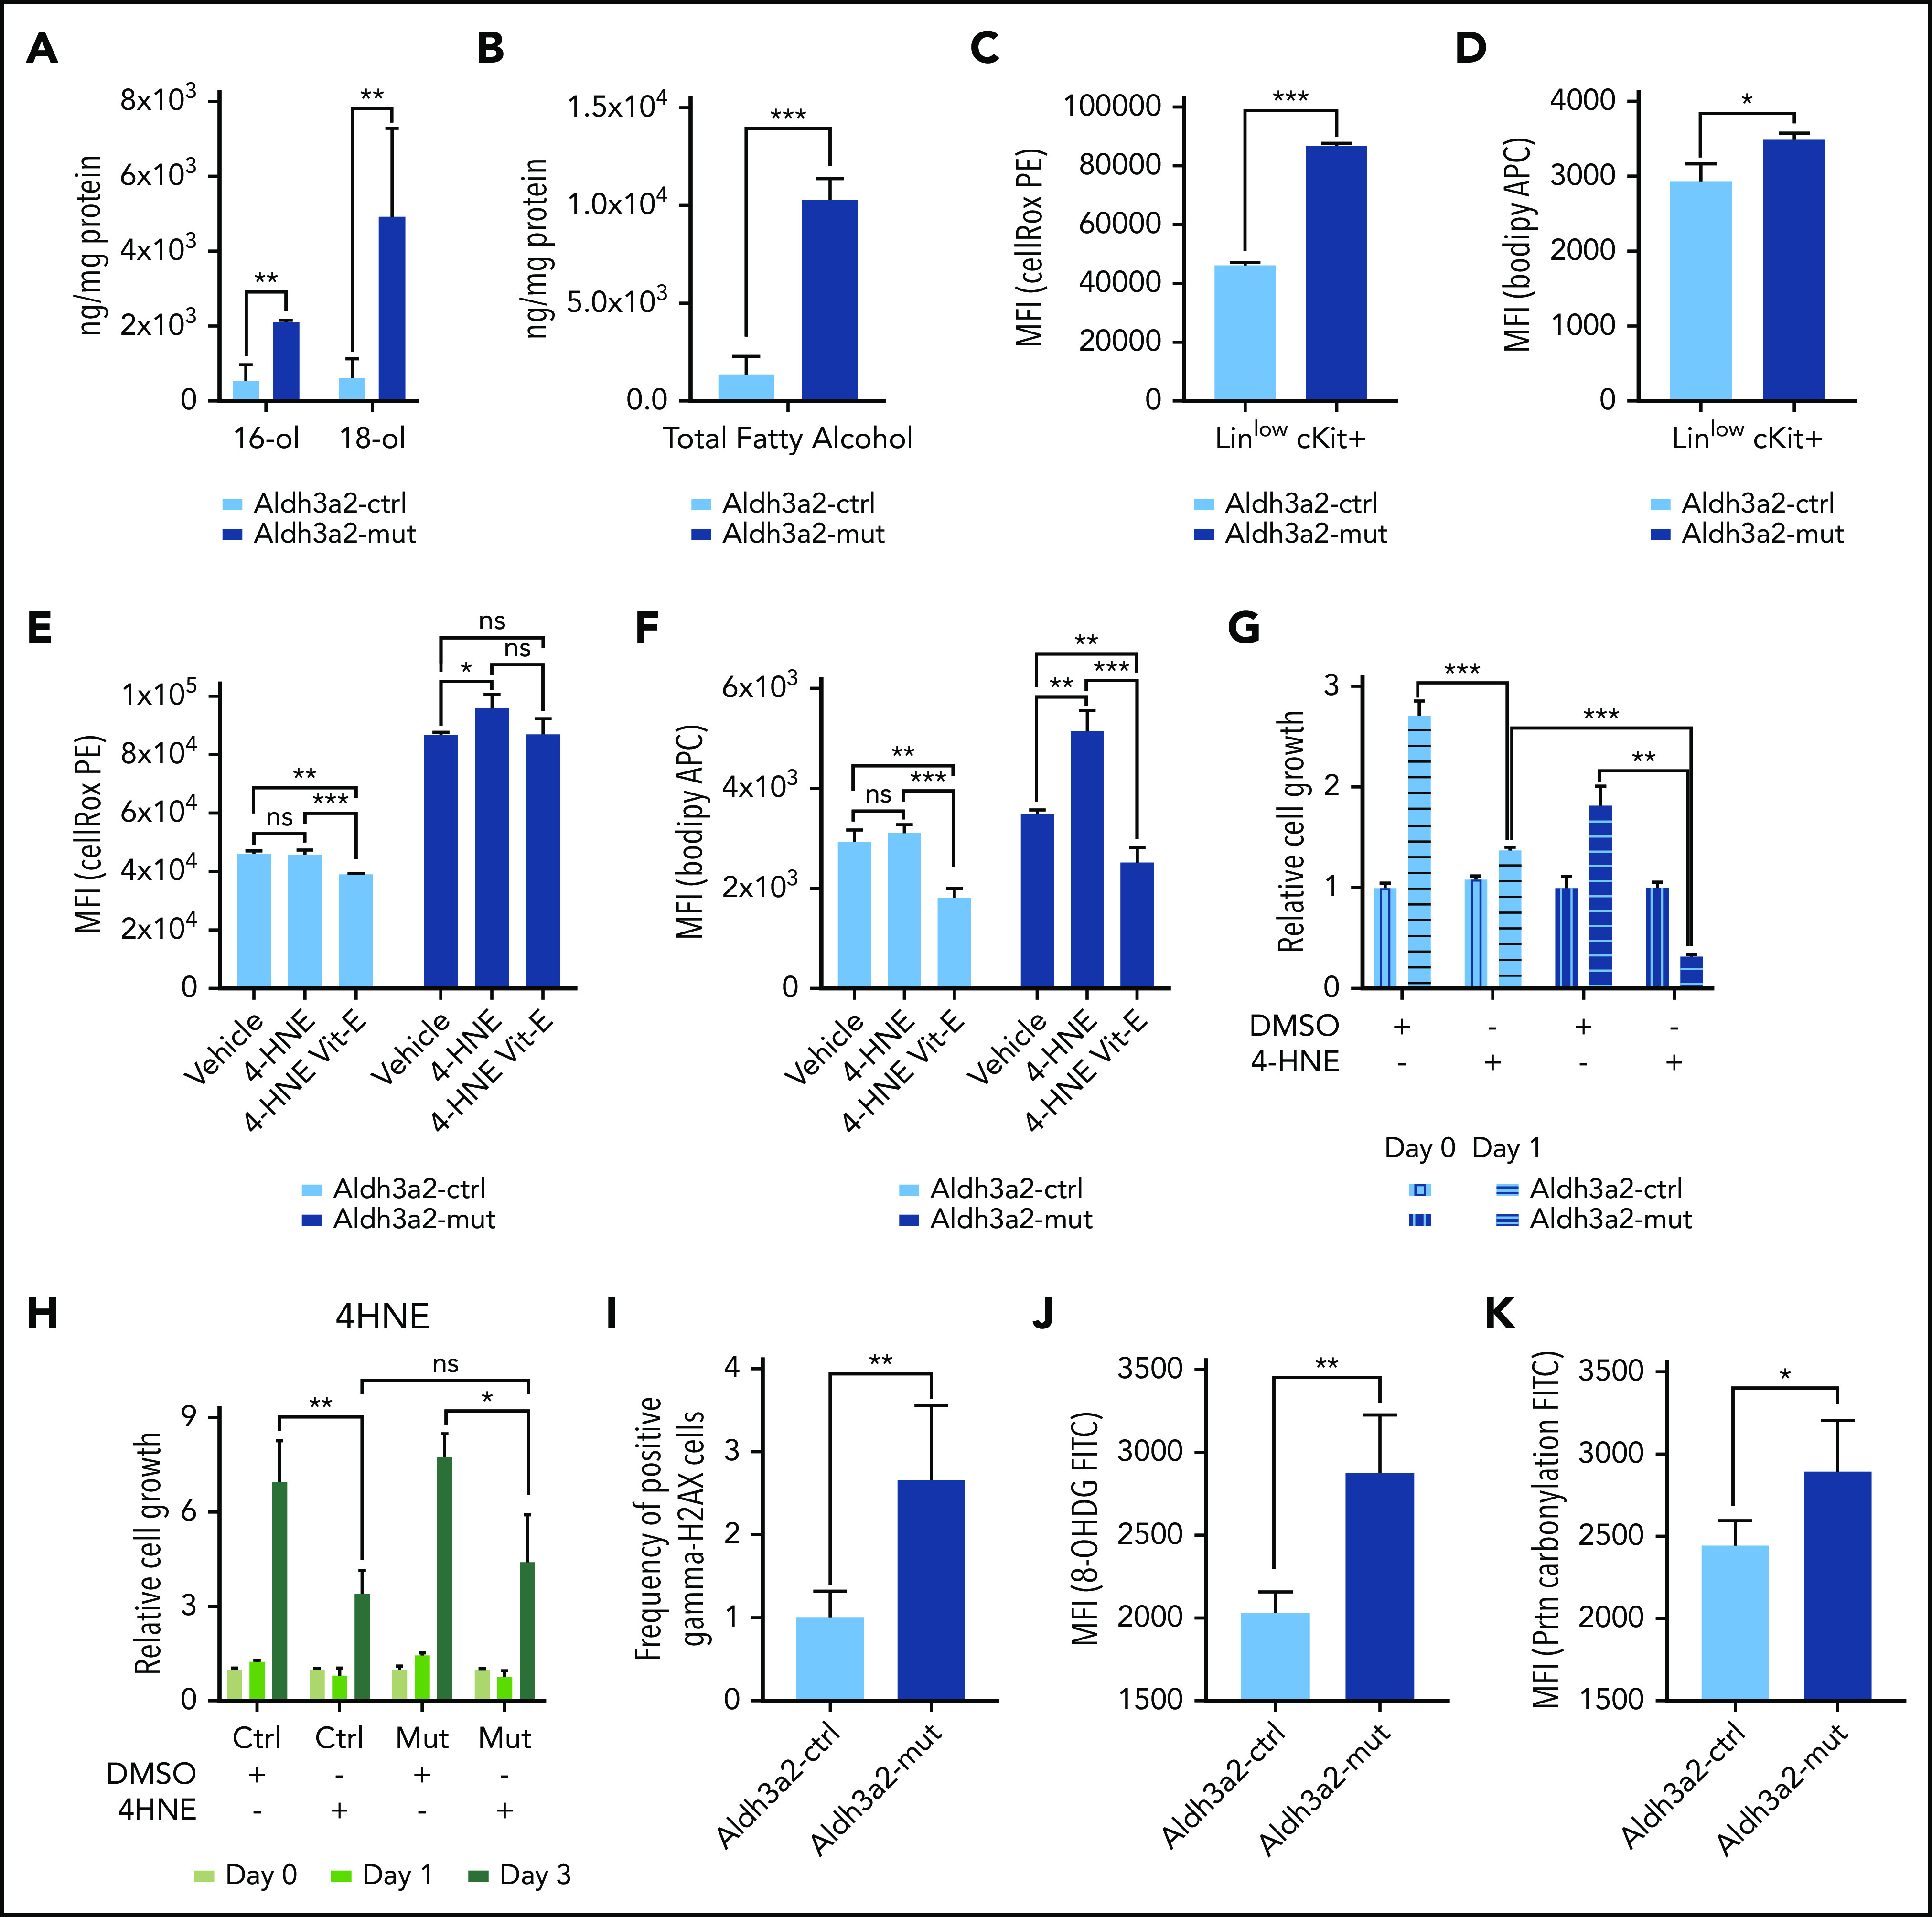
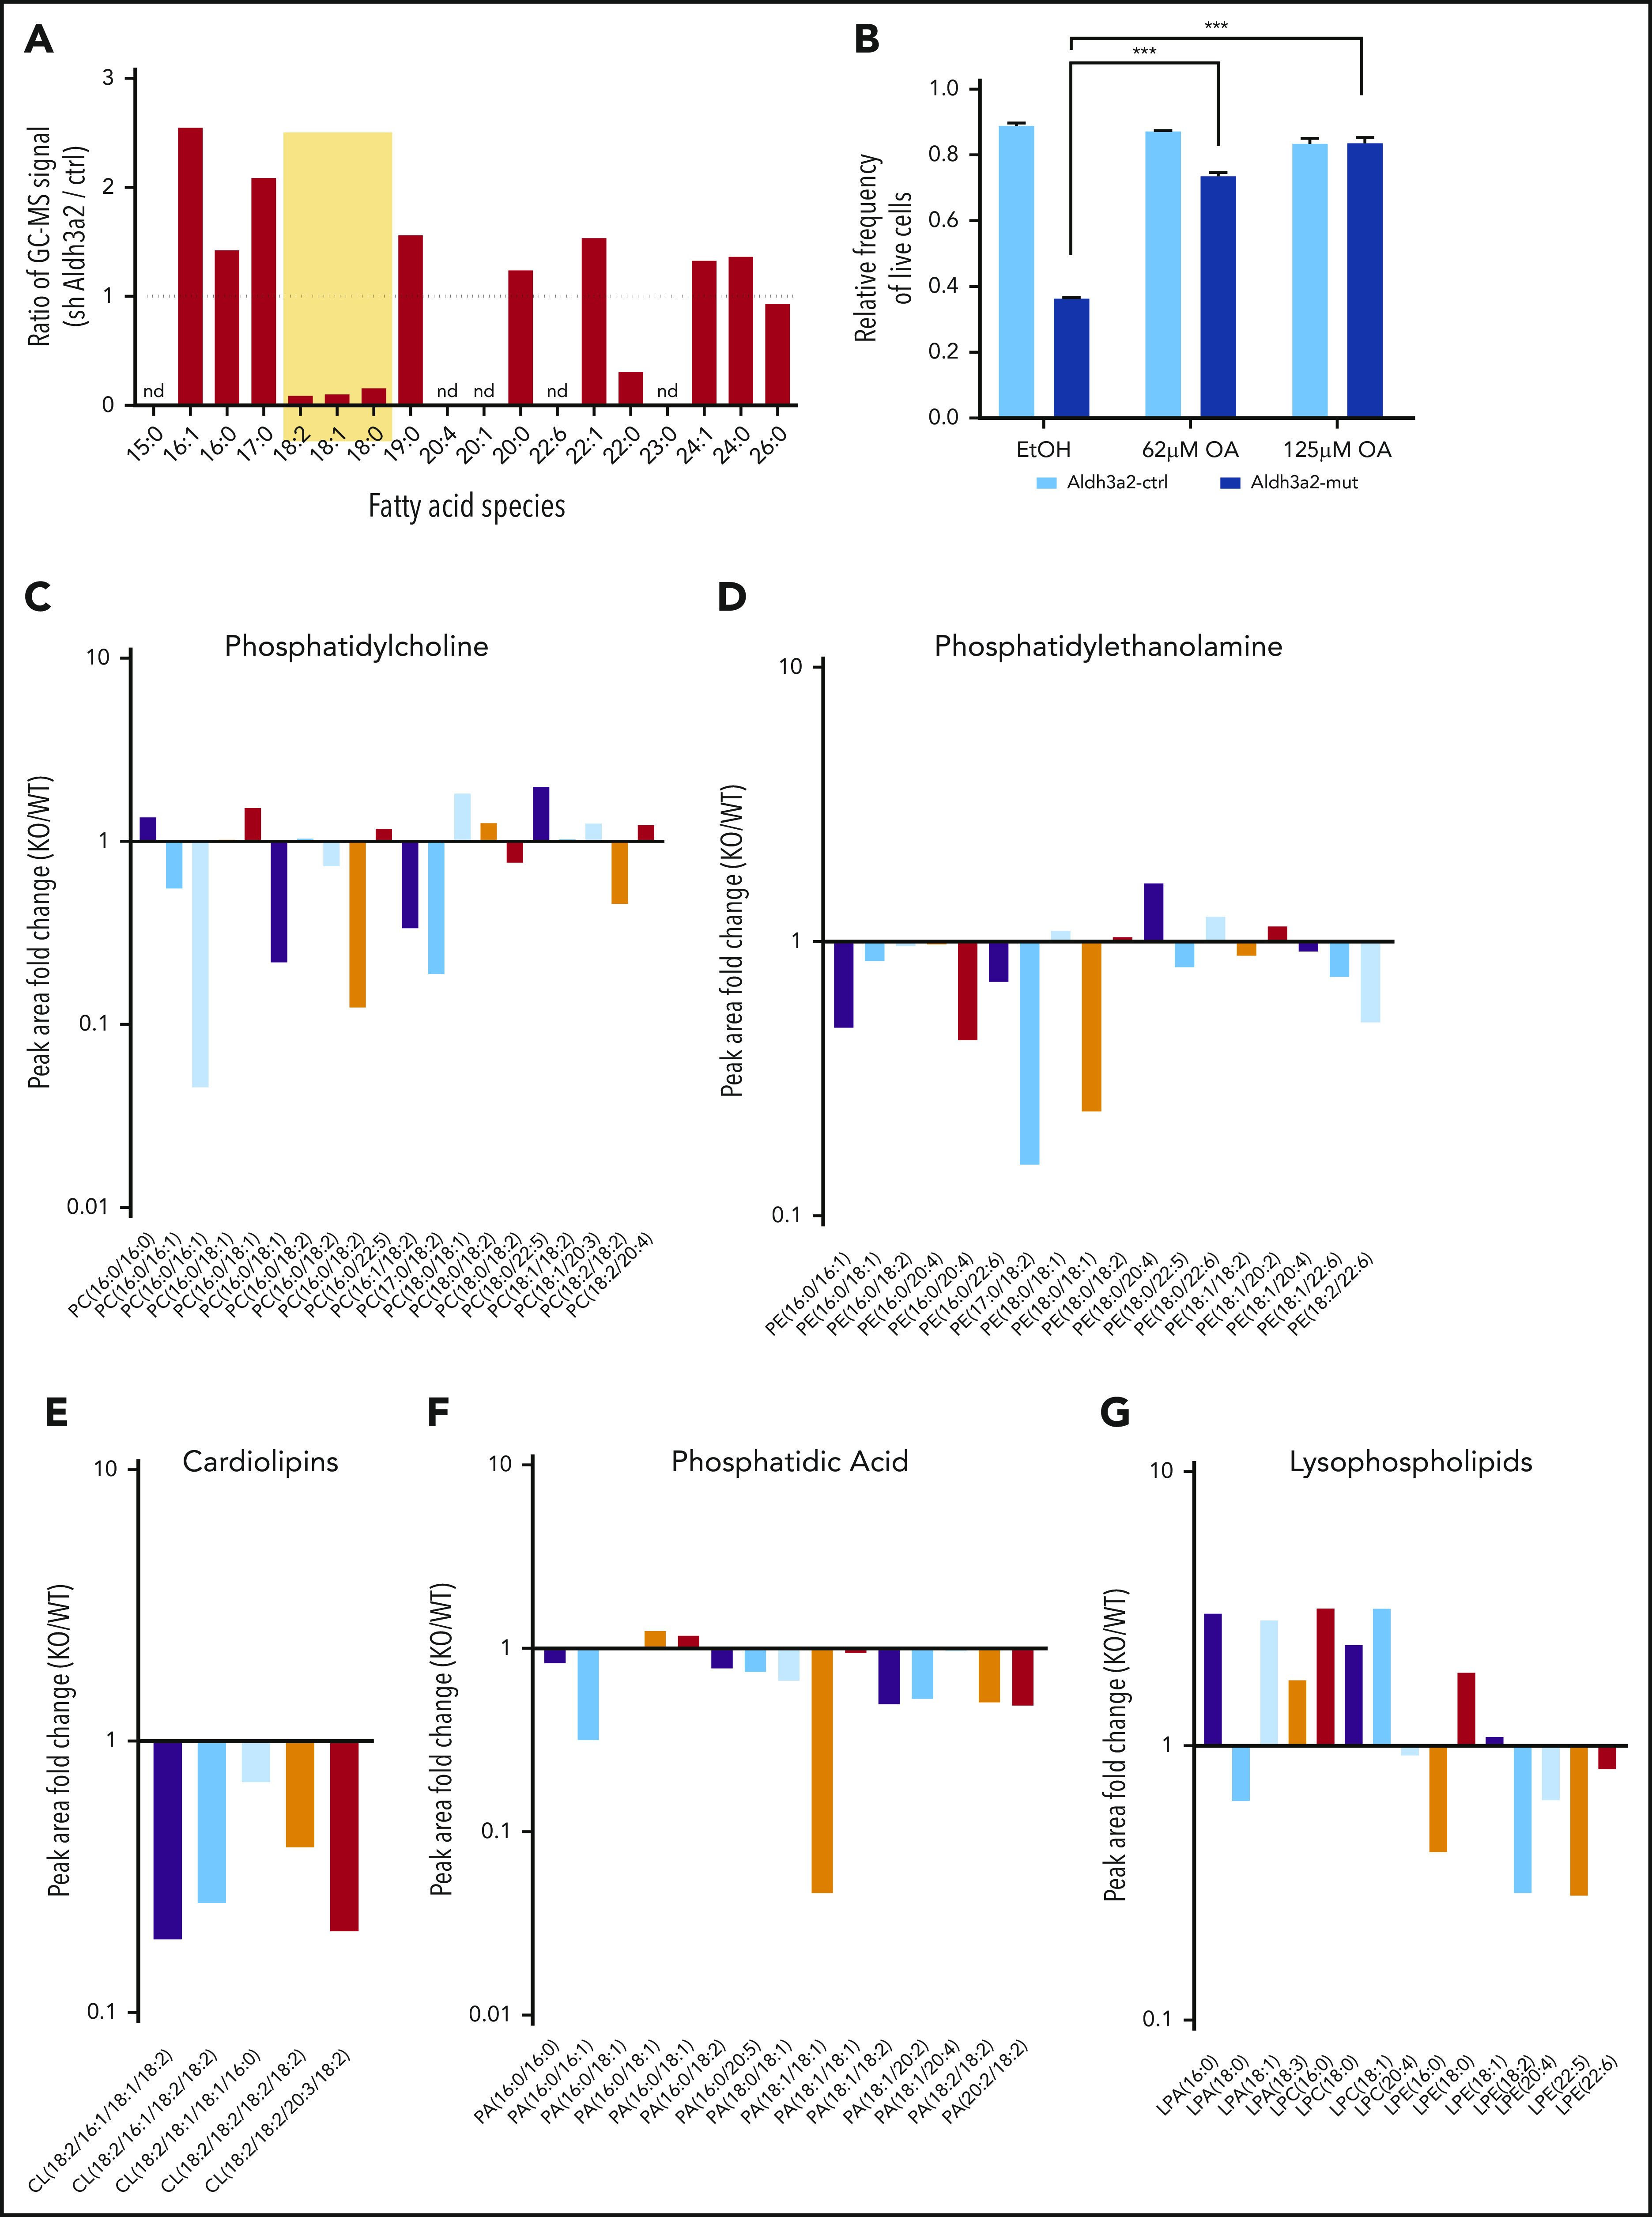
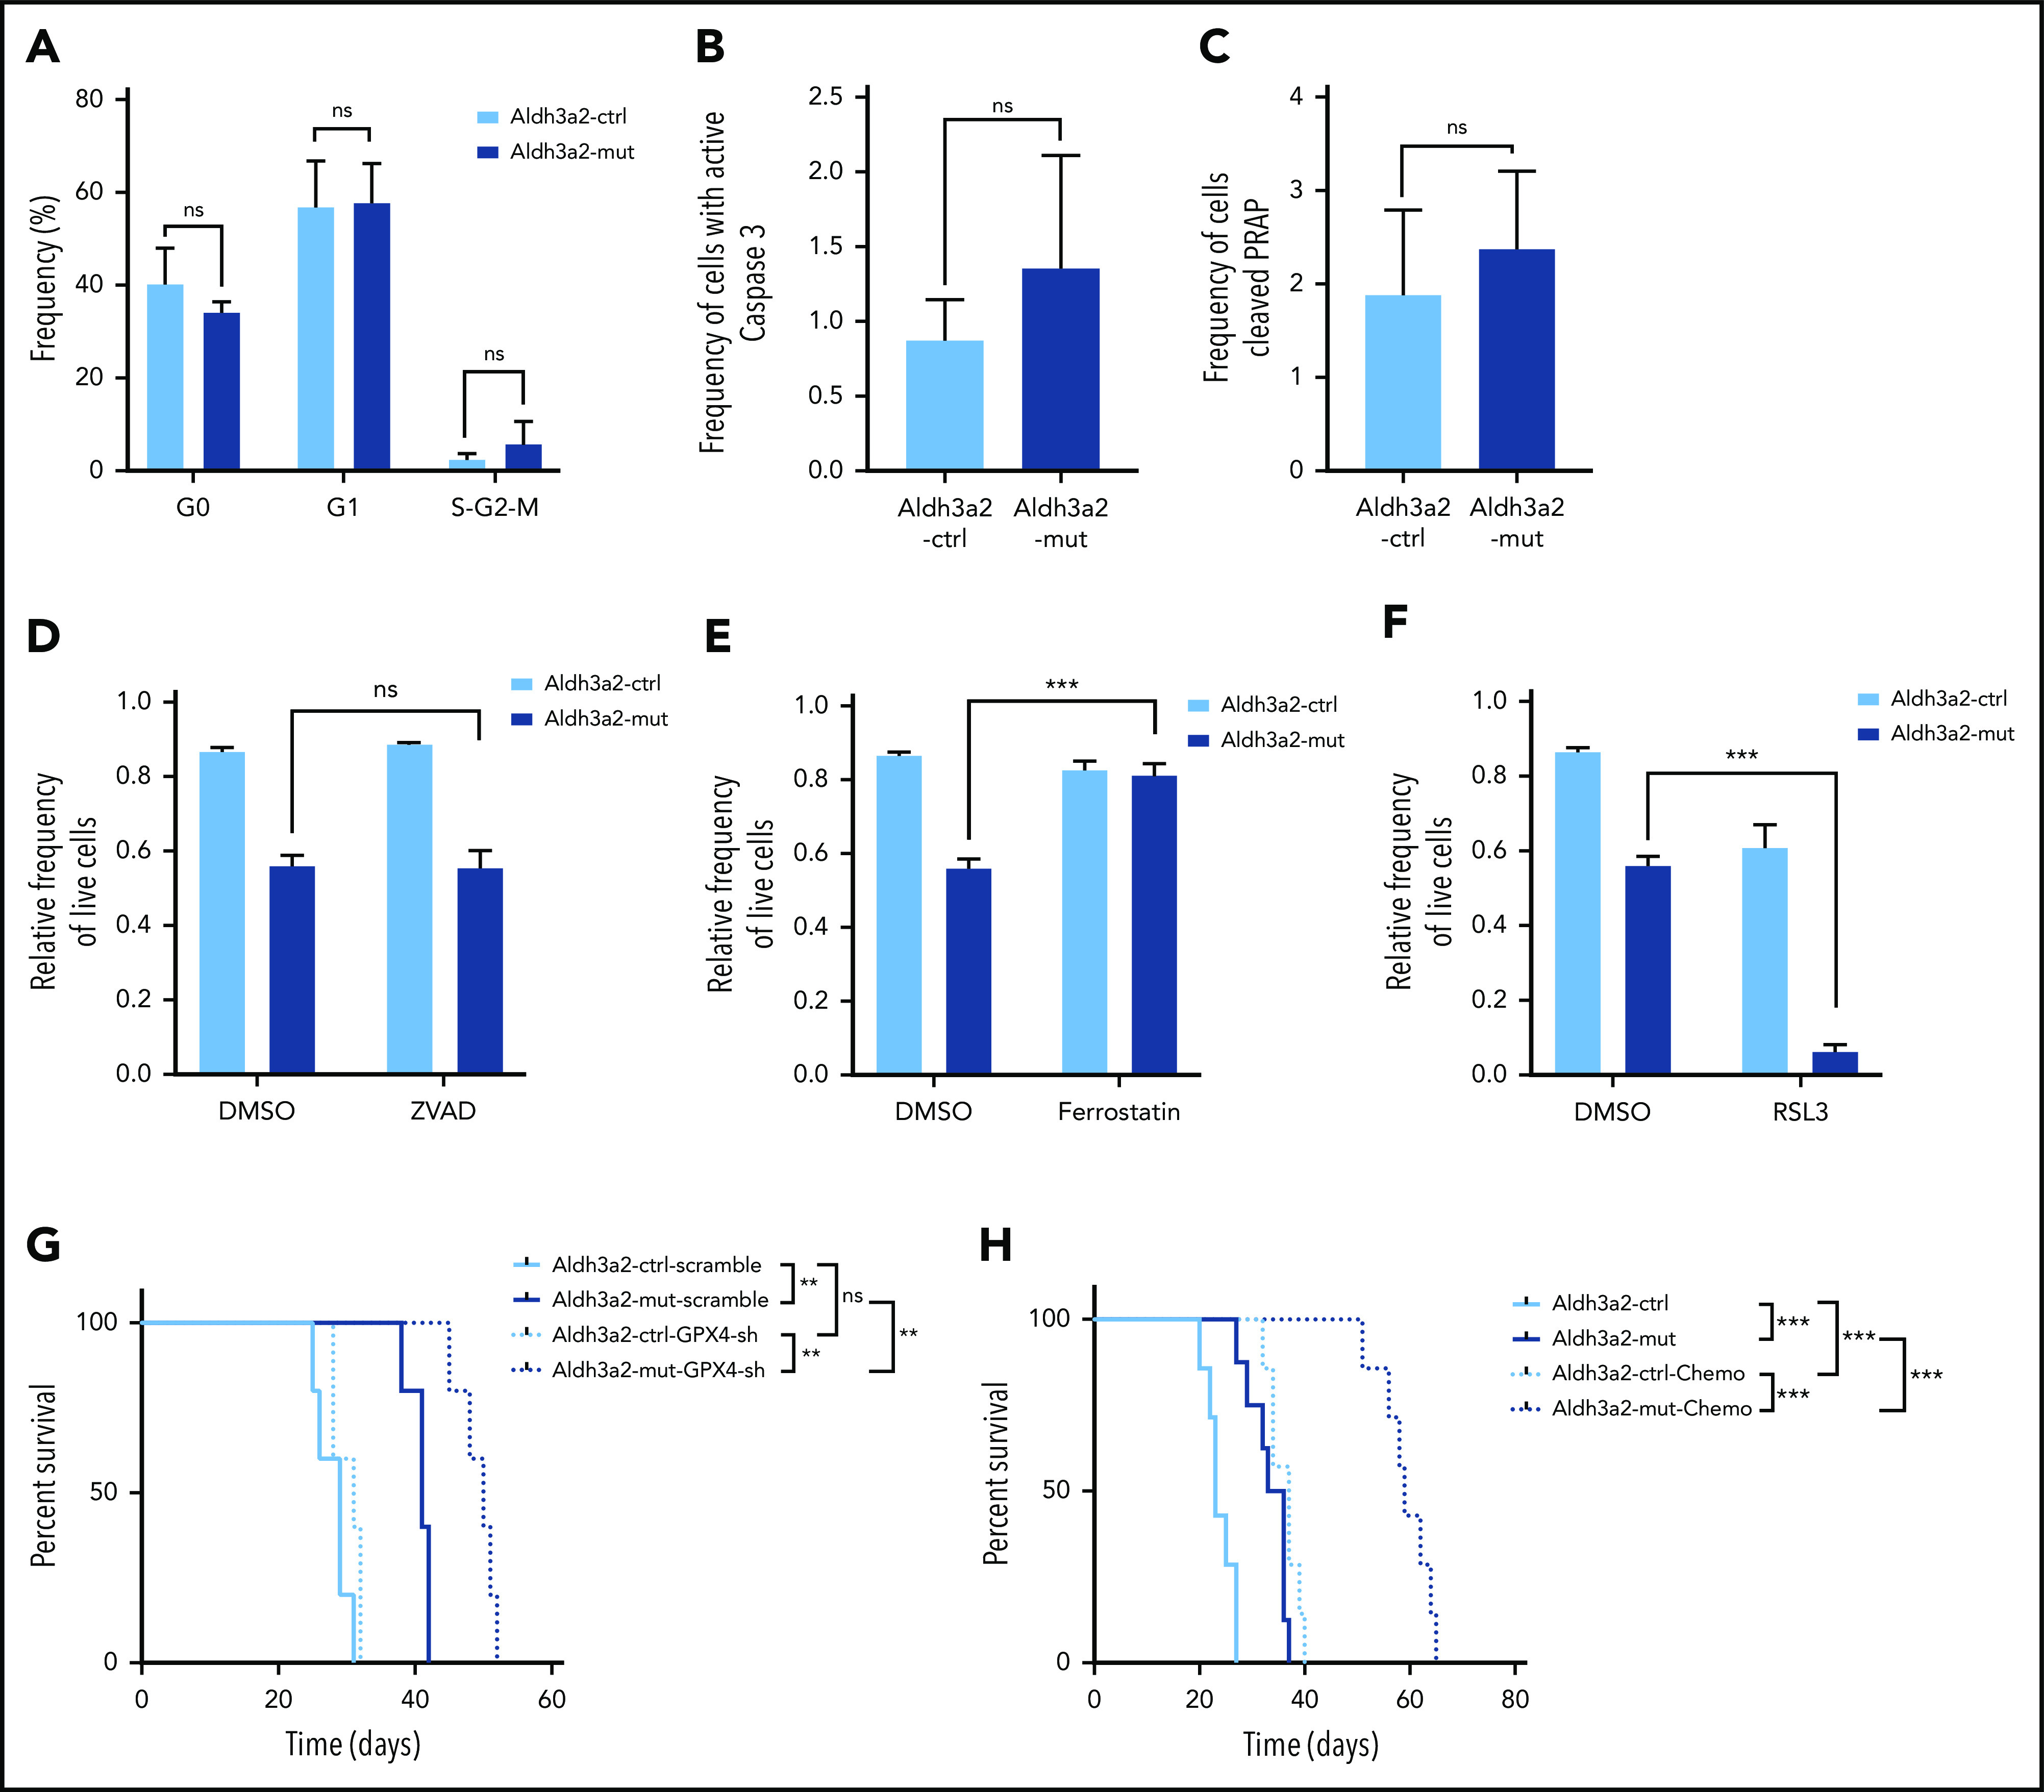
Metabolic alterations in cancer represent convergent effects of oncogenic mutations. We hypothesized that a metabolism-restricted genetic screen, comparing normal primary mouse hematopoietic cells and their malignant counterparts in an ex vivo system mimicking the bone marrow microenvironment, would define distinctive vulnerabilities in acute myeloid leukemia (AML). Leukemic cells, but not their normal myeloid counterparts, depended on the aldehyde dehydrogenase 3a2 (Aldh3a2) enzyme that oxidizes long-chain aliphatic aldehydes to prevent cellular oxidative damage. Aldehydes are by-products of increased oxidative phosphorylation and nucleotide synthesis in cancer and are generated from lipid peroxides underlying the non-caspase-dependent form of cell death, ferroptosis. Leukemic cell dependence on Aldh3a2 was seen across multiple mouse and human myeloid leukemias. Aldh3a2 inhibition was synthetically lethal with glutathione peroxidase-4 (GPX4) inhibition; GPX4 inhibition is a known trigger of ferroptosis that by itself minimally affects AML cells. Inhibiting Aldh3a2 provides a therapeutic opportunity and a unique synthetic lethality to exploit the distinctive metabolic state of malignant cells.


Conflict of interest statement

Conflict-of-interest disclosure: D.B.S. holds a patent on the use of DHODH inhibitors in the treatment of hematologic malignancies and is a cofounder of and owns equity in Clear Creek Bio. D.J.L. is an employee of Pfizer, Inc. S.M. is a founder of and scientific advisor for VOR Biopharma, founder and board member of Myeloid, and board member of SEngine. S.S. serves on the board of directors of the Genomics Institute of the Novartis Research Foundation; is a shareholder in and serves on the board of directors of Jnana Therapeutics; is a shareholder in Forma Therapeutics; is a shareholder in and advises Decibel Therapeutics and Eikonizo Therapeutics; serves on the scientific advisory boards of Eisai Co., Ltd, Ono Pharma Foundation, and F-Prime Capital Partners; and is a Novartis Faculty Scholar. D.T.S. is a director of and shareholder in Agios Pharmaceuticals; consultant for FOG Pharma; director and consultant for and shareholder in Clear Creek Bio, Editas Medicine, and Life Vault Bio; and cofounder of, director of, consultant for, and shareholder in Magenta Therapeutics and Fate Therapeutics. The remaining authors declare no competing financial interests.

Figures

None
Graphical abstract
Figure 1.
Figure 1.
Loss-of-function screen reveals metabolic vulnerabilities in MLL-AF9–driven AML. (A) Heatmap showing 45 metabolic genes overexpressed in L-GMPs as compared with N-GMPs in the retrovirus-based MLL-AF9 leukemia model. (B) Experimental workflow for the genetic depletion screen. (C) Distribution of the number of shRNA-modified L-GMPs per well relative to the number of L-GMPs per control well on the respective plate. Any gene for which ≥3 shRNAs decreased the number of L-GMPs <1.5 standard deviations (SDs) of the mean of L-GMPs in control wells, in technical duplicate, was counted as a hit as long as ≤1 shRNA decreased numbers of N-GMPs <1.5 SDs for the same gene. Aldh3a2, among all sh-RNAs, is shown in red. (D) Number of L-GMPs was decreased <1.5 SDs in 3 wells carrying independent Aldh3a2 shRNAs in the screen.
Figure 2.
Figure 2.
Aldh3a2 is essential for leukemia cells in vitro and in vivo. (A) Relative Aldh3a2 expression in L-GMPs vs N-GMPs. (B) Validation of Aldh3a2 knockdown by 2 independent shRNAs (Aldh3a2-sh-1 and Aldh3a2-sh-2 from the screen) by quantitative polymerase chain reaction. (C) Aldh3a2 knockdown with 2 independent shRNAs significantly decreases the number of L-GMPs in methylcellulose compared with L-GMPs infected with control shRNA. (D) L-GMPs were infected with shRNA Aldh3a2-sh-1, Aldh3a2-sh-2, or control and injected into sublethally irradiated C57BL6/J mice for disease development. Kaplan-Meier survival curve of animals that developed leukemia is shown. (E) Sublethally irradiated C57BL/6J mice were injected with Aldh3a2fl/fl:Mx1-Cre+ (Aldh3a2-mut) and Aldh3a2fl/fl:Mx1-Cre (Aldh3a2-ctrl) leukemia cells from primary leukemic mice. Forty-eight hours after injection of cells, mice were injected with 3 doses of polyinosinic-polycytidylic acid [Poly(I):Poly(C)] on alternate days, and leukemia development was monitored. Kaplan-Meier survival curve of animals that developed leukemia is shown. Data are representative of ≥2 independent experiments; n = 5 mice per genotype per experiment. Data are represented as mean ± standard deviation. P > .05 was considered nonsignificant. *P < .05, **P < .01, ***P < .001.
Figure 3.
Figure 3.
Aldh3a2 is dispensable for normal hematopoiesis. (A) Aldh3a2 knockdown with Aldh3a2-sh-1 shows no difference in the number of N-GMPs in methylcellulose compared with N-GMPs infected with control shRNA (n = 3 wells per group). (B) Aldh3a2−/− mice (KO) show one half of total aldehyde dehydrogenase enzyme activity in whole BM compared with Aldh3a2+/+ mice (WT). (C-E) BM analysis showing frequency of LincKit+Sca1+CD48CD150+ hematopoietic stem cells (HSCs) (C), committed myeloid progenitors (common myeloid progenitors [CMPs], granulocyte-monocyte progenitors [GMPs], and megakaryocyte-erythrocyte progenitors [MEPs]) (D), and B cells (B220+) and myeloid cells (Mac1+) (E) in Aldh3a2-WT and Aldh3a2-KO mice. (F-G) Relative peripheral blood reconstitution (F) and contribution to B cells (B220+), myeloid cells (Mac1+), and T cells (CD3+) (G) 20 weeks after transplantation of recipient B6.SJL (CD45.1) mice transfused with whole BM cells from Aldh3a2-WT or KO mice (CD45.2+) competed with equal numbers of WT CD45.1 whole BM cells (n = 10 recipients per group). Data are representative of ≥2 independent experiments; n = 3 mice per genotype per experiment. Data are represented as mean ± standard deviation. P > .05 was considered nonsignificant (ns). ***P < .001.
Figure 4.
Figure 4.
Human leukemia is sensitive to ALDH3A2 depletion. (A) ALDH3A2 expression in pretreatment AML patients with normal karyotype from the Meltezer database. (B) Overall survival in patients with high vs low ALDH3A2 expression. Data were divided into ALDH3A2-high and ALDH3A2-low patients around the median of the distribution of ALDH3A2 expression. (C) Relative ALDH3A2 expression in human AML cell lines. (D) Effective knockdown of ALDH3A2 expression in THP1 cells with 2 independent shRNAs (ALDH3A2-sh-A and ALDH3A2-sh-B) compared with control shRNA. (E) ALDH3A2 knockdown by 2 independent shRNAs decreased cell growth in 5 different AML cell lines as compared with cells infected with control shRNA. (F) ALDH3A2 knockdown by 1 or 2 independent shRNAs (depending on number of patient cells available) decreased the growth of 3 different primary AML samples as compared with cells infected with control shRNA. Data are representative of ≥2 independent experiments; n = 3 replicates per cell line per experiment. Data are represented as mean ± standard deviation. P > .05 was considered nonsignificant. *P < .05, **P < .01, ***P < .001, ****P < .0001. GAPDH, glyceraldehyde-3-phosphate dehydrogenase.
Figure 4.
Figure 4.
Human leukemia is sensitive to ALDH3A2 depletion. (A) ALDH3A2 expression in pretreatment AML patients with normal karyotype from the Meltezer database. (B) Overall survival in patients with high vs low ALDH3A2 expression. Data were divided into ALDH3A2-high and ALDH3A2-low patients around the median of the distribution of ALDH3A2 expression. (C) Relative ALDH3A2 expression in human AML cell lines. (D) Effective knockdown of ALDH3A2 expression in THP1 cells with 2 independent shRNAs (ALDH3A2-sh-A and ALDH3A2-sh-B) compared with control shRNA. (E) ALDH3A2 knockdown by 2 independent shRNAs decreased cell growth in 5 different AML cell lines as compared with cells infected with control shRNA. (F) ALDH3A2 knockdown by 1 or 2 independent shRNAs (depending on number of patient cells available) decreased the growth of 3 different primary AML samples as compared with cells infected with control shRNA. Data are representative of ≥2 independent experiments; n = 3 replicates per cell line per experiment. Data are represented as mean ± standard deviation. P > .05 was considered nonsignificant. *P < .05, **P < .01, ***P < .001, ****P < .0001. GAPDH, glyceraldehyde-3-phosphate dehydrogenase.
Figure 5.
Figure 5.
Aldh3a2 depletion alters the redox state of cells. (A-B) Levels of endogenous 16- and 18-carbon alcohols (A) as well as total alcohol levels (B) in Aldh3a2-control and -mutant leukemic cells. (C-D) Cellular ROS (C) and lipid peroxidation (D) levels in Aldh3a2-control and -mutant LSPCs (Linlowc-Kit+). (E-F) Cellular ROS (E) and lipid peroxidation levels (F) in Aldh3a2-control and -mutant LSPCs upon 4-HNE and 4-HNE plus vitamin E treatment. (G) Growth kinetics of Aldh3a2-control and -mutant LSPCs treated with 4-HNE. (H) Growth kinetics of Aldh3a2-control and -mutant N-GMPs treated with 4-HNE. (I-K) Aldh3a2-mutant leukemia cells show evidence of oxidative damage to DNA and protein as shown by increased levels of γ-H2AX (double-stranded DNA breaks) (I), 8-OHDG (oxidative DNA damage) (J), and protein carbonylation (oxidative protein damage) (K) in mutant vs control cells. Data are representative of ≥2 independent experiments; n = 3 replicates per cell line per experiment (except for measurement of alcohols, where 2 replicates were used). Data are represented as mean ± standard deviation. P > .05 was considered nonsignificant (ns). *P < .05, **P < .01, ***P < .001. DMSO, dimethyl sulfoxide; FITC, fluorescein isothiocyanate; MFI, mean fluorescence intensity.
Figure 6.
Figure 6.
Aldh3a2 depletion alters lipid metabolism in AML cells. (A) Fatty acid methyl ester analysis in L-GMPs and Aldh3a2-depleted (Aldh3a2-sh-1) L-GMPs. (B) Frequency of live Aldh3a2-control and -mutant LSPCs 3 days after culture and treatment with vehicle (EtOH) or varying concentrations of oleic acid. (C-G) Lipidomic analysis of Aldh3a2-control and -mutant leukemia cells, showing ratios (mutant/control) of major species of lipids. Linoleic acid (18:2)–containing phosphatidylcholine, phosphatidylethanolamine, cardiolipin, and phosphatidic acid species were reduced, whereas several lysophospholipids (lacking 1 fatty acid side chain after oxidation), mainly those in the lysophosphatidic acid and lysophosphatidylcholine classes, were increased. ***P < .001. nd, not determined.
Figure 7.
Figure 7.
Aldh3a2 depletion causes death by ferroptosis. (A) Assessment of cell cycle in Aldh3a2-control and -mutant leukemia cells reveals no differences. (B-C) Caspase 3 activation (B) and PARP cleaveage (C) in Aldh3a2-mutant vs -control LSPCs. (D-F) Frequency of live Aldh3a2-control and -mutant LSPCs 3 days after culture and treatment with vehicle (dimethyl sulfoxide [DMSO]) or the pancaspase inhibitor ZVAD (D), the ferroptosis inhibitor ferrostatin (E), or the GPX4 inhibitor RSL3 (F). (G) Sublethally irradiated C57BL/6J mice were injected with Aldh3a2-control and -mutant leukemia cells from primary leukemic mice infected with lentivirus expressing Gpx4 or scrambled shRNA. Forty-eight hours after injection, mice were injected with 3 doses of polyinosinic-polycytidylic acid [Poly(I):Poly(C)] on alternate days, and leukemia development was monitored. Kaplan-Meier survival curve of animals that developed leukemia is shown. (H) Sublethally irradiated C57BL/6J mice were injected with Aldh3a2-control and -mutant leukemia cells from primary leukemic mice. Forty-eight hours after injection, mice were treated with 3 doses of Poly(I):Poly(C) on alternate days and with cytarabine and doxorubicin in a 5 + 3 regimen. Leukemia development was monitored. Kaplan-Meier survival curve of animals that developed leukemia is shown. Data are representative of ≥2 independent experiments; n = 3 replicates per cell line per experiment. Data are represented as mean ± standard deviation. P > .05 was considered nonsignificant (ns). **P < .01, ***P < .001.

References

    1. Sancho P, Barneda D, Heeschen C. Hallmarks of cancer stem cell metabolism. Br J Cancer. 2016;114(12):1305-1312. - PMC - PubMed
    1. Vander Heiden MG, Cantley LC, Thompson CB. Understanding the Warburg effect: the metabolic requirements of cell proliferation. Science. 2009;324(5930):1029-1033. - PMC - PubMed
    1. Eppert K, Takenaka K, Lechman ER, et al. . Stem cell gene expression programs influence clinical outcome in human leukemia. Nat Med. 2011;17(9):1086-1093. - PubMed
    1. Gentles AJ, Plevritis SK, Majeti R, Alizadeh AA. Association of a leukemic stem cell gene expression signature with clinical outcomes in acute myeloid leukemia. JAMA. 2010;304(24):2706-2715. - PMC - PubMed
    1. Grubovikj RM, Alavi A, Koppel A, Territo M, Schiller GJ. Minimal residual disease as a predictive factor for relapse after allogeneic hematopoietic stem cell transplant in adult patients with acute myeloid leukemia in first and second complete remission. Cancers (Basel). 2012;4(2):601-617. - PMC - PubMed

Publication types

MeSH terms