. 2020 Jun;21(3):201-224.
doi: 10.1007/s10162-020-00757-0. Epub 2020 May 26.

Information Processing by Onset Neurons in the Cat Auditory Brainstem

Affiliations

Information Processing by Onset Neurons in the Cat Auditory Brainstem

Alberto Recio-Spinoso et al. J Assoc Res Otolaryngol. 2020 Jun.

Abstract

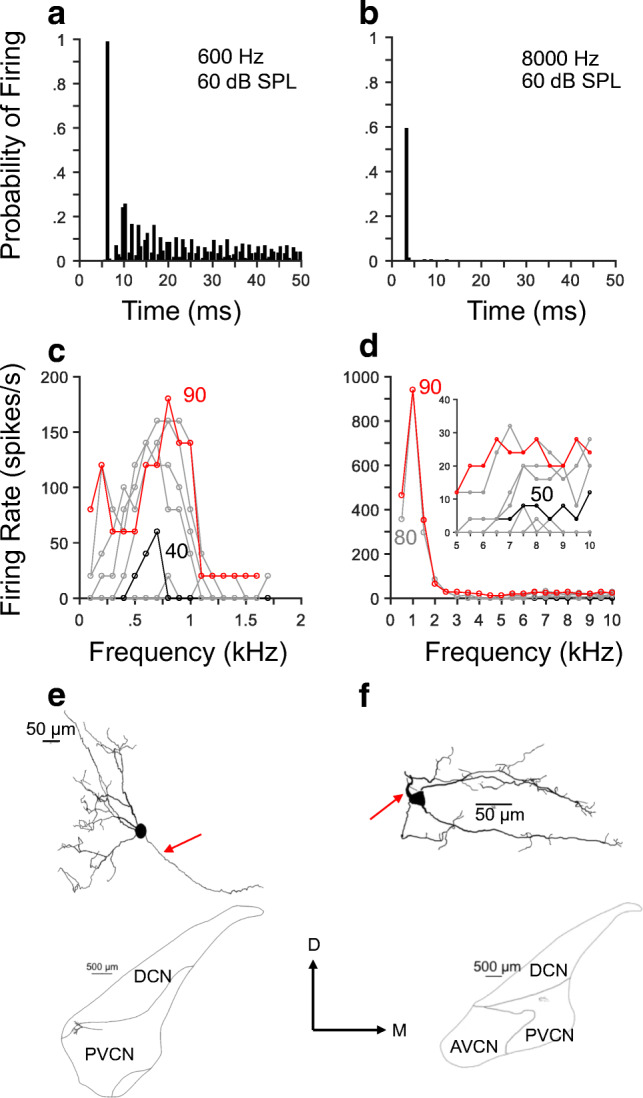
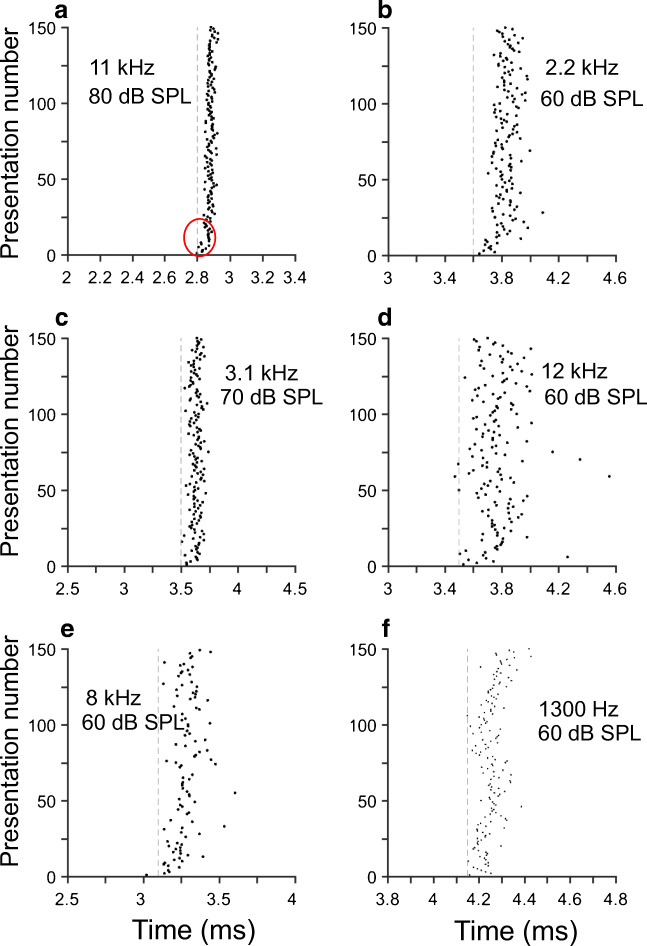
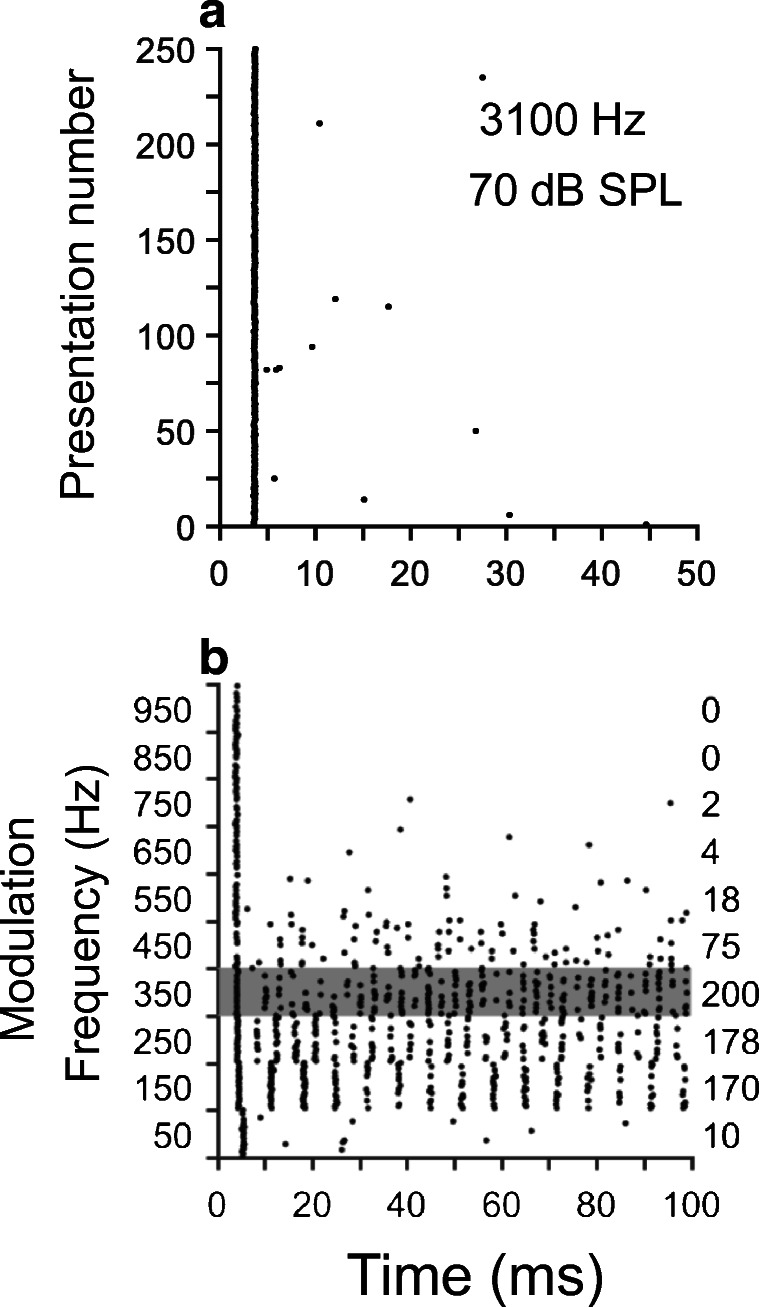
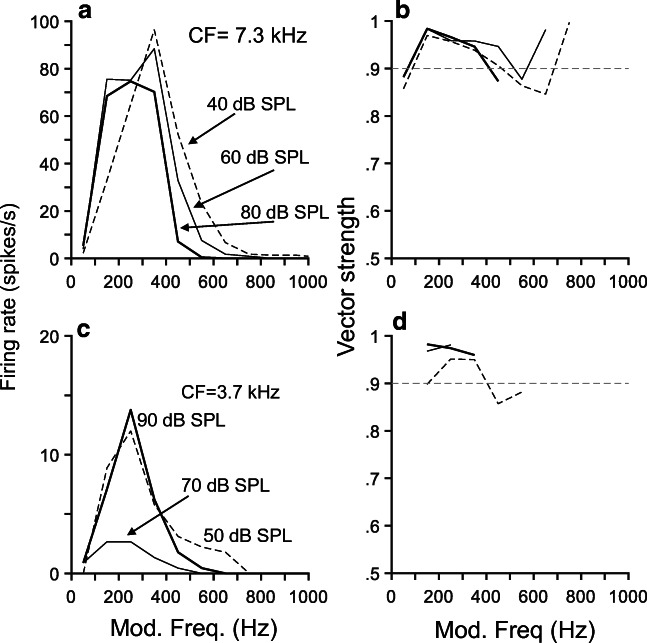
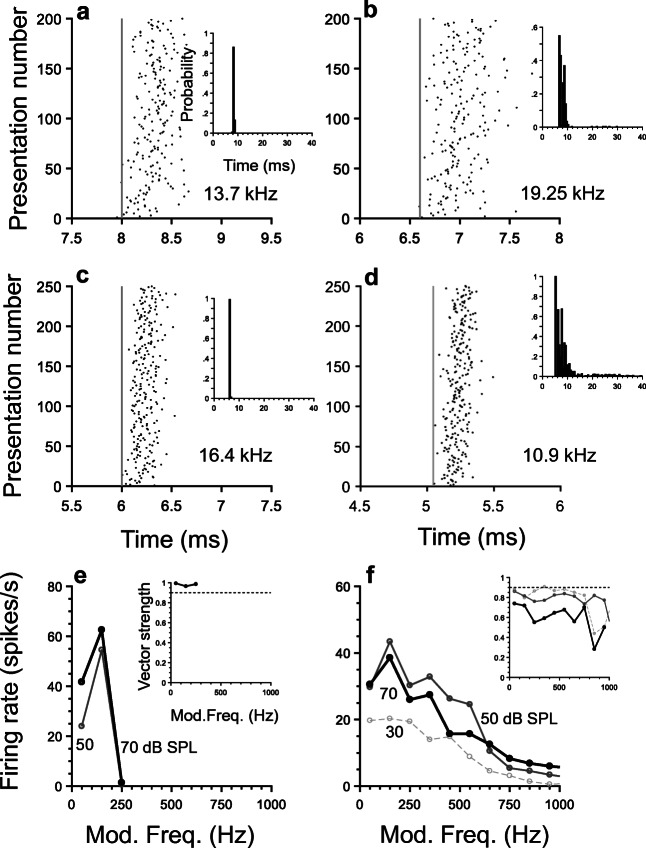
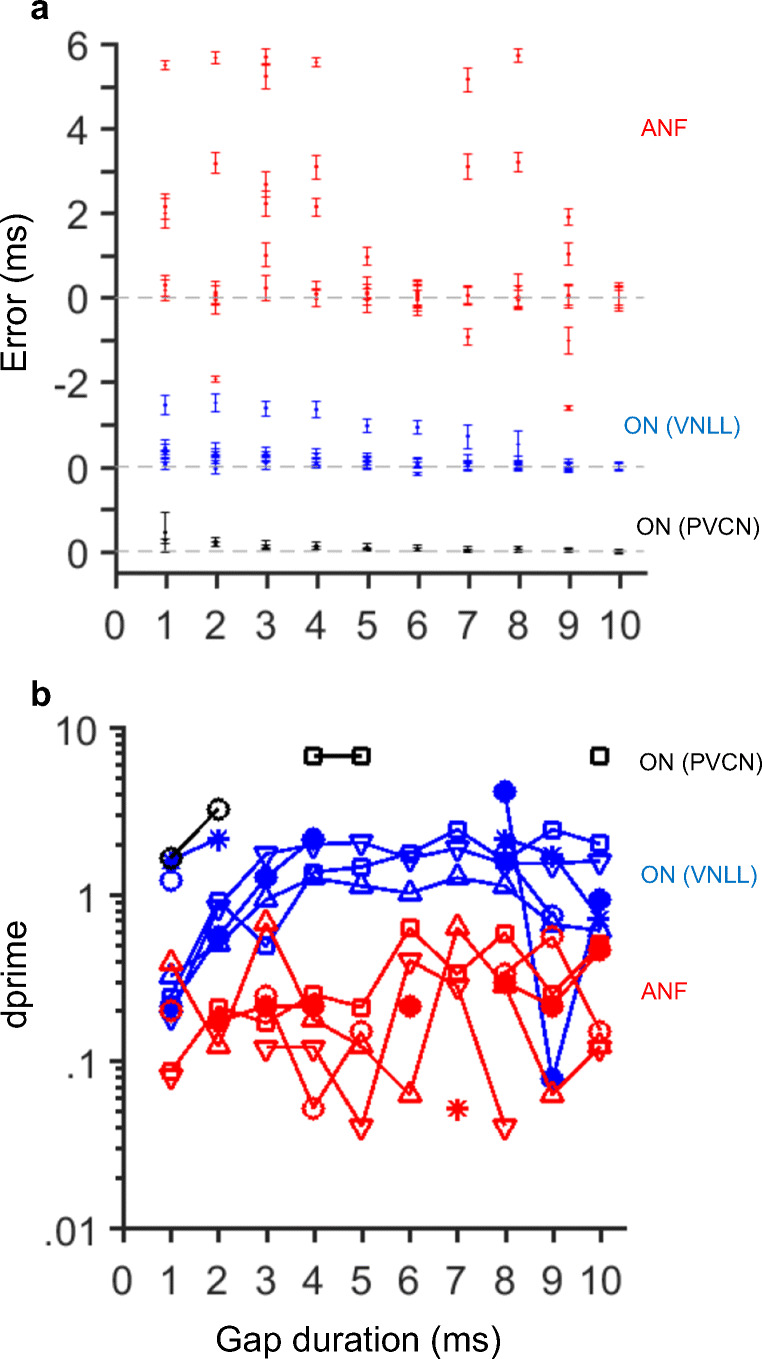
Octopus cells in the ventral cochlear nucleus (VCN) have been difficult to study because of the very features that distinguish them from other VCN neurons. We performed in vivo recordings in cats on well-isolated units, some of which were intracellularly labeled and histologically reconstructed. We found that responses to low-frequency tones with frequencies < 1 kHz reveal higher levels of neural synchrony and entrainment to the stimulus than the auditory nerve. In responses to higher frequency tones, the neural discharges occur mostly near the stimulus onset. These neurons also respond in a unique way to 100 % amplitude-modulated (AM) tones with discharges exhibiting a bandpass tuning. Responses to frequency-modulated sounds (FM) are unusual: Octopus cells react more vigorously during the ascending than the descending parts of the FM stimulus. We examined responses of neurons in the ventral nucleus of the lateral lemniscus (VNLL) whose discharges to tones and AM sounds are similar to octopus cells. Repeated stimulation with short tone pips of VCN and VNLL onset neurons evokes trains of action potentials with gradual shifts toward later times in their first spike latency. This behavior parallels short-term post-synaptic depression observed by other authors in in vitro VCN recordings of octopus cells. VCN and VNLL onset units in cats respond to frozen noise stimuli with gaps as narrow as 1 ms with a robust discharge near the stimulus onset following the gap. This finding suggests that VCN and VNLL onset cells play a role in gap detection, which is of great importance to speech perception.

Keywords: cochlear nucleus; gap detection; synaptic plasticity; temporal processing; ventral nucleus of the lateral lemniscus.


Conflict of interest statement

The authors declare that they have no competing interests.

Figures

Fig. 1
Fig. 1
Responses to tones of octopus cells exhibit onset with L-shaped (OL) and I-shaped (OI) patterns. Panels a and b display histograms of responses (PSTHs) of two octopus cells (a L108, u14; b L102, u6) to near-CF tones. Ordinates represent probability of firing an action potential in a 500-μs window. (Stimulus duration = 50 ms, repetition period = 200 ms, number of stimulus presentations = 250.) Panels c and d show response areas (RAs) of neurons whose PSTHs are shown in panels a and b, respectively. Stimulus duration = 50 ms, repetition period = 250 ms, number of stimulus presentation = 1. Inset in panel d displays the RA at a smaller frequency range than the one in the main panel. Histological reconstruction of neurons in A and B are displayed in panels e and f, respectively. Arrows in e and f point to the axons. Insets below reconstructions in e and f show locations of the respective octopus cells in coronal sections. DCN, dorsal cochlear nucleus; AVCN, anteroventral cochlear nucleus; PVCNCN, posteroventral cochlear nucleus. Horizontal lines with the number above them in e and f indicate a length in micrometers
Fig. 2
Fig. 2
Octopus cells display primary-like patterns in responses to low-frequency tones. Panel a shows a PSTH of the responses of a neuron to a near-CF low-frequency tone. Panel b displays a PSTH with an onset pattern obtained from responses to a high-frequency tone. A: L84, u27; B: L100, u14. Panels cf are similar to those shown in Fig. 1cf
Fig. 3
Fig. 3
Response patterns of two onset units. Panels a and b show RAs obtained from responses of two high-CF onset neurons. (a L102, u24; b L116, u13.) Insets in a and b display RA curves during a smaller frequency range of stimulation. Panels c and e exhibit dot raster plots obtained from responses of the same neuron in panel a to a 2.2-kHz (=CF) and an 800-Hz tone, respectively. Inset in c contain a PSTH obtained from the same responses as in the main panel. Panels d and f show responses similar to c and e, but from the neuron in panel b
Fig. 4
Fig. 4
Onset units entrain to tonal stimuli of up to 1 kHz. Panels a and b display dot raster plots of the responses to 1-kHz tones of two high-CF units. a L77, u14; b L102, u6. Panel c shows a scatter plot of vector strength vs. frequency. Panel d exhibits a scatter plot of entrainment index as a function of stimulus frequency. Results in panels c and d were computed during the [3 ms, 20 ms] time interval. Filled and open symbols in panel e represent vector strength values computed during the [5 ms, 15 ms] and [35 ms, 45 ms] intervals, respectively. Results in panel f are organized as in panel e, but using entrainment indices
Fig. 5
Fig. 5
Receptive fields of ANFs are narrower than those of a typical onset unit. Panel a displays tuning curves (iso-response curves vs. frequency) of one onset unit (black line with filled symbol) and several ANFs (lines with open symbols) of similar CFs. Panel b shows same information as in panel a but with normalized thresholds and CFs
Fig. 6
Fig. 6
Shifts in first-spike latencies in onset unit responses. Panels display dot raster plots of onset units’ responses to near-CF tones around the onset of stimulation. a L100, u14; b L1024, u24: c L116, u9; d L64, u11; e L102, u6; f WH14, u14. Dashed lines are located at arbitrary times to highlight shifts in first-spike latencies. Stimulus frequencies and levels are indicated in each panel
Fig. 7
Fig. 7
Shifts in first-spike latencies in onset unit responses to low-frequency stimuli. Panel a exhibit a dot raster plot of the response of a high-CF unit (CF = kHz) to a low-frequency tone (1-kHz, 80-dB SPL). Red oval in that panel points to a shift in FSLs. Panel B displays the same data (L102, u6) as in panel B but spike times are expressed relative to a period of the stimulus frequency. Panels cf are similar to panel B but for other onset units. c L116, u13; d WH35, u9; e L84, u27; f L110, u14
Fig. 8
Fig. 8
Asymmetry in onset-unit responses to frequency-modulated tones. Panels ae display histograms of onset unit responses to search stimuli (FM sweeps). a L105, u28; b L102, u6; c L116, u9; d L112, u18; e L102, u24. Left and right halves of the abscissae indicate upper and downward instantaneous frequency values, respectively. Red numbers in panel A indicate stimulus time. Stimulus level was 75-dB SPL for all the results in panels ae. Panel f shows a scatter plot of symmetry index as a function of CF at three stimulus levels indicated in the plot
Fig. 9
Fig. 9
Responses to amplitude-modulated (AM) stimuli. Panel a contains a dot raster plot of the responses of an onset unit to a near-CF tonal stimulus. Panel b displays responses to AM stimuli of the same neuron shown in panel a. Responses in b are in the form of dot raster plots, 25 stimulus presentations per modulation frequency. The duration of the AM stimuli was 100 ms, presented every 200 ms with a carrier level equal to 60-dB SPL. Spike counts in the right of panel b were performed in the [6 ms, 100 ms] interval
Fig. 10
Fig. 10
Rate (rMTF) and temporal (tMTF) modulation transfer functions exhibit bandpass and nearly flat patterns, respectively. Panels a and c display rMTFs obtained from responses of two onset cells to AM stimuli. a L116, u9; c L77, u 14. tMTFs in panels b and d were obtained from the same responses for which rMTFs are shown in a and d, respectively. Intensities (dB SPL) in panels a and c represent carrier levels. The analysis time window was [10 ms, 100 ms]
Fig. 11
Fig. 11
Properties of tMTFs and rMTFs as a function of CF. Panel a displays a scatter plot of bandwidth of tMTFs as a function of CF for three stimulus levels indicated in the plot. Panel b, which is similar to panel a, displays best modulation frequencies vs. CF. Correlation coefficients, r, of the linear fits to the data (blue symbols, 30-dB SPL; black symbols, 50-dB SPL) are indicated in the plot
Fig. 12
Fig. 12
Onset unit responses to frozen noise stimuli display similar patterns across stimulus presentations. Panels a and c display dot raster plots of the responses of two ANFs to frozen samples of white noise. Similarly, results in b were obtained from two onset units. Panels e and f display dot raster plots of responses of an ANF and an onset unit, respectively, to narrowband noise stimuli (bandwidth = 200 Hz) centered at CF. a ICSP17, u6; b ICSP17, u4; c ICSP17, u9; d S0425, u4; e WH11, u84; f WH14, u14
Fig. 13
Fig. 13
Response properties of onset units in the ventral nucleus of the lateral lemniscus. Panels ad display dot raster plots of onset-unit responses to near CF 60-dB SPL tones. a VNLL21, u3; b VNLL35, u30; c VNLL20, u20; d ICSP8, u14. Vertical dashed lines are for reference only. Insets show the corresponding PSTHs. Panels e and f (same neurons as in c and d, respectively) exhibit rMTFs at three SPL levels for two onset cells. Insets in those panels contain the corresponding tMTFs
Fig. 14
Fig. 14
Temporal analysis of onset-unit responses to frozen noise. Panel a displays normalized SACs computed from responses to frozen noise samples. Thin and thick black (gray) lines depicts SACs computed from responses to broadband (narrowband) noise of four PVCN onset units. Blue line displays a SAC obtained from responses to broadband noise of a VNLL onset unit. Red lines continuous (dashed) lines show SACs from responses to broadband (narrowband) noise of ANFs. Panel b shows a scatter plot of CIs as a function of CF. Filled squares represent CIs obtained from responses of PVCN onset units to frozen noise samples (black and gray symbols originate from responses to broadband and narrowband noises, respectively). Filled circles display CIs for VNLL onset units. Filled and open triangles indicate CI values obtained from ANF responses to broadband and narrowband noises, respectively
Fig. 15
Fig. 15
Spectro-temporal receptive field (STRF) analysis reveals tuning characteristics of onset units. Panel a displays pre-event stimulus ensembles (PESEs) obtained from the response envelopes of an ANF (red line) and a PVCN and a VNLL onset units (black and blue lines, respectively). Panel b shows Fourier transform amplitudes of the corresponding PESE envelopes in a. STRF analyses of the responses to noise of the units whose PESEs appear in a are displayed in panels ce. Scatter plots of CFs estimated from peak STFRs (CFnoise) plotted against CFs estimated from responses to tones (CFtones) are shown in panel f. c ICSP17, u12; d ICSP17, u4; e ICSP08, u14
Fig. 16
Fig. 16
Onset-unit responses to gaps in noise stimulus reveal differences in temporal resolution over auditory nerve fiber processing of the same sounds. Panels a and c show dot raster plots of the responses of two onset units to frozen broadband noise stimuli with gaps of duration indicated in the y-axis. Fifty stimuli were presented per gap duration. Red dashed lines indicate the location of the mean first-spike latency following the gap whose starting point is indicated by the gray vertical line. ANF responses to the same noise stimulus paradigm used in a and c are shown in panels b and d. PSTHs in panels e and f were obtained from the spike trains in panels c and b, respectively, for gap durations (1, 2, and 3 ms) indicated in the panels. Red arrows in e and f point to the corresponding locations in panels c and b, respectively, indicated by red vertical lines. Time 0 in all the plots indicates the beginning of the gap. a ICSP17, u4; b ICSP17, u9; c S0425, u4; d ICSP17, u7
Fig. 17
Fig. 17
Temporal processing by onset units in the VNLL and CN is similar. Panels ad show dot raster plots of the responses of four VNLL onset units to frozen noise stimulus with gaps of duration indicated in the y-axis. Fifty stimuli were presented per gap duration. Red dashed lines indicate the location of the largest peak in the PSTH (see text) following the gap whose starting point is indicated by the gray vertical line. PSTHs in panels e and f were obtained from the spike trains in panels a and b, respectively, for gap durations (1, 2, and 3 ms) indicated in the panels. Red arrows in e and f point to the corresponding locations in panels a and b, respectively, indicated by red vertical lines. Time 0 indicates the beginning of the gap
Fig. 18
Fig. 18
Onset units encode start of stimulus after a brief gap better than ANFs. Panels af display scatter plots the of the estimated onset time following a stimulus gap as a function of gap duration. Each symbol in the graph indicates the mean first-spike latency (± standard deviation) following a gap. Neuron type is indicated in each panel
Fig. 19
Fig. 19
Gap detection thresholds are lower for onset units than for ANFs. Panel a displays errors in FSL estimates following the gap as a function of gap duration for the sample of ANFs (red symbols), PVCN onset units (black symbols) and VNLL onset units (blue symbols). Panel b shows detectability functions as a function of gap duration for the collection of units

References

    1. Abramson AS, Whalen DH. Voice onset time (VOT) at 50: theoretical and practical issues in measuring voicing distinctions. J Phon. 2017;63:75–86. - PMC - PubMed
    1. Adams JC. Projections from octopus cells of the posteroventral cochlear nucleus to the ventral nucleus of the lateral lemniscus in cat and human. Auditory Neurosci. 1997;3:335–350.
    1. Aertesen AMHJ, Johannesma PIM. Spectro-temporal receptive fields of auditory neurons in the grassfrog. Biol Cybernetics. 1980;38:223–234. - PubMed
    1. Aitkin LM, Anderson DJ, Brugge JF. Tonotopic organization and discharge characteristics of single neurons in nuclei of the lateral lemniscus of the cat. J Neurophysiol. 1970;33:421–440. - PubMed
    1. Batra R, Fitzpatrick DC. Discharge patterns of neurons in the ventral nucleus of the lateral lemniscus of the unanesthetized rabbit. J Neurophysiol. 1999;82:1097–1113. - PubMed

Publication types

LinkOut - more resources