. 2020 Jun;472(6):693-710.
doi: 10.1007/s00424-020-02393-2. Epub 2020 May 26.

The TRPV3 channel of the bovine rumen: localization and functional characterization of a protein relevant for ruminal ammonia transport

Affiliations

The TRPV3 channel of the bovine rumen: localization and functional characterization of a protein relevant for ruminal ammonia transport

Franziska Liebe et al. Pflugers Arch. 2020 Jun.

Abstract

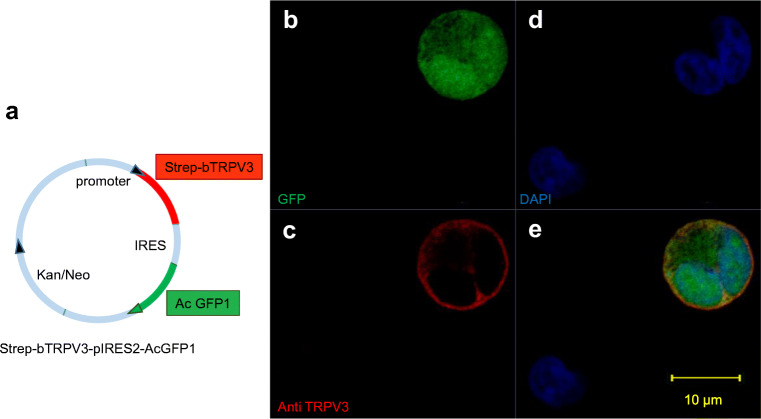
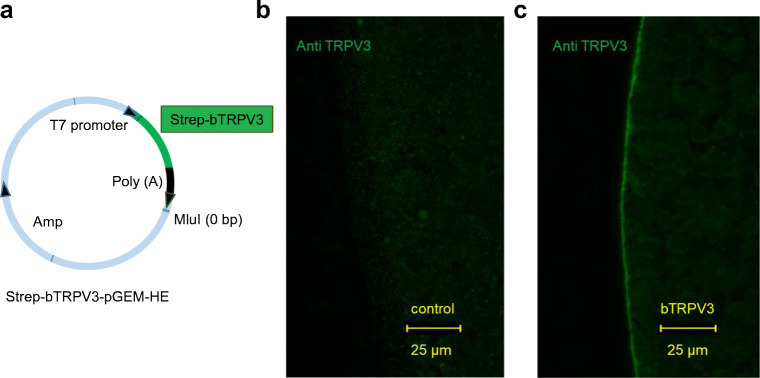
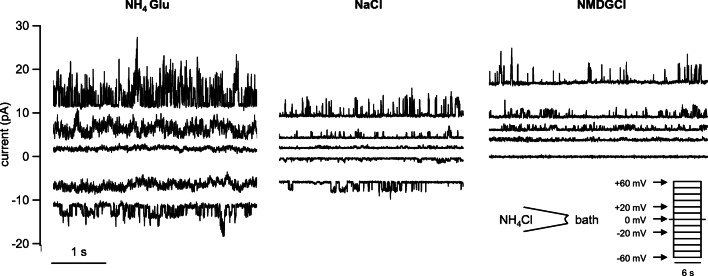
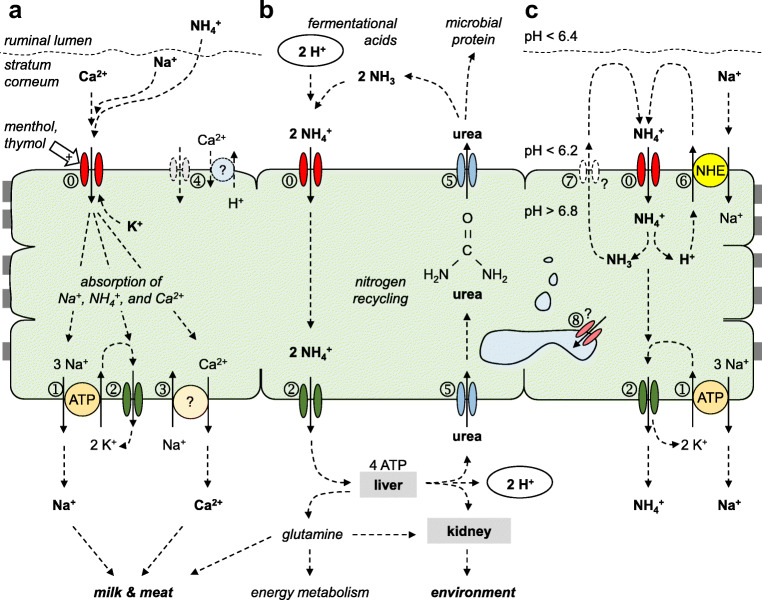
Large quantities of ammonia (NH3 or NH4+) are absorbed from the gut, associated with encephalitis in hepatic disease, poor protein efficiency in livestock, and emissions of nitrogenous climate gasses. Identifying the transport mechanisms appears urgent. Recent functional and mRNA data suggest that absorption of ammonia from the forestomach of cattle may involve TRPV3 channels. The purpose of the present study was to sequence the bovine homologue of TRPV3 (bTRPV3), localize the protein in ruminal tissue, and confirm transport of NH4+. After sequencing, bTRPV3 was overexpressed in HEK-293 cells and Xenopus oocytes. An antibody was selected via epitope screening and used to detect the protein in immunoblots of overexpressing cells and bovine rumen, revealing a signal of the predicted ~ 90 kDa. In rumen only, an additional ~ 60 kDa band appeared, which may represent a previously described bTRPV3 splice variant of equal length. Immunohistochemistry revealed staining from the ruminal stratum basale to stratum granulosum. Measurements with pH-sensitive microelectrodes showed that NH4+ acidifies Xenopus oocytes, with overexpression of bTRPV3 enhancing permeability to NH4+. Single-channel measurements revealed that Xenopus oocytes endogenously expressed small cation channels in addition to fourfold-larger channels only observed after expression of bTRPV3. Both endogenous and bTRPV3 channels conducted NH4+, Na+, and K+. We conclude that bTRPV3 is expressed by the ruminal epithelium on the protein level. In conjunction with data from previous studies, a role in the transport of Na+, Ca2+, and NH4+ emerges. Consequences for calcium homeostasis, ruminal pH, and nitrogen efficiency in cattle are discussed.

Keywords: Ammonia transport; Climate gas; Microelectrode; Rumen; TRPV3; Xenopus oocyte.


Conflict of interest statement

The authors declare that they have no conflicts of interest. Friederike Stumpff is the holder of a patent that was transferred to a startup company.

Figures

Fig. 1
Fig. 1
Comparative immunoblots to validate specific binding of the TRPV3 antibody. a Identification via Strep antibody: the marker lane (M) is followed by HEK-293 cells transfected with the Strep-tagged bTRPV3 construct (bV3H) or the control vector (cH), followed by oocytes injected with Strep-tagged bTRPV3 (bV3O) or water (cO). A strong band can be seen at ~ 90 kDa in the overexpressing samples but not in controls, representing Strep-tagged bTRPV3. b Identification via TRPV3 antibody: the four lanes to the right of the marker lane (M) represent bTRPV3 and controls as in a. On the left-hand side, bovine ruminal protein (rumen) has been added, showing a band at about ~ 90 kDa. A second, more prominent band is observed at ~ 60 kDa. (protein loading: HEK-293 0.02 μg, oocytes 0.20 μg, rumen 50 μg)
Fig. 2
Fig. 2
Immunohistological staining of overexpressing bTRPV3 HEK-293 cells. a Vector used for transfection. The bTRPV3 gene is fused to a Strep-tag, but not to green fluorescent protein (GFP). b Immunohistological staining reveals successful expression of cytosolic GFP. c Staining with the TRPV3 antibody (red) shows expression in the cellular membrane. d All cell nuclei were stained with DAPI (blue). e Overlay of b, c, and d. The cell in the top right-hand corner is in the process of division with both halves expressing bTRPV3 and GFP. The cell in the lower left-hand corner was not successfully transfected
Fig. 3
Fig. 3
Immunohistological staining of bTRPV3 in Xenopus oocytes. a pGEM construct containing a Strep-tagged bTRPV3 sequence for in vitro transcription to cRNA. b and c Immunohistological staining of two oocytes 4 days after injection of b water or cbTRPV3 cRNA. Cells were stained with TRPV3 antibody and investigated using the same microscope settings. Only overexpressing oocytes c show staining of the cellular membrane with the TRPV3 antibody
Fig. 4
Fig. 4
Immunohistological staining of native ruminal epithelium. a Staining of ventral rumen with the antibody against bTRPV3 (green), demonstrating strong staining of all epithelial layers. Although staining of peripheral structures (most likely representing the cellular membrane) could be clearly seen, cytosolic staining was intense throughout. b Claudin-4 (red) forms junctions between the cells. c Cell nuclei are shown in blue (DAPI). d Overlay of a, b, and c. e Staining of dorsal rumen with the bTRPV3 antibody and DAPI. f Using the same rumen sample and same microscope settings as in e, treatment with both the TRPV3 antibody and its immunizing peptide (SIP) prevented most of the staining for bTRPV3
Fig. 5
Fig. 5
Original recordings of two oocytes expressing bTRPV3 measured via pH-sensitive, double-barreled microelectrodes. All oocytes uniformly responded to KCl and NH4Cl with a rapid and reversible depolarization. Only application of NH4Cl induced a strong and reversible acidification. Responses to NaGlu and NMDGCl varied, as shown in a and b and discussed in the text
Fig. 6
Fig. 6
Intracellular pH (pHi) and membrane potential (in mV) of oocytes expressing bTRPV3 (n/N = 14/3) and control oocytes (n/N = 16/3). The blue traces show the means (± SEM in gray) of all control oocytes, the red traces the means (± SEM in gray) of all bTRPV3 oocytes. Overexpressing bTRPV3 oocytes had a significantly lower membrane potential in NMDGCl than controls, reflecting higher efflux of K+ through bTRPV3 channels. Subsequent application of NaCl led to a stronger potential jump in oocytes expressing bTRPV3. The final potential was equal to that of controls, reflecting both a higher influx of Na+ and a higher efflux of K+. Relative to NMDGCl, NH4Cl solution induced a stronger depolarization in bTRPV3 oocytes than in controls, reflecting higher influx of NH4+. However, the final potential was slightly lower in bTRPV3 oocytes, suggesting a relatively higher efflux of K+ in bTRPV3 oocytes. Acidification after application of NH4+ was significantly faster in bTRPV3 oocytes. Ultimately, both systems reached similar pHi. Note the inverse responses in membrane potential after a switch to a divalent cation-free NH4Cl solution (EDTA) (details see text and Table 2)
Fig. 7
Fig. 7
Single-channel measurements from a bTRPV3 expressing oocyte (inside-out). a Measurements were performed with NH4Cl in the pipette. The cytosolic side of the patch was consecutively exposed to different bath solutions as indicated and exposed to potentials between − 60 and + 60 mV in steps of 10 mV. For clarity, only the current responses to the potentials indicated by the arrows are shown. b Original recording in NH4Cl bath solution (same scaling as in f). The amplitude histogram at + 20 mV can be seen in the middle showing three distinct channels. c IV-plot corresponding to b, yielding a linear relationship with the slope of the fit as indicated in the figure. d Channel openings were not affected by the replacement of chloride by the much larger anion gluconate, proving cation selectivity (same scaling as in a and f). The histogram in the middle shows four distinct channels. e IV-plot from d, with the GHK fit yielding a similar conductance as in c. f In NaCl solution, channel openings at positive potentials are comparable with b and d, whereas channel openings at negative potentials were smaller. g IV-plot from f, fitted with the GHK equation by variation of the permeability to the two ions Na+ and NH4+. The conductance was then calculated from the GHK fit to the data and from the concentrations (see Supplement, equation 2). The negative reversal potential of the fit reflects a higher conductance to NH4+
Fig. 8
Fig. 8
Original recordings from an inside-out patch from a control oocyte (same scaling). Measurements were performed with NH4Cl in the pipette. Only the current responses to the potentials indicated by the arrows are shown in the traces. Measurement in NH4Glu solution showed small channel openings at positive and negative potentials, with the fit yielding a conductance of 41 pS for NH4+ in this patch. After switching to NaCl solution, channel openings at negative potentials were visibly smaller, reflecting influx of Na+ (here: conductance of 59 pS for NH4+ and 31 pS for Na+). After replacement of Na+ with the much larger cation NMDG+, channel openings were only visible at positive potentials. The GHK fit yielded a conductance for NH4+ of 53 pS and 11 pS for NMDG+
Fig. 9
Fig. 9
Inside-out measurement of a patch from a bTRPV3 oocyte expressing two different types of channels. The pipette was filled with NH4Cl. a Original recordings, showing consecutive exposure to KCl (traces to the left) and NH4Cl (traces to the right, same scaling). Small (s) and large (l) populations of channels were observed, most likely representing endogenous and bTRPV3 channels respectively. b IV-plot of unitary currents from amplitude histograms of the patch in a. Data from the symmetrical NH4Cl configuration were fitted linearly and yielded a conductance of 185 pS, with a reversal potential ~ 0 mV. In the asymmetrical KCl configuration, data from large and small channels were fitted separately to the GHK equation by variation of the permeability to the two ions NH4+ and K+. The conductance was calculated from the permeability and the concentrations (see Supplement, equation 2). The fit of the large channel openings yielded a conductance to NH4+ of 215 pS and to K+ of 129 pS. The smaller openings could be fitted with a conductance of 45 pS for NH4+ and 18 pS for K+. Both reversal potentials were shifted to ~ − 15 mV, confirming the higher conductance to NH4+
Fig. 10
Fig. 10
Original inside-out recordings and histograms from control and bTRPV3 oocytes in asymmetrical solution with NH4Cl in the pipette and NaCl in the bath. a Original recordings from one overexpressing bTRPV3 oocyte and one control oocyte at a pipette potential of + 60 mV, reflecting efflux of NH4+ (same scaling). b Corresponding traces at − 60 mV, reflecting Na+ influx. Data from all voltages were fitted as in Figs. 7 and 8 to yield a conductance to NH4+ and Na+ for each patch. c Histogram giving an overview of all conductance values for NH4+ determined from patches showing channel activity in asymmetrical solution. The total conductance range was divided into a number of equidistant bins, which are given on the X-axis. The Y-axis gives the number of patches with a conductance falling into the corresponding bin on the X-axis. The histogram shows one cluster of NH4+ conductances for control oocytes (blue) around 50 pS, while for bTRPV3 oocytes (red), a second cluster of conductances can be seen around 150 pS. Three bTRPV3 patches expressed both small and large channels. d Corresponding histogram of all measurements of the conductance to Na+. One peak emerges at ~ 20 pS for both groups of oocytes and a second peak at ~ 80 pS in bTRPV3 oocytes only
Fig. 11
Fig. 11
Model showing the function of bTRPV3 in the rumen. The ruminal epithelium is a multilayered, squamous epithelium of cells that are interconnected by gap junctions, thus forming a functional syncytium. a bTRPV3 (⓪) is a non-selective cation channel that can serve as a pathway for the uptake of nutrients such as Na+ and Ca2+, and contributes to the apical conductance for K+. Uptake of cations is stimulated by certain monoterpenoids such as menthol and thymol. Basolateral extrusion involves the sodium-potassium pump (ATP1A1,➀), basolateral K+ channels (➁), and sodium-calcium exchangers (➂). In the model, NH4+ is taken up by the same pathway as K+ (⓪,➁). Other TRP channels and exchangers may be involved (➃). b Within the ruminal lumen, large quantities of fermentational acids are produced, releasing protons that can partially be removed via efflux of NH4+ via bTRPV3 (⓪) and basolateral K+ channels (➁). In the liver, NH4+ is converted to non-toxic metabolites, mostly urea, but also some glutamine. Only glutamine can be utilized by mammalian enzymes for protein synthesis. Conversely, urea must be excreted. This can occur renally, resulting in nitrogen losses and environmental damage. Alternately, urea can be secreted into the rumen via urea transporters such as UT-B or aquaporin 3 (➄). After degradation by the microbiota within, NH3 is released and can be utilized by microbial enzymes for protein synthesis. NH3 also functions as a buffer, binding protons to form NH4+ that is again removed via bTRPV3 (⓪). This “nitrogen recycling” can reach 20 mol day−1 in cattle. c At physiological pH gradients across the apical membrane, NH4+ stimulates sodium transport via NHE (SLC9A3,➅) with apical recirculation of NH3 via an unknown pathway (➆). Electrogenic transport of NH4+ across the basolateral membrane continues (➁). Specific staining for bTRPV3 can also be found within the cytosol, possibly reflecting expression of bTRPV3 or its splice variant in intracellular membranes such as those of the ER (➇)

Comment in

  • New ways for an old cation.
    Diener M. Diener M. Pflugers Arch. 2020 Jun;472(6):669-670. doi: 10.1007/s00424-020-02394-1. Epub 2020 May 25. Pflugers Arch. 2020. PMID: 32448954 Free PMC article. No abstract available.

Similar articles

Cited by

References

    1. Abdoun K, Stumpff F, Martens H. Ammonia and urea transport across the rumen epithelium: a review. Anim Health Res Rev. 2006;7:43–59. doi: 10.1017/S1466252307001156. - DOI - PubMed
    1. Abdoun K, Stumpff F, Rabbani I, Martens H. Modulation of urea transport across sheep rumen epithelium in vitro by SCFA and CO2. Am J Physiol Gastrointest Liver Physiol. 2010;298:G190–G202. doi: 10.1152/ajpgi.00216.2009. - DOI - PubMed
    1. Abdoun K, Stumpff F, Wolf K, Martens H. Modulation of electroneutral Na transport in sheep rumen epithelium by luminal ammonia. Am J Physiol Gastrointest Liver Physiol. 2005;289:G508–G520. doi: 10.1152/ajpgi.00436.2004. - DOI - PubMed
    1. Abdoun K, Wolf K, Arndt G, Martens H. Effect of ammonia on Na+transport across isolated rumen epithelium of sheep is diet dependent. Br J Nutr. 2003;90:751–758. doi: 10.1079/BJN2003957. - DOI - PubMed
    1. Aschenbach JR, Penner GB, Stumpff F, Gabel G. Ruminant Nutrition Symposium: role of fermentation acid absorption in the regulation of ruminal pH. J Anim Sci. 2011;89:1092–1107. doi: 10.2527/jas.2010-3301. - DOI - PubMed

Publication types

LinkOut - more resources