

Spatial-dependent regularization to solve the inverse problem in electromyometrial imaging
- PMID: 32458384
- PMCID: PMC7347447
- DOI: 10.1007/s11517-020-02183-z
Spatial-dependent regularization to solve the inverse problem in electromyometrial imaging
Abstract
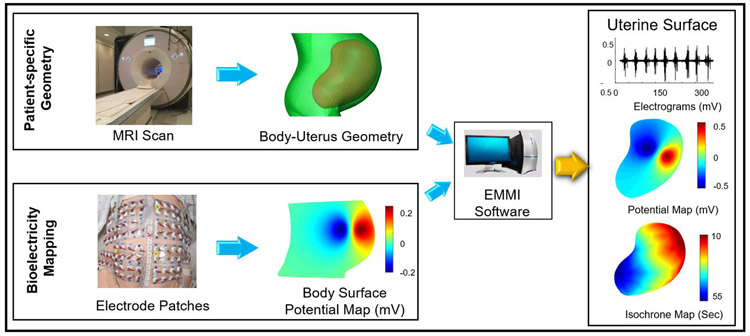
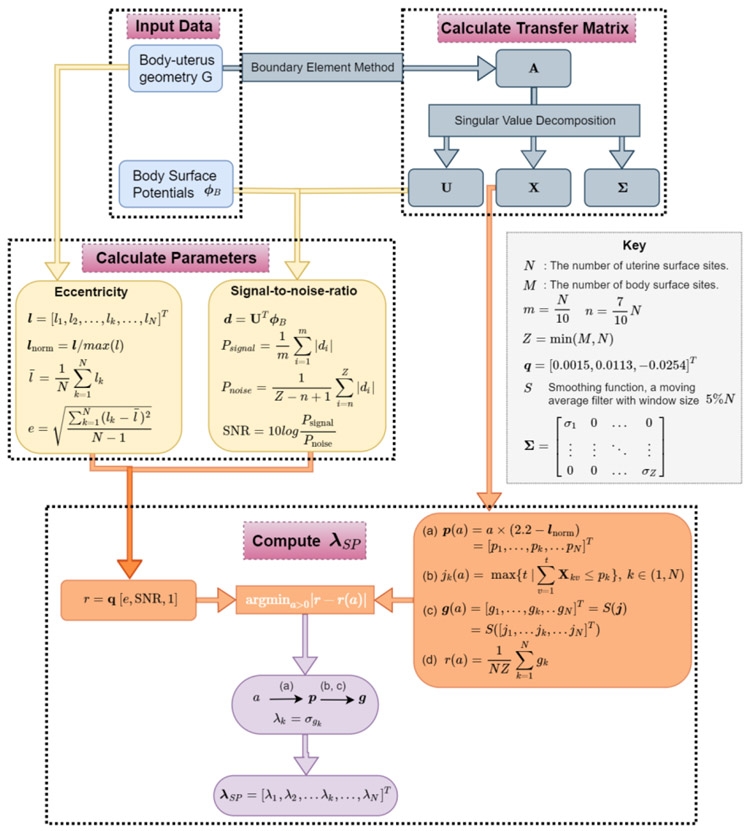
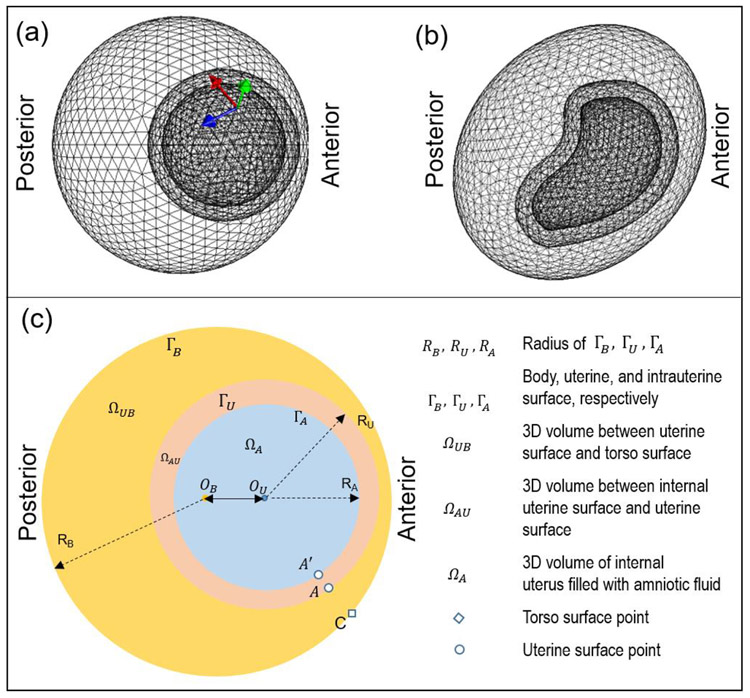
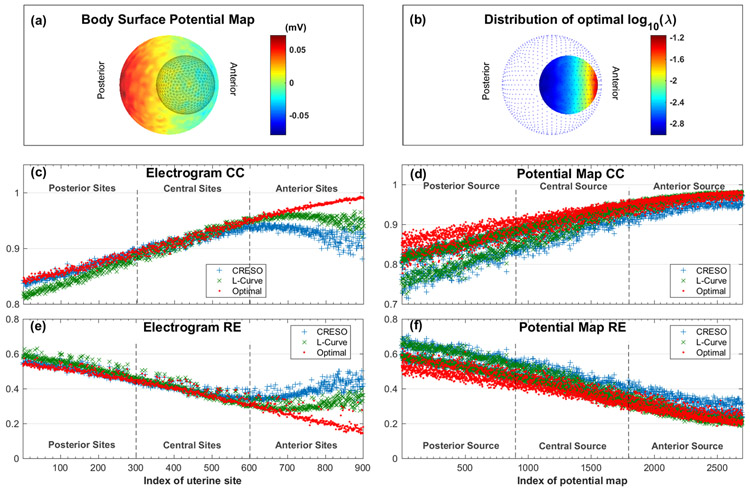
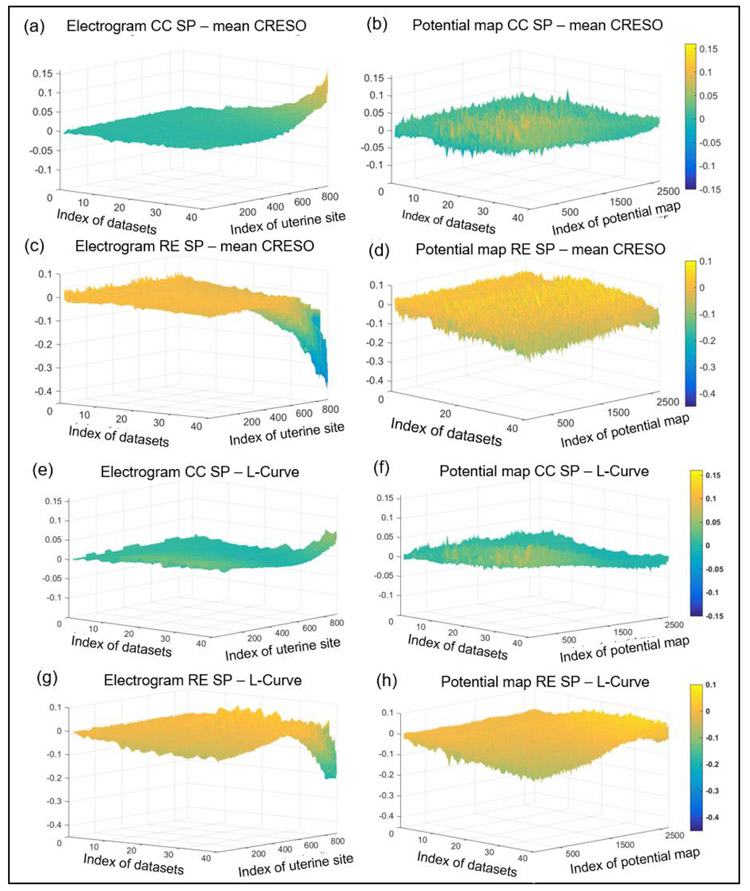
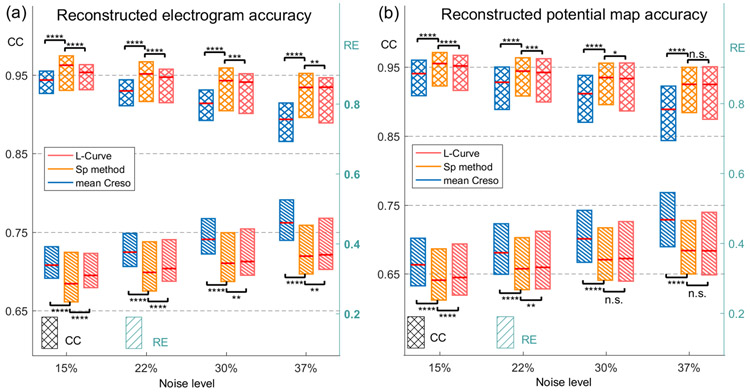
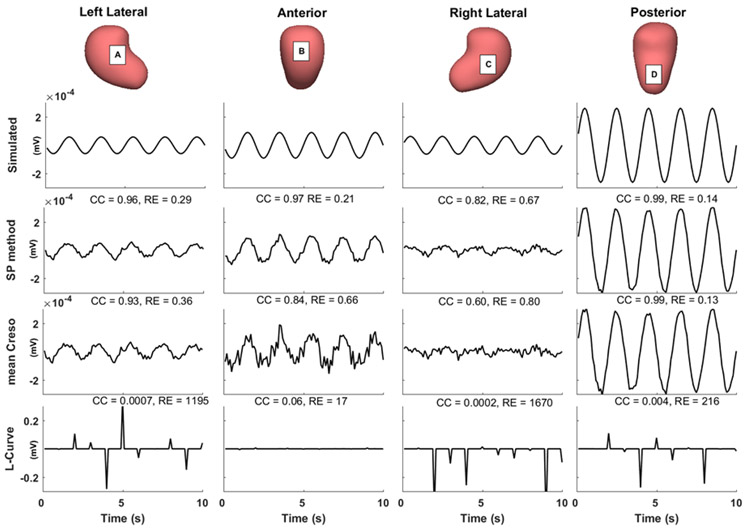
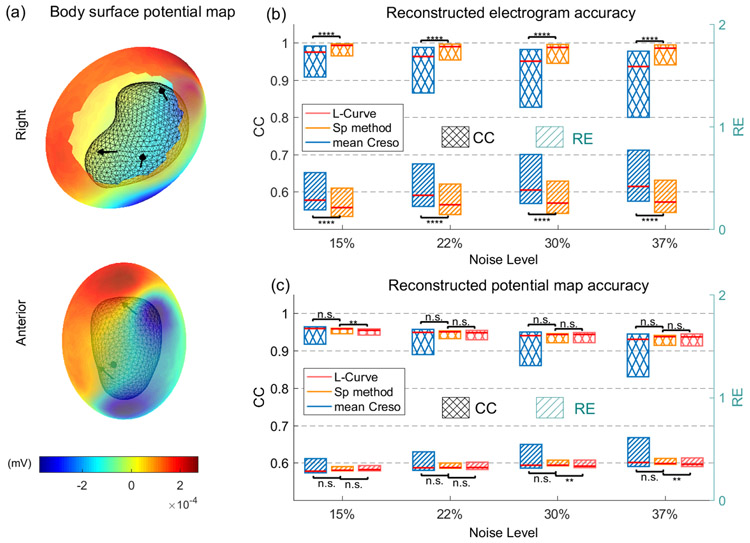
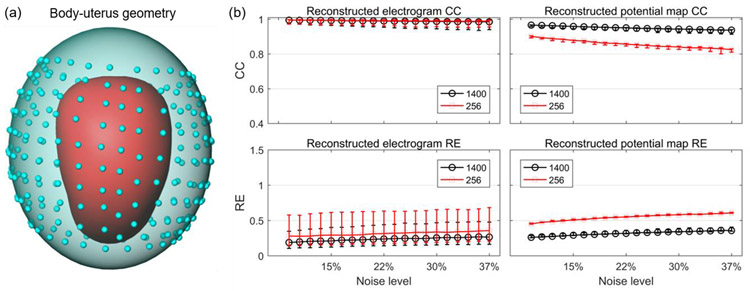
Recently, electromyometrial imaging (EMMI) was developed to non-invasively image uterine contractions in three dimensions. EMMI collects body surface electromyography (EMG) measurements and uses patient-specific body-uterus geometry generated from magnetic resonance images to reconstruct uterine electrical activity. Currently, EMMI uses the zero-order Tikhonov method with mean composite residual and smoothing operator (CRESO) to stabilize the underlying ill-posed inverse computation. However, this method is empirical and implements a global regularization parameter over all uterine sites, which is sub-optimal for EMMI given the severe eccentricity of body-uterus geometry. To address this limitation, we developed a spatial-dependent (SP) regularization method that considers both body-uterus eccentricity and EMG noise. We used electrical signals simulated with spherical and realistic geometry models to compare the reconstruction accuracy of the SP method to those of the CRESO and the L-Curve methods. The SP method reconstructed electrograms and potential maps more accurately than the other methods, especially in cases of high eccentricity and noise contamination. Thus, the SP method should facilitate clinical use of EMMI and can be used to improve the accuracy of other electrical imaging modalities, such as Electrocardiographic Imaging. Graphical abstract The spatial-dependent regularization (SP) technique was designed to improve the accuracy of Electromyometrial Imaging (EMMI). The top panel shows the eccentricity of body-uterus geometry and four representative body surface electrograms. The bottom panel shows boxplots of correlation coefficients and relative errors for the electrograms reconstructed with SP and two conventional methods, the L-Curve and mean CRESO methods.
Keywords: Electromyometrial imaging; Inverse problem; Regularization.
Conflict of interest statement
Figures
Similar articles
-
Accuracy of electromyometrial imaging of uterine contractions in clinical environment.Comput Biol Med. 2020 Jan;116:103543. doi: 10.1016/j.compbiomed.2019.103543. Epub 2019 Nov 18. Comput Biol Med. 2020. PMID: 31786490 Free PMC article.
-
Electromyometrial imaging dataset of electromyograms and isochrone maps under deformation/electrical noise contaminations.Data Brief. 2020 Jan 3;28:105078. doi: 10.1016/j.dib.2019.105078. eCollection 2020 Feb. Data Brief. 2020. PMID: 31956675 Free PMC article.
-
Noninvasive high-resolution electromyometrial imaging of uterine contractions in a translational sheep model.Sci Transl Med. 2019 Mar 13;11(483):eaau1428. doi: 10.1126/scitranslmed.aau1428. Sci Transl Med. 2019. PMID: 30867320
-
The electrocardiographic inverse problem.Crit Rev Biomed Eng. 1992;20(1-2):25-45. Crit Rev Biomed Eng. 1992. PMID: 1424685 Review.
-
The inverse problem in electrocardiography: solutions in terms of epicardial potentials.Crit Rev Biomed Eng. 1988;16(3):215-68. Crit Rev Biomed Eng. 1988. PMID: 3064971 Review.
Cited by
-
A multidisciplinary Prematurity Research Cohort Study.PLoS One. 2022 Aug 25;17(8):e0272155. doi: 10.1371/journal.pone.0272155. eCollection 2022. PLoS One. 2022. PMID: 36006907 Free PMC article.
-
Enhancing uterine contraction detection through novel EHG signal processing: a pilot study leveraging the relationship between slow and fast wave components to improve signal quality and noise resilience.Front Physiol. 2025 May 27;16:1568919. doi: 10.3389/fphys.2025.1568919. eCollection 2025. Front Physiol. 2025. PMID: 40496244 Free PMC article.
-
The use of transvaginal ultrasound alters physiologic uterine peristalsis in gynecologic participants.F S Rep. 2024 Jun 25;5(3):296-303. doi: 10.1016/j.xfre.2024.06.004. eCollection 2024 Sep. F S Rep. 2024. PMID: 39381650 Free PMC article.
-
Noninvasive electrophysiological imaging identifies 4D uterine peristalsis patterns in subjects with normal menstrual cycles and patients with endometriosis.Res Sq [Preprint]. 2023 Mar 8:rs.3.rs-2432192. doi: 10.21203/rs.3.rs-2432192/v1. Res Sq. 2023. PMID: 36945376 Free PMC article. Preprint.
-
Directional Sensors for Recording Uterine EMG During Pregnancy.Reprod Sci. 2023 Nov;30(11):3190-3196. doi: 10.1007/s43032-023-01268-y. Epub 2023 May 22. Reprod Sci. 2023. PMID: 37217825
References
-
- Aster RC, Borchers B, Thurber CH (2013) Parameter Estimation and Inverse Problems. Academic Press
-
- Barr RC, Ramsey M, Spach MS (1977) Relating epicardial to body surface potential distributions by means of transfer coefficients based on geometry measurements. IEEE Trans Biomed Eng 1–11 - PubMed
-
- Behar J, Andreotti F, Zaunseder S, et al. (2014) An ECG simulator for generating maternal-foetal activity mixtures on abdominal ECG recordings. Physiol Meas 35:1537. - PubMed
-
- Burnes JE, Taccardi B, MacLeod RS, Rudy Y (2000) Noninvasive ECG imaging of electrophysiologically abnormal substrates in infarcted hearts: a model study. Circulation 101:533–540 - PubMed
MeSH terms
Grants and funding
LinkOut - more resources
Full Text Sources
Medical
