. 2020 Jun 23;323(24):2522-2524.
doi: 10.1001/jama.2020.9176.

Association of Stay-at-Home Orders With COVID-19 Hospitalizations in 4 States

Affiliations

Association of Stay-at-Home Orders With COVID-19 Hospitalizations in 4 States

Soumya Sen et al. JAMA. .

Abstract

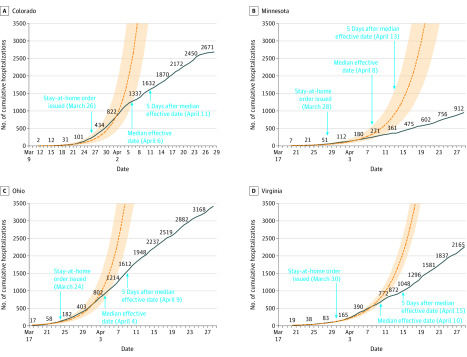
This study uses state public health department data to describe trends in COVID-19 hospitalizations before and after state executive stay-at-home orders issued in March and April 2020 in Colorado, Minnesota, Ohio, and Virginia, and compares projected vs observed admissions to estimate associations between the orders and hospital admissions.


Conflict of interest statement

Conflict of Interest Disclosures: Dr Karaca-Mandic reported receiving personal fees from Tactile Medical, Precision Health Economics, and Sempre Health and grants from the Agency for Healthcare Research and Quality, the American Cancer Society, the National Institute for Health Care Management, the National Institute on Drug Abuse, and the National Institutes of Health. Dr Georgiou reported receiving personal fees from HealthGrades. Dr Sen reported no disclosures.

Figures

Figure.
Figure.. Projected vs Observed COVID-19 Hospitalizations Before and After Stay-at-Home Orders, March 10 Through April 28, 2020
Blue lines indicate observed cumulative hospitalizations (including those currently hospitalized and those discharged) up to each day; select values are displayed for clarity. Dashed red lines begin on the first day of available reporting by each state and are the best-fit exponential curves for cumulative hospitalizations for the fitting period: first day of reporting up to and including the median effective date (panel A: y = 3.5829 exp(0.23599t), R2 = 0.9734; B: y = 7.521 exp(0.1876t), R2 = 0.96445; C: y = 18.8482 exp(0.2268t), R2 = 0.9798; D: y = 15.932 exp(0.1397t), R2 = 0.99444). Shaded regions indicate the 95% prediction bands of the exponential growth curves. Because the median incubation period of coronavirus disease 2019 (COVID-19) was reported to be 4 to 5.1 days, and the median time from first symptom to hospitalization was found to be 7 days, it was hypothesized that any association between stay-at-home orders and hospitalization rates would become evident after 12 days (median effective date).

Comment in

  • doi: 10.1001/jama.2020.5910

References

    1. Karaca-Mandic P, Georgiou A, Sen S Calling all states to report standardized information on COVID-19 hospitalizations. Health Affairs blog. April 7, 2020. Accessed April 17, 2020. https://www.healthaffairs.org/do/10.1377/hblog20200406.532030/full/?cook... - DOI
    1. University of Minnesota COVID-19 Hospitalization Tracking Project website. Accessed April 30, 2020. https://carlsonschool.umn.edu/mili-misrc-covid19-tracking-project
    1. Lauer SA, Grantz KH, Bi Q, et al. . The incubation period of coronavirus disease 2019 (COVID-19) from publicly reported confirmed cases: estimation and application. Ann Intern Med. 2020;172(9):577-582. doi:10.7326/M20-0504 - DOI - PMC - PubMed
    1. Guan WJ, Ni ZY, Hu Y, et al. ; China Medical Treatment Expert Group for Covid-19 . Clinical characteristics of coronavirus disease 2019 in China. N Engl J Med. 2020;382(18):1708-1720. doi:10.1056/NEJMoa2002032 - DOI - PMC - PubMed
    1. Wang D, Hu B, Hu C, et al. . Clinical characteristics of 138 hospitalized patients with 2019 novel coronavirus–infected pneumonia in Wuhan, China. JAMA. 2020;323(11):1061-1069. doi:10.1001/jama.2020.1585 - DOI - PMC - PubMed

Publication types