

Characterization and Correction of Bias Due to Nonparticipation and the Degree of Loyalty in Large-Scale Finnish Loyalty Card Data on Grocery Purchases: Cohort Study
- PMID: 32459633
- PMCID: PMC7392131
- DOI: 10.2196/18059
Characterization and Correction of Bias Due to Nonparticipation and the Degree of Loyalty in Large-Scale Finnish Loyalty Card Data on Grocery Purchases: Cohort Study
Abstract
Background: To date, the evaluation of diet has mostly been based on questionnaires and diaries that have their limitations in terms of being time and resource intensive, and a tendency toward social desirability. Loyalty card data obtained in retailing provides timely and objective information on diet-related behaviors. In Finland, the market is highly concentrated, which provides a unique opportunity to investigate diet through grocery purchases.
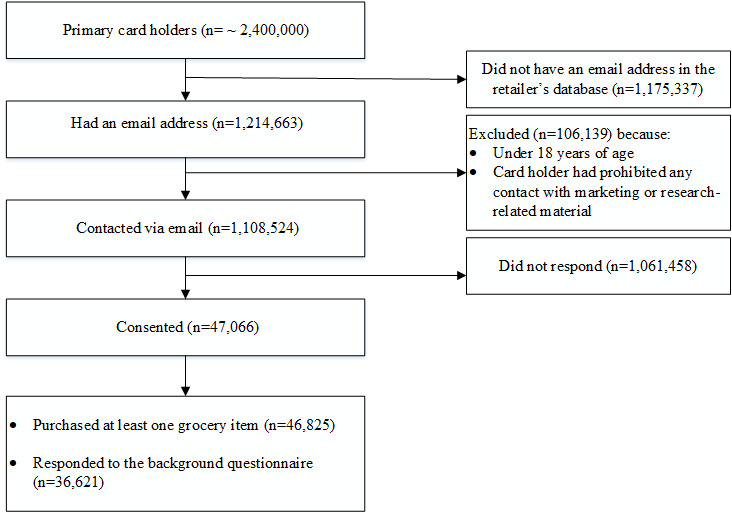
Objective: The aims of this study were as follows: (1) to investigate and quantify the selection bias in large-scale (n=47,066) loyalty card (LoCard) data and correct the bias by developing weighting schemes and (2) to investigate how the degree of loyalty relates to food purchases.
Methods: Members of a loyalty card program from a large retailer in Finland were contacted via email and invited to take part in the study, which involved consenting to the release of their grocery purchase data for research purposes. Participants' sociodemographic background was obtained through a web-based questionnaire and was compared to that of the general Finnish adult population obtained via Statistics Finland. To match the distributions of sociodemographic variables, poststratification weights were constructed by using the raking method. The degree of loyalty was self-estimated on a 5-point rating scale.
Results: On comparing our study sample with the general Finnish adult population, in our sample, there were more women (65.25%, 30,696/47,045 vs 51.12%, 2,273,139/4,446,869), individuals with higher education (56.91%, 20,684/36,348 vs 32.21%, 1,432,276/4,446,869), and employed individuals (60.53%, 22,086/36,487 vs 52.35%, 2,327,730/4,446,869). Additionally, in our sample, there was underrepresentation of individuals aged under 30 years (14.44%, 6,791/47,045 vs 18.04%, 802,295/4,446,869) and over 70 years (7.94%, 3,735/47,045 vs 18.20%, 809,317/4,446,869), as well as retired individuals (23.51%, 8,578/36,487 vs 31.82%, 1,414,785/4,446,869). Food purchases differed by the degree of loyalty, with higher shares of vegetable, red meat & processed meat, and fat spread purchases in the higher loyalty groups.
Conclusions: Individuals who consented to the use of their loyalty card data for research purposes tended to diverge from the general Finnish adult population. However, the high volume of data enabled the inclusion of sociodemographically diverse subgroups and successful correction of the differences found in the distributions of sociodemographic variables. In addition, it seems that food purchases differ according to the degree of loyalty, which should be taken into account when researching loyalty card data. Despite the limitations, loyalty card data provide a cost-effective approach to reach large groups of people, including hard-to-reach population subgroups.
Keywords: diet; food; loyalty card data; raking; selection bias; weighting.
©Anna-Leena Vuorinen, Maijaliisa Erkkola, Mikael Fogelholm, Satu Kinnunen, Hannu Saarijärvi, Liisa Uusitalo, Turkka Näppilä, Jaakko Nevalainen. Originally published in the Journal of Medical Internet Research (http://www.jmir.org), 15.07.2020.
Conflict of interest statement
Conflicts of Interest: None declared.
Figures
References
-
- Schwingshackl L, Knüppel S, Michels N, Schwedhelm C, Hoffmann G, Iqbal K, De Henauw S, Boeing H, Devleesschauwer B. Intake of 12 food groups and disability-adjusted life years from coronary heart disease, stroke, type 2 diabetes, and colorectal cancer in 16 European countries. Eur J Epidemiol. 2019 Aug;34(8):765–775. doi: 10.1007/s10654-019-00523-4. http://europepmc.org/abstract/MED/31030306 - DOI - PMC - PubMed
-
- Global action plan for the prevention and control of NCDs 2013-2020. World Health Organization. 2013. [2020-06-10]. https://www.who.int/nmh/publications/ncd-action-plan/en/
-
- GBD 2017 Diet Collaborators Health effects of dietary risks in 195 countries, 1990-2017: a systematic analysis for the Global Burden of Disease Study 2017. Lancet. 2019 May 11;393(10184):1958–1972. doi: 10.1016/S0140-6736(19)30041-8. https://linkinghub.elsevier.com/retrieve/pii/S0140-6736(19)30041-8 - DOI - PMC - PubMed
-
- Willett W. Nutritional Epidemiology. Oxford: Oxford University Press; 2013.
-
- Lovefrove J, Hodson L, Sharma S, Lanham-New S. Nutrition Research Methodologies. Hoboken, New Jersey: Wiley-Blackwell; 2015.
Publication types
MeSH terms
LinkOut - more resources
Full Text Sources
