. 2020 Jun 4;26(6):862-879.e11.
doi: 10.1016/j.stem.2020.05.004. Epub 2020 May 26.

Human-iPSC-Derived Cardiac Stromal Cells Enhance Maturation in 3D Cardiac Microtissues and Reveal Non-cardiomyocyte Contributions to Heart Disease

Affiliations

Human-iPSC-Derived Cardiac Stromal Cells Enhance Maturation in 3D Cardiac Microtissues and Reveal Non-cardiomyocyte Contributions to Heart Disease

Elisa Giacomelli et al. Cell Stem Cell. .

Abstract

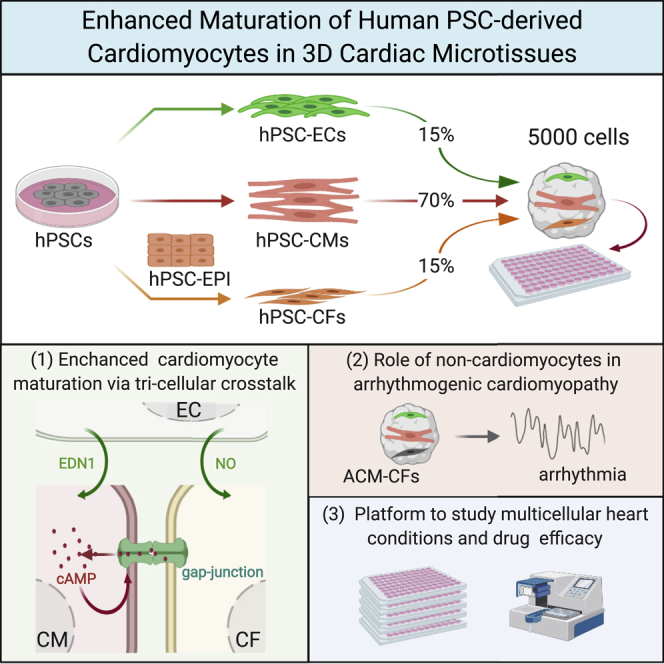
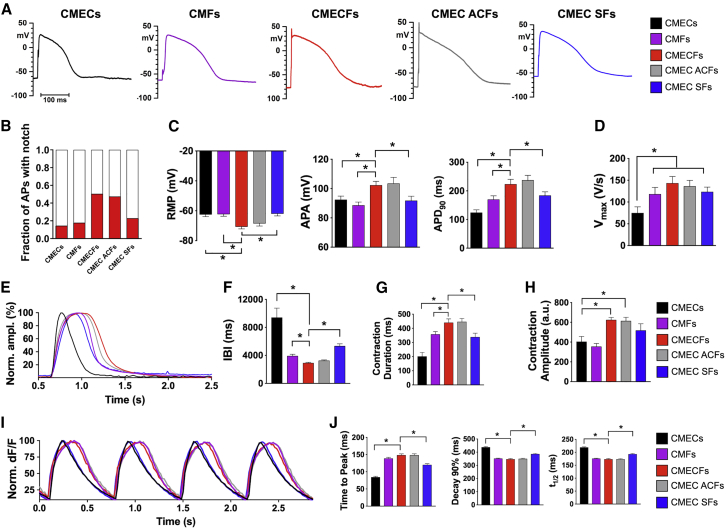
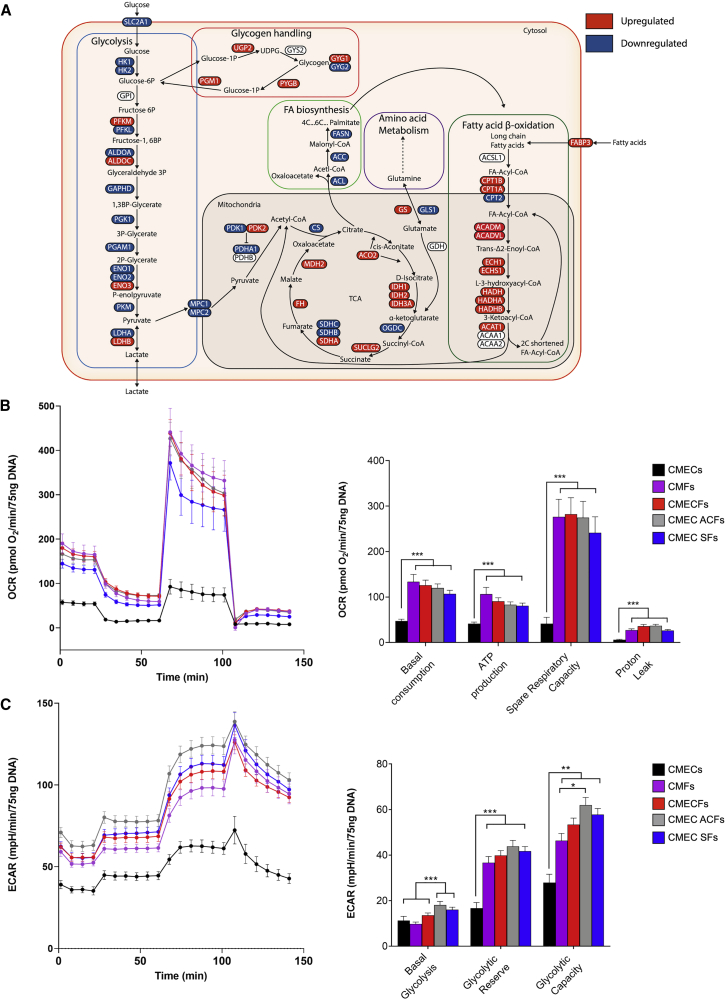
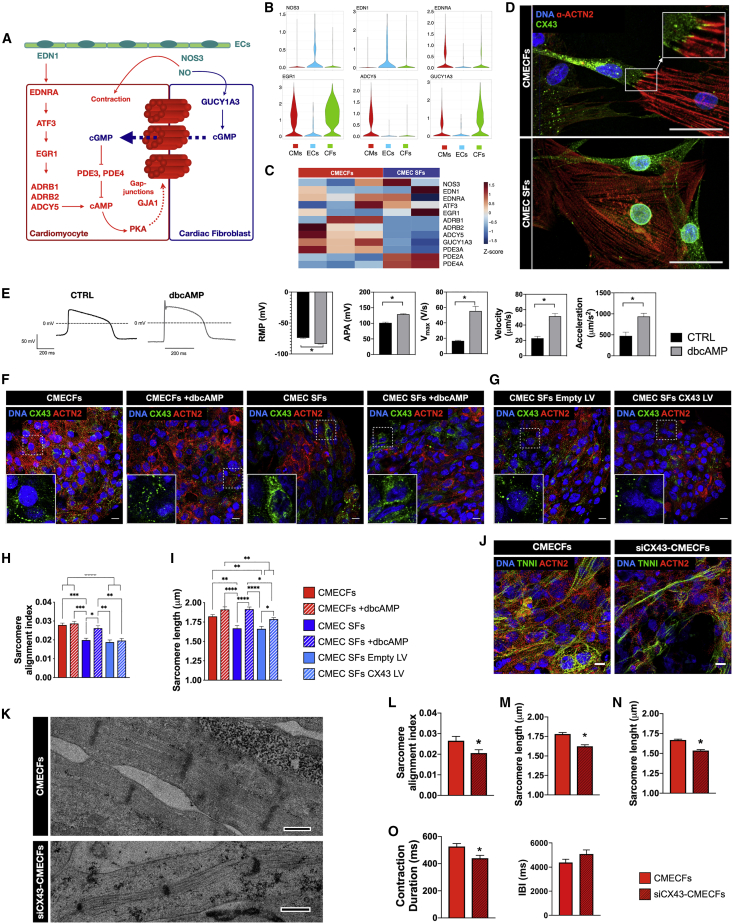
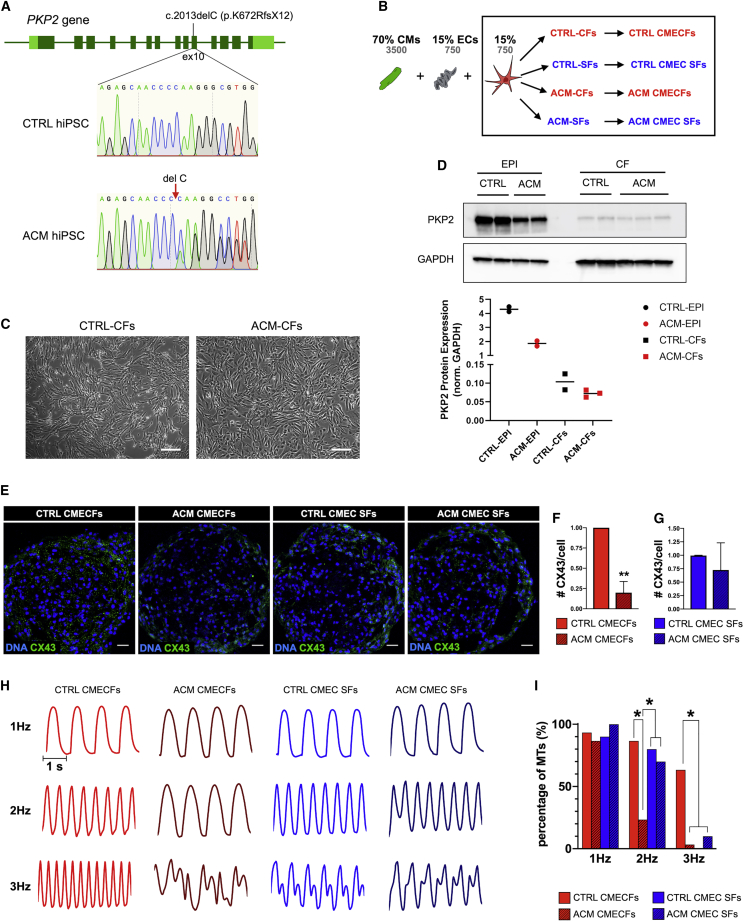
Cardiomyocytes (CMs) from human induced pluripotent stem cells (hiPSCs) are functionally immature, but this is improved by incorporation into engineered tissues or forced contraction. Here, we showed that tri-cellular combinations of hiPSC-derived CMs, cardiac fibroblasts (CFs), and cardiac endothelial cells also enhance maturation in easily constructed, scaffold-free, three-dimensional microtissues (MTs). hiPSC-CMs in MTs with CFs showed improved sarcomeric structures with T-tubules, enhanced contractility, and mitochondrial respiration and were electrophysiologically more mature than MTs without CFs. Interactions mediating maturation included coupling between hiPSC-CMs and CFs through connexin 43 (CX43) gap junctions and increased intracellular cyclic AMP (cAMP). Scaled production of thousands of hiPSC-MTs was highly reproducible across lines and differentiated cell batches. MTs containing healthy-control hiPSC-CMs but hiPSC-CFs from patients with arrhythmogenic cardiomyopathy strikingly recapitulated features of the disease. Our MT model is thus a simple and versatile platform for modeling multicellular cardiac diseases that will facilitate industry and academic engagement in high-throughput molecular screening.

Keywords: arrhythmogenic cardiomyopathy; cAMP; cardiac disease model; cardiac microtissue; cardiomyocyte maturation; cell-cell interaction; cyclic AMP; gap junction; human-induced-pluripotent-stem-cell-derived cardiac fibroblasts; human-induced-pluripotent-stem-cell-derived cardiomyocytes.


Conflict of interest statement

Declaration of Interests C.L.M. is co-founder of Ncardia bv.

Figures

None
Graphical abstract
Figure 1
Figure 1
Differentiation, Expansion, and Characterization of hiPSC-Derived Cardiac Fibroblasts (A) Protocol for hiPSC differentiation into cardiac fibroblasts with bright-field images at indicated times (d, days) for CTRL1-hiPSCs (LUMC0020iCTRL-06). BAC, BMP4 + activin-A + CHIR99021; BXR, BMP4 + XAV939 + retinoic acid; F, FGF2; S, SB431542. Scale bar: 100 μm. (B) Representative immunofluorescence images of WT1, TBX18, COL1A1 (red), and CX43 (green) of hiPSC-EPIs and hiPSC-CFs from CTRL1, CTRL2, and LQT1 hiPSCs, ACFs, and SFs. Nuclei stained with DAPI (blue). Scale bar: 20 μm. (C) Heatmap showing qPCR analysis of fibroblast (GJA1, ITGA4, COL1A2, COL1A1, and POSTN) and EPI (GJA1, WT1, and TBX18) genes in hiPSC-EPIs and hiPSC-CFs from hiPSC lines indicated and ACFs and SFs. Values normalized to RPL37A. n = 3. (D) Principal-component (PC) analysis of hiPSC-CMs, primary human fetal- (huF-ECs) and hiPSC-cardiac ECs (hiPSC-ECs), primary human adult SFs, and hiPSC-EPIs and primary human adult (ACFs), fetal (huF-CFs) and hiPSC-derived CFs (hiPSC-CFs) based on RNA-seq profiles using all genes. Dots represent individual samples; colors different cell types. (E) Heatmap showing hierarchical clustering of 4,266 DEGs (PFDR ≤ 0.05) across different cell types showing cell-lineage-specific gene clusters. (F) GO analysis of cell-lineage-specific gene clusters.
Figure 2
Figure 2
Cardiac Fibroblasts Promote Structural Maturation of hiPSC-CMs in Microtissues (A) Schematic showing cellular composition of cardiac MT groups. Cell percentages (black) and numbers (gray) are indicated. (B and C) Representative immunofluorescence images for (B) cardiac sarcomeric proteins TNNI (green) and ACTN2 (red) in MTs (scale bar: 10 μm) and (C) ACTN2 (red) in cells dissociated from MTs (scale bar: 20 μm). Nuclei are stained with DAPI (blue). (D) Representative transmission electron microscopy (TEM) images showing sarcomeres in different MTs. Scale bar: 1 μm. (E) TEM images showing caveolae (c), T-tubule like structures (t), Z-lines (Z), I-bands (I), H-zones (H), and elongated mitochondria with complex cristae (red arrows) in CMECFs. Scale bar: 0.5 μm. (F) Sarcomere organization (sarcomere alignment index; n > 45 areas from 3 MTs per group; p < 0.05) and sarcomere length (n > 47 areas from 3 MTs per group; p < 0.001) from immunofluorescence analysis in MTs from CTRL1 hiPSCs. (G) Sarcomere length in hiPSC-CMs dissociated from MTs. n > 28 areas from at least 3 independent slides per MT group. (H) Sarcomere length from TEM in MTs from CTRL1 (n > 41 areas from at least 2 independent stitches per group; p < 0.05). Data are mean ± SEM. One-way ANOVA with Dunnett’s multiple comparisons test is shown.
Figure 3
Figure 3
Single-Cell and Bulk Transcriptome Profiling of Microtissues (A) PC analysis of single-cell (sc) and bulk RNA-seq of hiPSC-CMs at day 20 (single cell CMs; CMs), bulk CMECs (CMECs), and sc and bulk CMECFs (single cell CMECFs; CMECFs) from this study, with bulk hPSC-CMs (day 20), bulk primary human fetal heart (fetal), bulk hPSC-CMs (1 year), and primary human adult heart (adult) from RNA-seq in Kuppusamy et al. (2015); CM cluster). Colors represent different samples. (B) Volcano plot and heatmaps displaying sorted log2 fold-change (FC) and adjusted p values showing expression of selected genes for hiPSC-CMs and CMECFs based on their scRNA-seq profiles. Log2FC > 0 indicates upregulated genes in the CM cluster of CMECFs versus hiPSC-CMs, whereas log2FC < 0 indicates upregulated genes in the CM cluster of hiPSC-CMs versus CMECFs. (C) Spearman’s correlation heatmap of hiPSC-CMs, CMECs, CMECFs, CMEC ACFs, and CMEC SFs based on bulk RNA-seq. (D) Heatmap showing gene expression in eight gene clusters from the consensus matrix across CMECs, CMECFs, CMEC ACFs, and CMEC SFs. (E) GO Biological Process terms enriched in gene clusters from consensus matrix (padj < 0.05). (F) KEGG pathways enriched in gene clusters from consensus matrix (padj < 0.05). (G–I) Heatmaps showing expression of genes selected from GO: heart contraction (G); GO: regulation of ion transmembrane transport (H); and KEGG: adrenergic signaling in cardiomyocytes (I).
Figure 4
Figure 4
Cardiac Fibroblasts Promote Electrical Maturation and Enhance Mechanical Contraction of hiPSC-CMs in Microtissues (A) Representative action potential (AP) traces recorded from single hiPSC-CMs dissociated from MT groups indicated, stimulated at 1 Hz. (B) Bar graph showing the fraction of APs with the Ito “notch” (red). (C and D) APs recorded in single hiPSC-CMs from different MT groups (see A). (C) RMP, resting membrane potential; APA, amplitude; APD90, action potential duration at 90% of repolarization; (D) Vmax, maximum upstroke velocity in APs measured with dynamic clamp (n > 18; single CMs dissociated from 2–5 independent MT batches per group; p < 0.05). (E) Representative contraction traces in spontaneously beating MTs. For graphical visualization, amplitude was normalized to each respective maximum amplitude. (F and G) Inter-beat interval (IBI) (F) and normalized contraction duration (G) in spontaneously beating MTs. n > 26; MTs from 3 independent batches per group; p < 0.0001. (H) Contraction amplitude in spontaneously beating MTs. a.u., arbitrary units. n > 7; MTs; p < 0.05. One-way ANOVA with Fisher’s least significant difference (LSD) test is shown. (I) Representative Ca2+ transients in MTs stimulated at 1.5 Hz. (J) Ca2+ transient parameters (time to peak, peak to 90% decay time, and peak to half decay time) of MTs stimulated at 1.5 Hz. n > 15; MTs from 3 independent batches per group. p < 0.0001. One-way ANOVA with Dunnett’s multiple comparisons test is shown. Data in bar graphs are mean ± SEM.
Figure 5
Figure 5
Metabolic Maturation of hiPSC-CMs in Microtissues (A) Schematic showing metabolic pathways with significantly upregulated (in red) and downregulated (in blue) genes (log2FC; p.adj < 0.05) in the CM cluster of CMECFs versus hiPSC-CMs based on their scRNA-seq profiles. When applicable, heart and muscle isoforms were selected, although other organ isoforms were excluded. (B) Traces (left) and bar graphs (right) for oxidative phosphorylation (oxygen consumption rate, OCR) from Seahorse measurements in MTs. n > 52; ∗∗∗p < 0.001. (C) Traces (left) and bar graphs (right) for glycolytic acidification (extracellular acidification rate, ECAR) from Seahorse measurements in MTs. n > 44; p < 0.05; ∗∗p < 0.01; ∗∗∗p < 0.001. All data are shown as mean ± SEM. N indicates MTs from 3–5 independent batches per group. One-way ANOVA with Games-Howell multiple comparison test is shown.
Figure 6
Figure 6
Mechanisms Underlying hiPSC-CM Maturation in Microtissues with CFs and ECs (A) Proposed mechanism underlying hiPSC-CM maturation in MTs with CFs and ECs: ECs (green) secrete EDN1 that activates β-adrenergic signaling and adenylyl cyclase in CMs (red), increasing intracellular cAMP levels, which can enhance CX43 gap junction formation. ECs also secrete NO that activates cGMP pathway in CFs (blue). cGMP can shuttle to CMs via gap junctions (dotted blue arrow), sustaining cAMP in CMs. (B) Violin plots showing (log-transformed) expression of NOS3, EDN1, EDNRA, EGR1, ADCY5, and GUCY1A3 in CMECFs based on scRNA-seq. (C) Heatmap showing selected gene expression from bulk RNA-seq of CMECFs and CMEC SFs. (D) Immunofluorescence analysis of CX43 (green) and ACTN2 (red) in hiPSC-CMs and fibroblasts dissociated from CMECFs and CMEC SFs MTs. White arrows indicate coupling between hiPSC-CFs and hiPSC-CMs. SFs do not couple with hiPSC-CMs. Nuclei are stained with DAPI (blue). Scale bar: 50 μm. (E) Representative AP traces of untreated (CTRL, black) and 72-h-dbcAMP-treated (dbcAMP, gray) CTRL1 hiPSC-CMs, with quantification of RMP, APA, Vmax, contraction velocity, and acceleration. n > 10; dissociated cells per group; p < 0.001. Data are mean ± SEM. Student’s t test is shown. (F and G) Representative immunofluorescence images of CX43 (green) and ACTN2 (red) in MTs from CTRL1 hiPSCs, either untreated (CMECFs, CMEC SFs) or treated for 7 days with dbcAMP (CMECFs +dbcAMP, CMEC SFs +dbcAMP; F) and MTs from CTRL1 hiPSC containing either SFs transduced with control lentivirus (LV) (CMEC SFs empty LV) or lentivirus containing CX43 LV (CMEC SFs CX43 LV; G). Nuclei are stained with DAPI (blue). Scale bar: 10 μm. Insets are magnifications of framed areas to show CX43 distribution. (H and I) Sarcomere organization (sarcomere alignment index; H) and sarcomere length (I) from immunofluorescence analysis of MTs from CTRL1 hiPSCs. n = 30; areas from 3 MTs per group; ∗∗p < 0.05; ∗∗∗p < 0.005; ∗∗∗∗p < 0.0001. Data are mean ± SEM. One-way ANOVA with Tukey’s multiple comparisons test is shown. (J) Representative immunofluorescence images of cardiac sarcomeric proteins ACTN2 (red) and TNNI (green) in CMECFs generated from CTRL1 CMECFs containing either untreated hiPSC-CFs (CMECFs) or hiPSC-CFs transduced with CX43-shRNA (siCX43-CMECFs). Nuclei are stained with DAPI (blue). Scale bar: 10 μm. (K) TEM showing sarcomeres in CMECFs and siCX43-CMECFs. Scale bar: 0.5 μm. (L–N) Quantification of sarcomere organization (sarcomere alignment index; L) and sarcomere length (M) from immunofluorescence analysis in MTs (n = 60; areas from 4 MTs per group; p < 0.05) and of sarcomere length in MTs from TEM (-n; n > 117; areas from 3 independent stitches per group; p < 0.0001). Data are shown as mean ± SEM. Student’s t test is shown. (O) Contraction duration (left) and IBI (right) measured in spontaneously beating MTs. n > 40; MTs from 3 independent batches per group; p < 0.05. Student’s t test is shown. Data are shown as mean ± SEM.
Figure 7
Figure 7
Microtissues as a Model of Arrhythmogenic Cardiomyopathy (ACM) (A) Sequencing of PKP2 gene showing heterozygous c.2013delC (p.K672RfsX12) mutation in exon 10 in ACM hiPSCs. PKP2 sequence of CTRL1 hiPSCs is shown as reference. (B) Generation of CTRL and ACM MTs using CTRL hiPSC-CMs and CTRL hiPSC-ECs combined with either CTRL or ACM hiPSC-CFs or primary CTRL or ACM SFs. Cell percentages (black) and numbers (gray) are indicated at the top. (C) Representative bright-field images of CTRL- and ACM-CFs. Scale bar: 100 μm. (D) Western blot for PKP2 in CTRL and ACM hiPSC-EPIs and CFs. CTRL-EPIs were differentiated from two hiPSC lines (CTRL1 and CTRL2), although ACM EPI samples are two independent differentiations from ACM hiPSCs. CTRL and ACM CF samples are two and three independent differentiations from CTRL1 and ACM hiPSCs, respectively. GAPDH was used as loading control. Densitometric analysis is shown in the lower panel. (E) Immunofluorescence analysis of CX43 (green) in CTRL CMECFs, ACM CMECFs, CTRL CMEC SFs, and ACM CMEC SFs MTs. Nuclei are stained with DAPI (blue). Scale bar: 25 μm. (F and G) Quantification of CX43 per cell in CTRL and ACM CMECFs (F) and in CTRL and ACM CMEC SFs (G; n = 3; independent MT batches per group; ∗∗p < 0.005). Data are shown as mean ± SEM, normalized to the respective CTRL. Student’s t test is shown. (H) Representative contraction traces from CTRL and ACM CMECFs and CTRL and ACM CMEC SFs stimulated at 1 Hz, 2 Hz, and 3 Hz. (I) Percentages of MTs that could be paced at different stimulation frequencies in different MT groups (see legend). n > 10; MTs per group; p < 0.05. Data are shown as mean ± SEM. Chi-square test is shown. All data shown were from CTRL1 and/or CTRL2 hiPSC as a source of hiPSC-CMs, CFs, and primary SFs.

Comment in

References

    1. Agullo-Pascual E., Reid D.A., Keegan S., Sidhu M., Fenyö D., Rothenberg E., Delmar M. Super-resolution fluorescence microscopy of the cardiac connexome reveals plakophilin-2 inside the connexin43 plaque. Cardiovasc. Res. 2013;100:231–240. - PMC - PubMed
    1. Anders S., Pyl P.T., Huber W. HTSeq--a Python framework to work with high-throughput sequencing data. Bioinformatics. 2015;31:166–169. - PMC - PubMed
    1. Blazeski A., Lowenthal J., Wang Y., Teuben R., Zhu R., Gerecht S., Tomaselli G., Tung L. Engineered heart slice model of arrhythmogenic cardiomyopathy using plakophilin-2 mutant myocytes. Tissue Eng. Part A. 2019;25:725–735. - PMC - PubMed
    1. Bray M.-A., Vokes M.S., Carpenter A.E. Using CellProfiler for automatic identification and measurement of biological objects in images. Curr. Protoc. Mol. Biol. 2015;109:14.17.1–14.17.13. - PMC - PubMed
    1. Brette F., Orchard C. Resurgence of cardiac t-tubule research. Physiology (Bethesda) 2007;22:167–173. - PubMed

Publication types