. 2020 Jun 26;23(6):101140.
doi: 10.1016/j.isci.2020.101140. Epub 2020 May 26.

A Comprehensive Integrated Anatomical and Molecular Atlas of Rat Intrinsic Cardiac Nervous System

Affiliations

A Comprehensive Integrated Anatomical and Molecular Atlas of Rat Intrinsic Cardiac Nervous System

Sirisha Achanta et al. iScience. .

Abstract

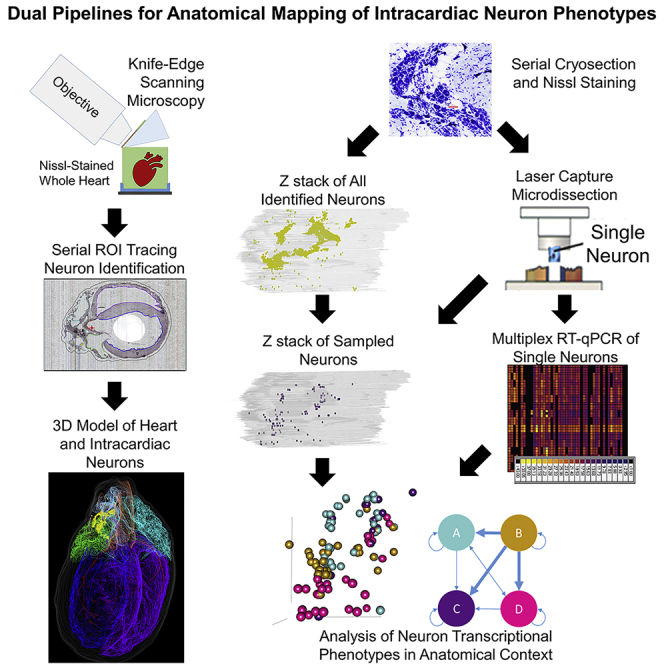
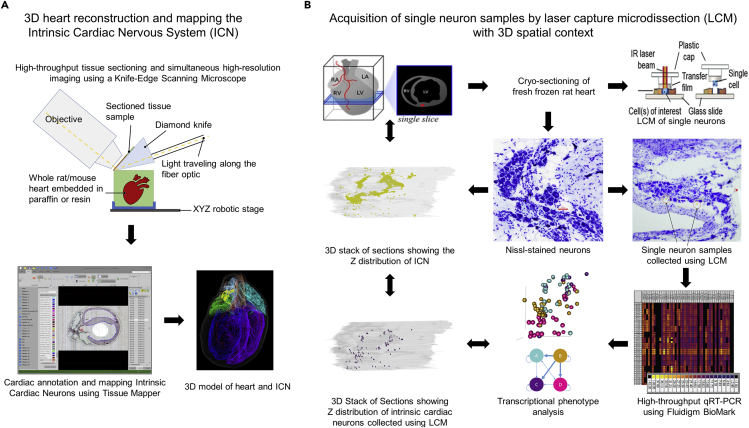
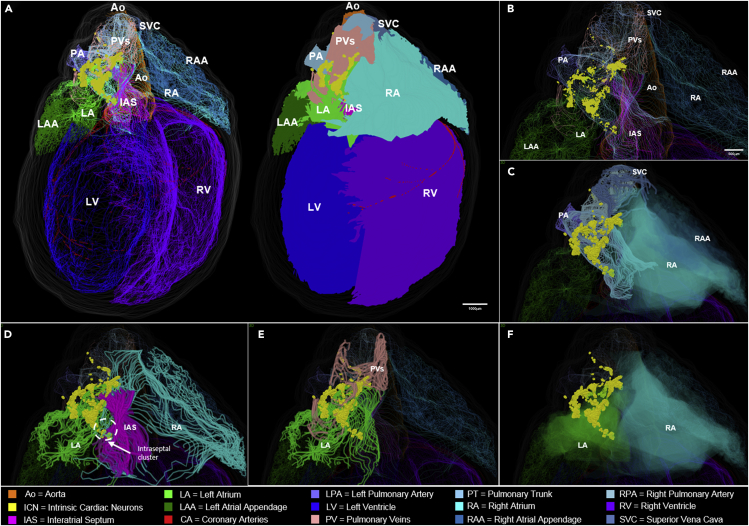
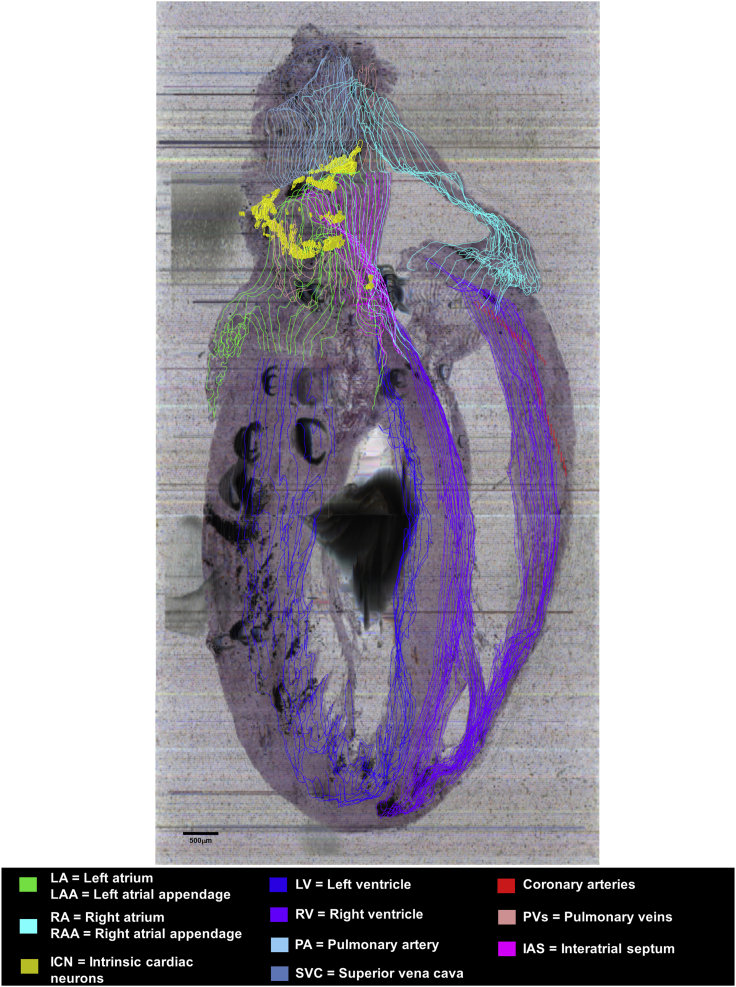
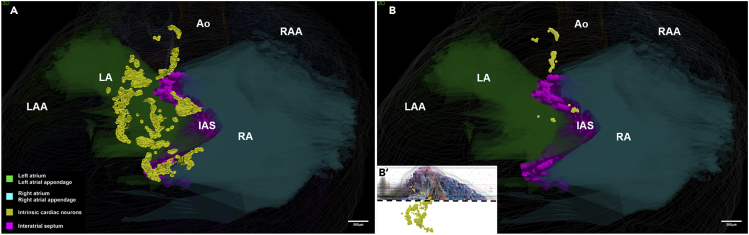
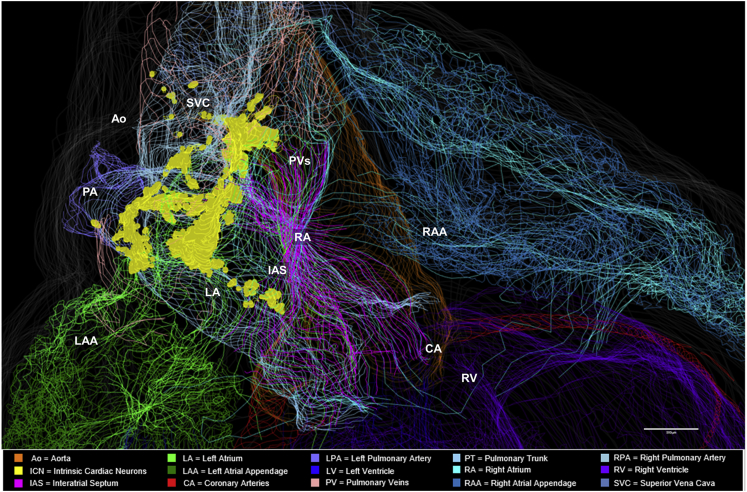
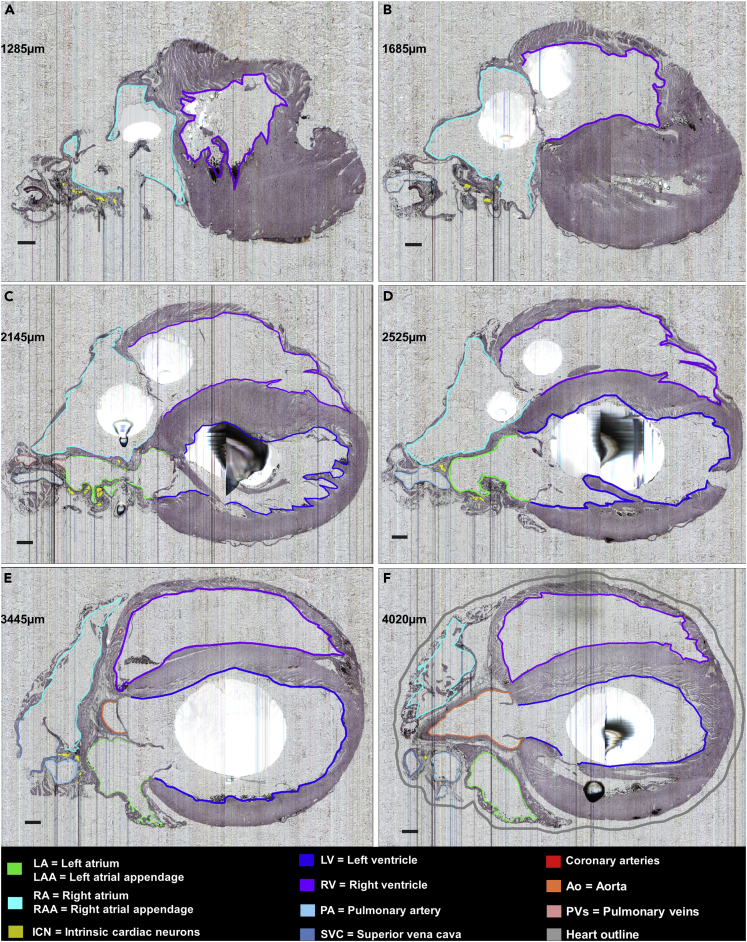
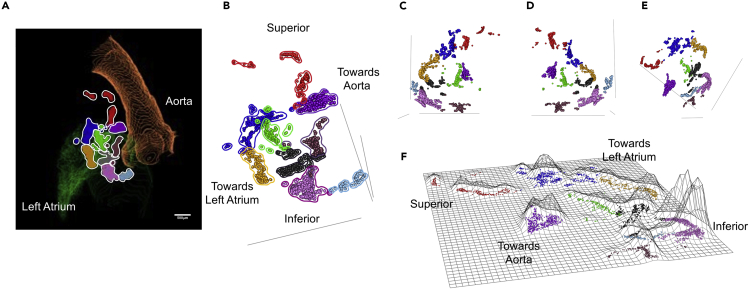
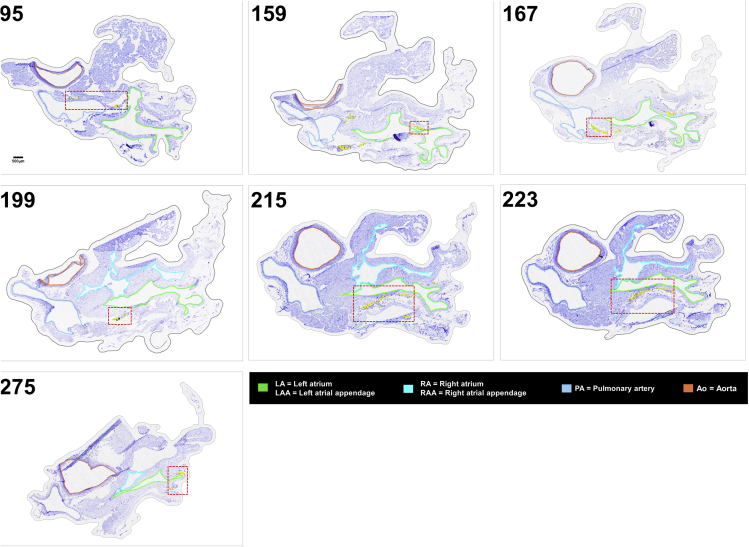
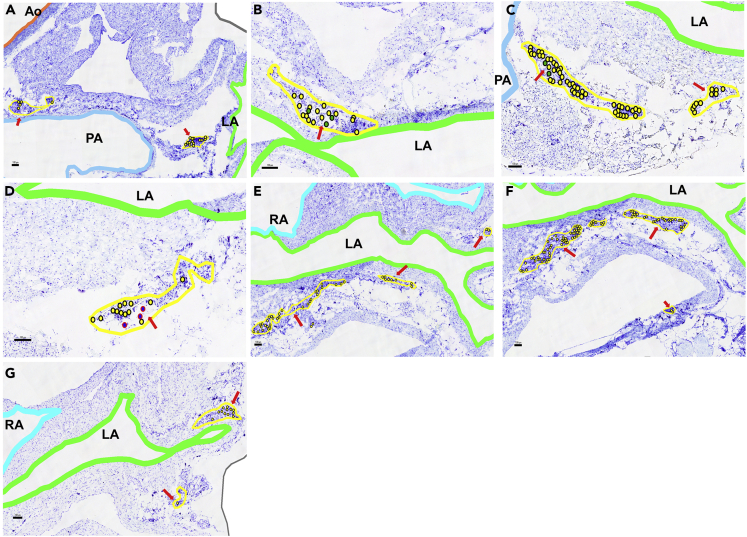
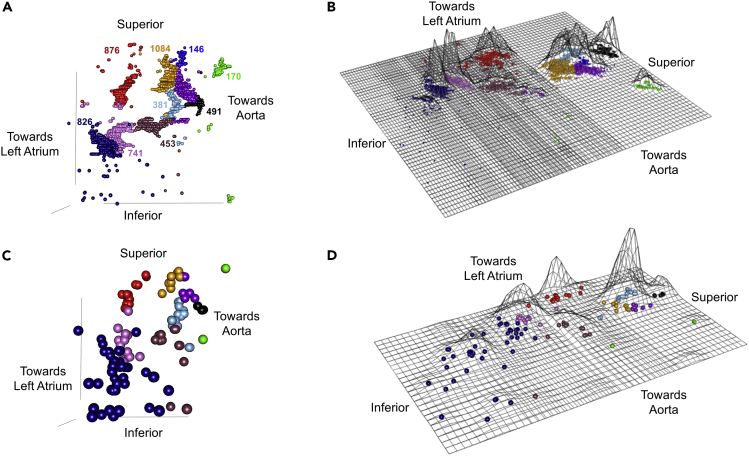
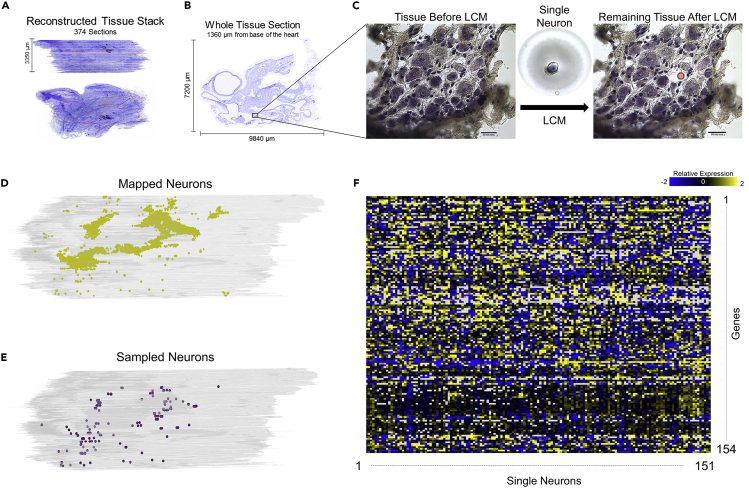
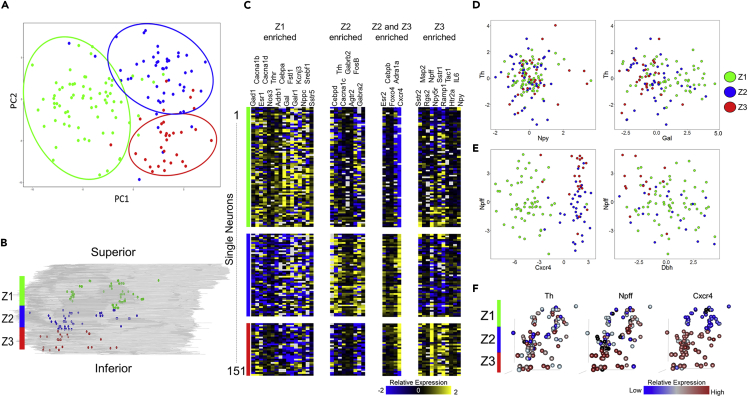
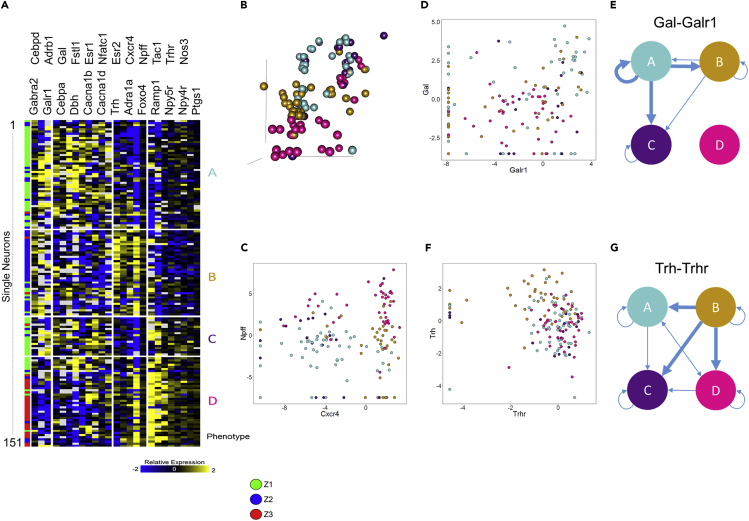
We have developed and integrated several technologies including whole-organ imaging and software development to support an initial precise 3D neuroanatomical mapping and molecular phenotyping of the intracardiac nervous system (ICN). While qualitative and gross anatomical descriptions of the anatomy of the ICN have each been pursued, we here bring forth a comprehensive atlas of the entire rat ICN at single-cell resolution. Our work precisely integrates anatomical and molecular data in the 3D digitally reconstructed whole heart with resolution at the micron scale. We now display the full extent and the position of neuronal clusters on the base and posterior left atrium of the rat heart, and the distribution of molecular phenotypes that are defined along the base-to-apex axis, which had not been previously described. The development of these approaches needed for this work has produced method pipelines that provide the means for mapping other organs.

Keywords: Cellular Neuroscience; Imaging Anatomy; Molecular Neuroscience; Rodent Cardiology; Small Animal Imaging; Transcriptomics.


Conflict of interest statement

Declaration of Interests S.T. and M.H. are paid employees of MBF Bioscience (Williston, VT). S.T. and M.H. are also funded by the NIH Common Fund award, OT3OD025349 to Dr. Shivkumar at University of California Los Angeles (subaward to J.S.S., R.V., J.C.), to create multi-scale, multi-organ, multi-species SPARC map management as a part of SPARC Portal. The software development efforts described in this manuscript preceded integration with SPARC DRC. Owing to intellectual property right restrictions, we cannot provide the Tissue Mapper, Tissue Maker or Biolucida Converter source code or its documentation at this time. Strateos and MBF Bioscience are commercial entities, and the authors affiliated with them are company employees. The remaining authors declare that no competing interests exist.

Figures

None
Graphical abstract
Figure 1
Figure 1
Data Acquisition Pipelines (A) Acquisition of a 3D, accurate organ reference framework using high-resolution collection of histological tissue sections. Once the entire heart is sectioned and imaged, the images are then compiled into an image volume by the TissueMaker software to enable 3D heart reconstruction and ICN mapping with the TissueMapper software. (B) Acquisition of cresyl violet-stained neuronal samples from fresh heart tissue by cryostat sectioning. Single neurons were identified by position in the ICN and lifted for qPCR or RNA-seq molecular phenotyping.
Figure 2
Figure 2
Posterior View of the 3D Reconstructed Male Rat Heart (A) Whole-heart view showing the context, extent, and distribution of the intrinsic cardiac neurons (ICN), located on superior and posterior surfaces of the atria. (B–F) A higher-resolution view of the atria and blood vessels that are shown in (B), with various contoured features of heart anatomy that are selectively removed to appreciate the anatomical relationship of the ICN to (C) the pulmonary artery and superior vena cava (SVC), (D) the interatrial septum, (E) the left atrium and pulmonary veins, (F) the right atrium, where clusters #1 and #2 appear to be on the surface of both atria, whereas cluster #3, which is located around the border of the superior vena cava, left atrium, and right atrium, appears on the right atrium. (See also Video S2). Scale bars: panel A, 1000 μm; panels B–F, 500 μm.
Figure 3
Figure 3
ICN Distribution in a Partial Projection of Sagittal Heart Sections A partial projection of contours and ICN in a 3-mm-thick sagittal image slab illustrates the distribution of neurons along the superior-inferior extent of the heart. Scale bar: 500 μm.
Figure 4
Figure 4
Superior View of the ICN (A and B′) (A) Viewing the ICN distribution (neurons mapped as yellow dots) looking from the base toward the apex. The left and right distribution of all ICN neurons is discriminated by their relationship to the interatrial septum. Note that most ICN neurons visualized in (A) are not all on the base of the heart but mostly distributed at more inferior-caudal levels of the heart on both atria. (B′) To selectively view those neurons on the base of the heart we took this posterior view of the full ICN and retained only those above the cutoff point indicated by the dotted black line. (B) Then these neurons are here observed from the superior view of the heart, showing the position of ICN neurons located within the hilum in between the aorta, superior vena cava, and pulmonary artery. (See also Video S3). Scale bars: 500 μm.
Figure 5
Figure 5
Distribution of More Inferiorly Located ICN Use of the TissueMapper Partial Projection tool that visualizes the ICN in a 3-mm-thick transverse image slab rotated in a superior view. This illustrates the locations in the transverse plane of section to highlight more inferiorly (caudally) located neurons. Neurons are represented as yellow dots. Scale bar: 500 μm.
Figure 6
Figure 6
ICN Distribution at Six Different Semi-sagittal Levels of the Heart (A–F) Histological sampling of the sagittal sections extending from the right to the left side of the heart at the levels indicated in microns in each panel. The neurons are mapped with yellow dots. The contours help to contextualize the distribution of ICN relative to other features of the heart. Sections are 5 μm, images are at 0.5 μm x-y resolution. The black blobs are artifacts of uneven paraffin embedding. Scale bar: 500 μm.
Figure 7
Figure 7
Identification of Neuronal Clusters in the Rat heart Nine clusters of neurons were identified using the partitioning around medoids (PAM) algorithm, where identified clusters are shown in different colors. (A) Visualization of mapped neurons in their 3D orientation in TissueMapper; contours show the aorta (orange) as well as the left atrium (green). (B) Visualization of mapped neurons in their 3D orientation. (C–E) Visualization of mapped neurons in their 3D orientation rotated to show different points of view. (F) Flat-mount projection of mapped neurons where the height of the contours are proportional to the density of neurons. The orientation in (E) matches the flat-mount projection in (F). (See also Video S5). Scale bar: 500 μm.
Figure 8
Figure 8
Candidate Sections of Female Rat Heart B to Contextualize the Laser Capture Microdissected Intrinsic Cardiac Neurons Each of the candidate sections provide additional context for the seven levels of laser capture microdissected neurons. The red boxed areas are the regions of interest that are zoomed in the following figure. Scale bar: 500 μm.
Figure 9
Figure 9
Enlarged Sections of LCM Lifted Intrinsic Cardiac Neurons from Six Different Levels in the Female Rat Heart B (A) Section 95: Small ganglia located between the aorta, pulmonary artery, and left atrium; all neurons marked yellow. (B) Section 159: neurons are lifted from a medium ganglia near the left atrium and are grouped in the Z1 molecular cluster; cells marked green. (C) Section 167: Z1 neurons that are located around the left atrium and pulmonary artery; cells marked green. (D) Section 199: LCM-sampled neurons that were characterized as the Z2 group were part of a small ganglia; cells marked blue. (E) Section 215: Neurons were sampled from ganglia near the left atrium and right atrium. (F) Section 223: LCM-sampled neurons from a large cluster near the left atrium. (G) Section 275: LCM-sampled neurons around the left atrium. Scale bars: 100 μm. Red arrows mark the locations of relevant neurons.
Figure 10
Figure 10
Identification of Neuronal Clusters in the Rat Heart B (A–D) Visualization of mapped neurons (A) and sampled neurons (C) in their 3D orientation. Flat-mount projection of mapped neurons (B) and sampled neurons (D) where the heights of the contours are proportional to the density of neurons. Ten clusters of neurons were identified using the partitioning around medoids (PAM) algorithm, where identified clusters are shown in different colors. (See also Video S6).
Figure 11
Figure 11
Process of Collecting and Mapping Neurons from the Rat Heart (A and B) (A) A rat heart was sectioned at 20 μm, imaged, and put into a 3D stack in TissueMaker. The red outline shows a specific section shown in (B). (C–E) (C) The selected region from (B) is shown in a magnified view before and after laser capture microdissection, where the single neuron that has been collected can be seen on the LCM cap (middle). Scale bar: 50 μm. Distribution of mapped neurons (D) and sampled neurons (E) in the context of their 3D location as seen in TissueMapper. (F) Normalized qRT-PCR data showing expression of 154 genes for the 151 samples collected.
Figure 12
Figure 12
Spatial Gradients of Gene Expression Profiles in the Rat ICN (A and B) Principal-component analysis (PCA) plot of the 151 collected samples (A) show distinct separation according to their position along the z axis of the heart (B). Samples were divided into three groups along the z axis spanning from Z1 at the base of the heart to Z3 toward the apex. (C) Pavlidis template matching using Pearson correlation with a cutoff of 0.01 was used to find genes that show specific enrichment in one or more Z groups. A cutoff of 0.001 was used to find genes enriched in both the Z2 and Z3 groups to increase specificity. (D) Expression of tyrosine hydroxylase (Th) versus neuropeptide Y (Npy) (left) and Galanin (Gal) (right). (E) Expression of neuropeptide FF (Npff) versus Cxcr4 (left) and Dbh (right). (F) 3D position of collected samples colored for expression of Th, Npff, and Cxcr4. Th (F, left) and Npy (D, left) show little correlation between expression level and spatial location, whereas Galanin (D, right) appears to be upregulated in the Z1 group. Npff (F, middle and E, left) shows downregulation in the Z2 group and distinct upregulation in the Z3 group. Cxcr4 (F, right and E, left) shows very high correlation between expression level and spatial location where expression is significantly downregulated in the Z1 group and significantly upregulated in the Z2 and Z3 groups. Dbh (E, right) shows mixed expression in the Z1 and Z2 groups with low expression in the Z3 group. It can also be seen that Npff and Dbh are anticorrelated in the Z3 group. For all panels, Z1 is represented in green, Z2 in blue, and Z3 in red.
Figure 13
Figure 13
Neuronal Phenotypes Contributing to Spatial Separation (A) ANOVA was performed with a threshold of 0.001 to find genes that contribute to the separation seen between the three Z groups. Selected genes were clustered using Pearson correlation, resulting in the heatmap shown and giving rise to four different neuronal phenotypes (labeled A–D). We can see that the Z1 group was split into phenotypes A and C, with some samples from the Z1 group clustering along with the Z3 group in phenotype D. Phenotype B is composed mostly of samples residing in the Z2 group. (B) 3D position of collected samples, colored by phenotype. (C) Expression of Npff versus Cxcr4, colored for phenotype. We can see that the comparison of these two genes largely determines the phenotypes. Phenotype A is mostly composed of cells that have low expression of Npff and Cxcr4. Phenotype B is composed mostly of cells that have low expression of Npff and high expression of Cxcr4. Phenotype C is composed largely of cells that have high expression of Npff and low expression of Cxcr4. Phenotype D is composed largely of cells that have high expression of both Npff and Cxcr4. (D) Expression of Galanin versus its receptor Galr1 and (E) network diagram of putative galanin-mediated connectivity between neuronal phenotypes. (F and G) (F) Expression of thyrotropin-releasing hormone (Trh) and its receptor Trhr and (G) network diagram of putative Trh-mediated connectivity between neuronal phenotypes.

References

    1. Ai J., Gozal D., Li L., Wead W.B., Chapleau M.W., Wurster R., Yang B., Li H., Liu R., Cheng Z. Degeneration of vagal efferent axons and terminals in cardiac ganglia of aged rats. J. Comp. Neurol. 2007;504:74–88. - PubMed
    1. Allard M., Labrouche S., Nosjean A., Laguzzi R. Mechanisms underlying the cardiovascular responses to peripheral administration of NPFF in the rat. J. Pharmacol. Exp. Ther. 1995;274:577–583. - PubMed
    1. Armour J.A., Murphy D.A., Yuan B.X., Macdonald S., Hopkins D.A. Gross and microscopic anatomy of the human intrinsic cardiac nervous system. Anat. Rec. 1997;247:289–298. - PubMed
    1. Arora R.C., Cardinal R., Smith F.M., Ardell J.L., Dell’Italia L.J., Armour J.A. Intrinsic cardiac nervous system in tachycardia induced heart failure. Am. J. Physiol. Regul. Integr. Comp. Physiol. 2003;285:R1212–R1223. - PubMed
    1. Beaumont E., Salavatian S., Southerland E.M., Vinet A., Jacquemet V., Armour J.A., Ardell J.L. Network interactions within the canine intrinsic cardiac nervous system: implications for reflex control of regional cardiac function. J. Physiol. (Lond) 2013;591:4515–4533. doi: 10.1113/jphysiol.2013.259382. - DOI - PMC - PubMed