. 2020 May 26;31(8):107681.
doi: 10.1016/j.celrep.2020.107681.

Prophase-Specific Perinuclear Actin Coordinates Centrosome Separation and Positioning to Ensure Accurate Chromosome Segregation

Affiliations

Prophase-Specific Perinuclear Actin Coordinates Centrosome Separation and Positioning to Ensure Accurate Chromosome Segregation

Tom Stiff et al. Cell Rep. .

Abstract

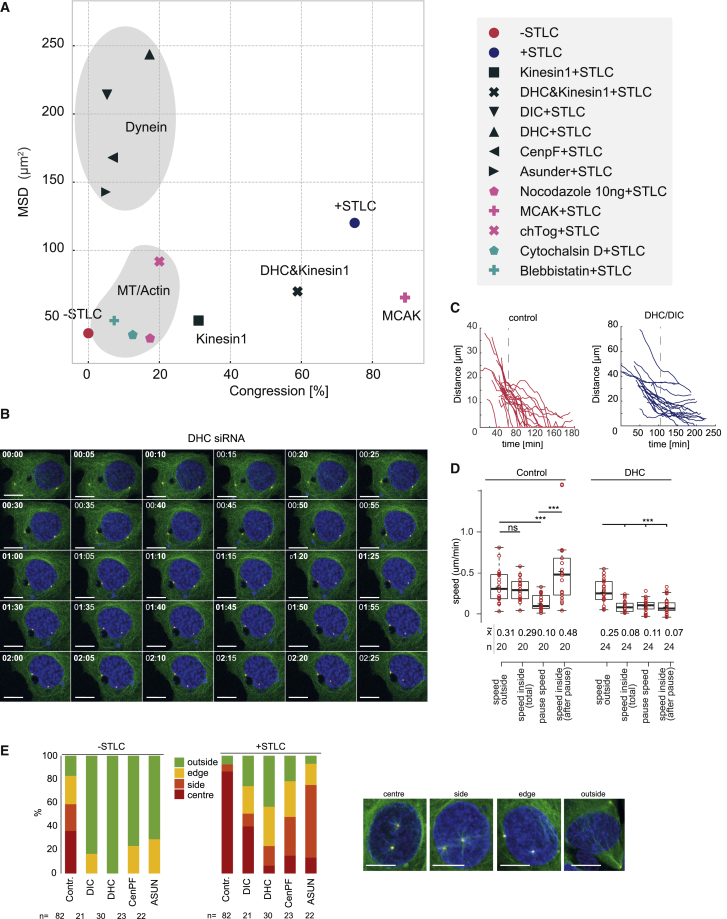
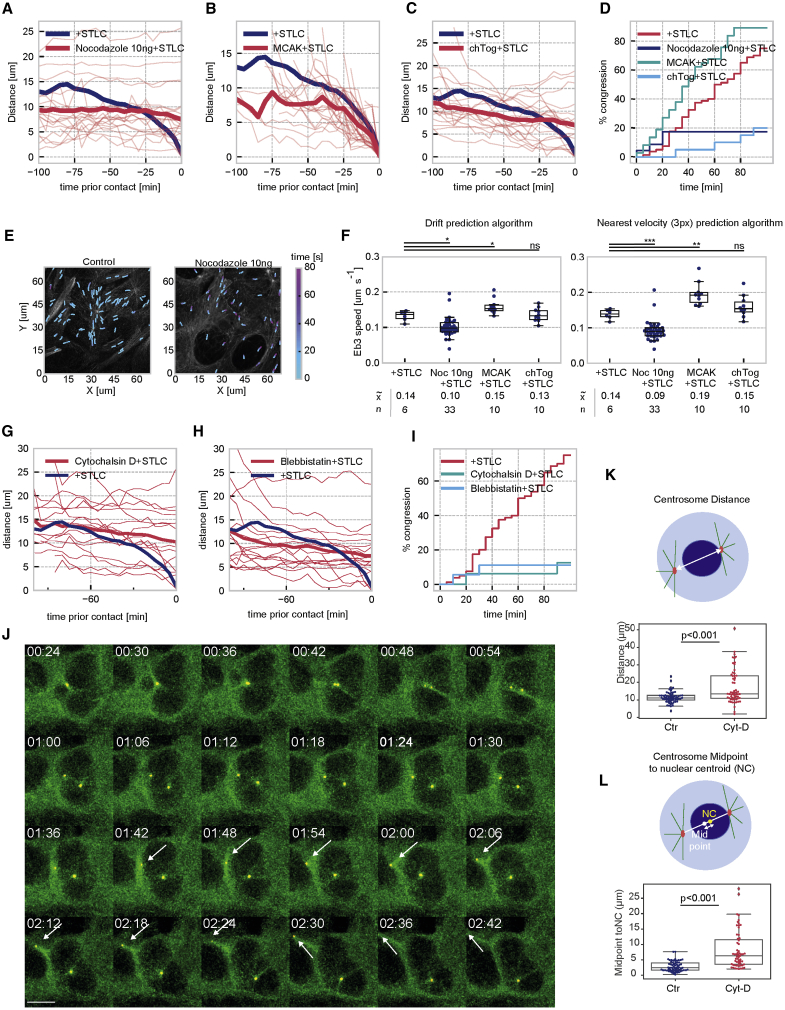
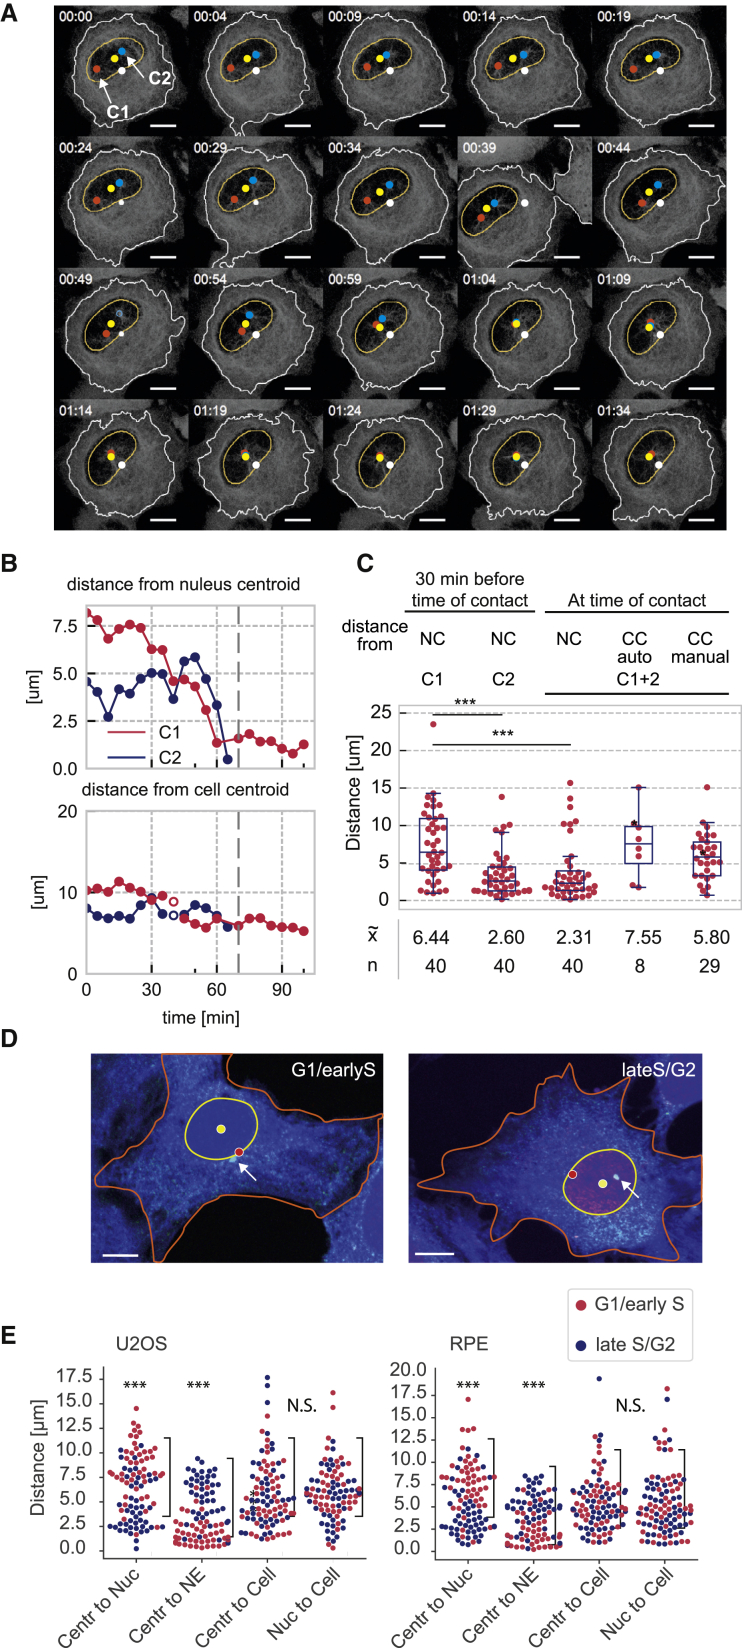
Centrosome separation in late G2/ early prophase requires precise spatial coordination that is determined by a balance of forces promoting and antagonizing separation. The major effector of centrosome separation is the kinesin Eg5. However, the identity and regulation of Eg5-antagonizing forces is less well characterized. By manipulating candidate components, we find that centrosome separation is reversible and that separated centrosomes congress toward a central position underneath the flat nucleus. This positioning mechanism requires microtubule polymerization, as well as actin polymerization. We identify perinuclear actin structures that form in late G2/early prophase and interact with microtubules emanating from the centrosomes. Disrupting these structures by breaking the interactions of the linker of nucleoskeleton and cytoskeleton (LINC) complex with perinuclear actin filaments abrogates this centrosome positioning mechanism and causes an increase in subsequent chromosome segregation errors. Our results demonstrate how geometrical cues from the cell nucleus coordinate the orientation of the emanating spindle poles before nuclear envelope breakdown.

Keywords: Eg5; FHOD1; G2/M transition; LINC complex; centrosome positioning; centrosome separation; centrosome tracking; mitotic entry; perinuclear actin, microtubules.


Conflict of interest statement

Declaration of Interests The authors declare no competing interests.

Figures

None
Graphical abstract
Figure 1
Figure 1
Centrosomes Reach a Stable Position along the Nuclear Diameter at NEBD (A) Centrosome separation in asynchronously dividing U2OS cdk1as cells (see also Video S1). Left panels show still images of two representative examples of centrosome separation in asynchronous cells. The cells stably expressed alpha-tubulin-GFP shown in white and RFP-PACT (not shown). Time is indicated in hours:minutes (h:min). The scale bar represents 10 μm and applies to each image. The top right panel shows centrosome distance (μm) over time (min) of single-cell experiments. The tracks were aligned by the time of separation. Tracks before separation are shown in gray, actively separating tracks are shown in red, and post-separation tracks are shown in blue. The bottom right panel shows the average mean square displacement (MSD) of each centrosome. For each cell, centrosomes were grouped into high displacement (red) and low displacement (blue), and the MSD for each group is plotted. The shaded area indicates the standard deviation. Tracking data are from three experiments with a combined n = 37. (B) Centrosome separation in 1NM-PP1-arrested U2OS cdk1as cells (see also Video S2). As in (A), but this time, cells were arrested for 20 h in 2 μM 1NM-PP1 and 5 μM STLC. The cells were washed 10 times in 1NM-PP1 medium without STLC before starting the imaging sequence. Tracking data are from three experiments with a combined n = 52. (C) Centrosome congression in 1NM-PP1-arrested U2OS cdk1as cells (see also Video S3). As in (A) and (B), but this time, cells were treated for 20 h in 1 μM 1NM-PP1 to allow centrosome separation to proceed. 5 μM STLC was added before initiating the imaging experiment. The still images in (A), (B), and (C) correspond to Videos S1, S2, and S3, respectively. Tracking data are from three experiments with a combined n = 80. (D) Quantification of centrosome angle with regard to the nuclear centroid. The diagram on the left indicates the procedure of this measurement. Nuclei and centrosomes were segmented, then nuclear centroid and centrosome angle were calculated based on the segmented data. The angles of centrosomes at NEBD in asynchronous cells and 2 h after STLC washout in 1NM-PP1-arrested cells are shown in the swarm plot (n = 120 per experiment). (E) Centrosome speed based on tracks shown in (A), (B), and (C). Speed was calculated as distance over time. For (D) and (E), p values were calculated using an independent two-sample t test. Levels of significance are indicated by stars (p < 0.05, ∗∗p < 0.01, ∗∗∗p < 0.001). The boxplot indicates median, first and third quartiles, and minimum/maximum values.
Figure 2
Figure 2
The Dynein/Kinesin-1 Balance Is Critical for Congression along the NE (A) Summary of MSD and congression data. Mean values of MSD (y axis) and percent congression (x axis) are plotted of all congression experiments performed in this paper. Dynein and MT/actin clusters are highlighted by gray areas. Individual data points are referenced in the figure legend to the right. See Figure S1 for confirmation of siRNA depletions. (B–D) Centrosome congression in DHC-depleted cells in cytoplasm and at the NE. (B) Images from time-lapse video of centrosome congression in DHC-depleted cells (green, GFP-α-tubulin; red, RFP-PACT; blue, Hoechst-33342-labeled DNA). Time is indicated in h:min on the top left, and scale bar represents 10 μm (see also Video S3). (C) Individual tracks of distance over time in control and DHC-depleted cells. Tracks are aligned along the time axes by the point of contact of both centrosomes with the nucleus. (D) Quantification of speed in the cytoplasm (outside) and nucleus (inside) 0–20 min after reaching the nucleus (pause) and t > 20 min after reaching the nucleus (after pause). See also Figure S2 for more data on dynein depletion and centrosome congression. p values were calculated using an independent two-sample t test. Levels of significance are indicated by stars (p < 0.05, ∗∗p < 0.01, ∗∗∗p < 0.001). The boxplot indicates median, first and third quartiles, and minimum/maximum values. (E) Qualitative analysis of centrosome position before and 2 h after STLC treatment following indicated siRNA depletions. Centrosome position was scored as indicated in color legend (n indicates the number of live-cell imaging sequences analyzed). Examples of positions are shown in images below (scale bar, 10 μm).
Figure 3
Figure 3
Centrosome Congression Depends on MT Polymerization (A–C) Measuring congression after manipulating MT polymerization Following 20-h arrest in 2 μM 1NM-PP1, cells with two separated centrosomes were followed by live-cell imaging after treatment with 5 μM STLC, and centrosome position was tracked to measure inter-centrosomal distance over time. (A) Cells treated with 10 ng/mL nocodazole. (B) Cells following 48-h MCAK siRNA depletion. (C) Cells following 48-h ch-TOG siRNA depletion. For all graphs, the bold blue line indicates the average congression tracks of control cells (see Figure 1). Individual tracks of cells are shown in red, and bold red lines represent the mean values. (D) Quantification centrosome congression. Data from (A)–(C) were used to calculate percentage of cells in which centrosomes joined together over time following the different treatments indicated in the legend. Each treatment was repeated in at least three independent experiments with total n = 23 (Noc), n = 20 ch-TOG), and n = 37 (MCAK). (E) EB3 comet tracking. Examples of MT tracking in RFP-EB3-expressing U2OS cdk1as cells following 20-h treatment with 1 μM 1NM-PP1. (F) Quantification of MT tracking. EB3 tracks in cells subjected to indicated treatments were analyzed using drift prediction and nearest speed tracking algorithms with a search radius of 3 pixels. Data were plotted for each condition as swarm/boxplots showing the mean of individual tracks per cell and the median plus 25 and 75 percentiles. p values were estimated using a two-sided t test. (G–I) Centrosome congression following changes in actin dynamics. As in Figure 2, U2OS cdk1as cells were treated for 20 h with 2μM 1NM-PP1, and cells with two separated centrosomes were analyzed by live-cell imaging and centrosome tracking following STLC treatment to measure inter-centrosomal distance over time. Cells were pretreated for 1 h with (G) 2 μg/mL cytochalasin D and (H) 5 μM blebbistatin. For all graphs, the bold blue line indicates the average congression tracks of control cells (see Figure 1). Individual tracks of cells are shown in red, and bold red lines represent the mean values. (I) Quantification centrosome congression. Data from (A)–(C) were used to calculate percentage of cells in which centrosomes joined together over time following the different treatments indicated in the legend. Each treatment was repeated in at least three independent experiments with total n = 18 (Blebbistatin), n = 16 (Cytochalasin-D). (J) Centrosome separation in cytochalasin-D-treated cells (see also Video S4). Images of time-lapse video showing centrosome separation (green, GFP-alpha-tubulin; red, RFP-PACT; time is indicated in h:min on the top left, and scale bar represents 10 μm) following STLC washout in cells that were treated with 2 μM 1NM-PP1 and 5 μM STLC for 20 h. Following an hour-long pretreatment with cytochalasin D, cells were washed with STLC-free medium before imaging. (K) Quantification of centrosome distance. Maximal distance was measured 2 h after STLC release. (L) Quantification of centrosome alignment. Geometrical alignment of centrosomes toward the nuclear centroid was measured as the distance from the midpoint between centrosomes to the nuclear centroid position (see diagram for graphic representation). Data in (F) and (G) are from three experiments (total n > 50 for each condition). For (F), (K), and (L), p values were calculated using an independent two-sample t test. Levels of significance are indicated by stars (p < 0.05, ∗∗p < 0.01, ∗∗∗p < 0.001). The boxplot indicates median, first and third quartiles, and minimum/maximum values.
Figure 4
Figure 4
Centrosomes Congress toward the Nuclear Centroid (A) Automated tracking of centrosome position (see also Video S5). Still images describing the tracking of centrosome position using nuclear and cellular centroid as a reference. Nuclear and cellular masks were generated by automated image segmentation (see STAR Methods), the centroid was determined, and centrosome distance relative to nuclear and cellular centroid (yellow dot for nuclear and white dot for cellular centroid) was calculated using vector addition. Time is indicated in h:min on the top left; scale bar represents 10μm. (B) Quantification of tracking data. Centrosome tracks from the time-lapse experiment in (A) showing distance from nuclear and cellular centroid (μm) for centrosome 1 (C1, red) and centrosome 2 (C2, blue); dashed gray line indicates the time point when C1 and C2 make contact. (C) Data from population analysis. Distance from centroids 30 min before and at the time of contact was estimated as shown in (A) (nuclear centroid [NC], 32 tracks; cellular centroid [CC], 8 tracks). For cellular centroid estimation, automated segmentation was successful in only eight cells (due to problems with distinction from neighboring cells). Manual estimation of cellular centroid was performed at time of contact for 29 more tracks as indicated. p values were calculated using an independent two-sample t test. Levels of significance are indicated by stars (p < 0.05, ∗∗p < 0.01, ∗∗∗p < 0.001). The boxplot indicates median, first and third quartiles, and minimum/maximum values. (D) Analysis of nuclear positioning in U2OS cells by immunofluorescence. G2 cells were identified by CENPF staining (red), cell shape was visualized using CellTracker blue, and centrosomes were detected using gamma-tubulin staining (green). Nuclear mask and centrosomes were segmented in Python using the skimage library, while cell shape was estimated manually. Images show centrosome position in G1/early S (CENPF-negative) and late S/G2 (CENPF-positive) U2OS cells. The nuclear centroid is shown in yellow, and the cellular centroid is shown in red; centrosomes were stained using gamma-tubulin antibodies (green) and are indicated by arrow. The scale bar indicates 10 μm. (E) Quantification of centrosome position in U2OS and RPE cells. U2OS and RPE cells were analyzed as described in (D) and plotted grouping CENPF-negative (G1/early S) cells in red and CENPF-positive (late S/G2) cells in blue (three experiments, n = 50 per group and experiment). The data show distances (in μm) for centrosome to nuclear centroid, centrosome to NE, centrosome to cellular centroid, and nuclear centroid to cellular centroid. Significance for differences between the CENPF-positive and negative groups for each measurement was calculated using a two-sided t test.
Figure 5
Figure 5
Prophase-Specific Perinuclear Actin Structures Coordinate Centrosome Positioning and Restrain Eg5-Dependent Separation (A) Perinuclear actin interacts with centrosomal MT asters (see also Video S6). Images from time-lapse video of centrosome congression following STLC treatment of 1NM-PP1-arrested U2OS cdk1as cells showing perinuclear actin structures (green, GFP-alpha-tubulin; red, SiR-actin; scale bar, 10 μm). (B) Phalloidin staining of G2/prophase-specific perinuclear actin in fixed U2OS cells. Images of fixed wild-type (WT) U2OS probed by immunofluorescence and phalloidin staining. The panels show examples of individual prophase cells. Top panels show overlays (phalloidin, red; gamma-tubulin, green; and DAPI, blue). The bottom panel shows the phalloidin staining (scale bar, 10 μm). The graph on the right shows the average percentage of cells with perinuclear actin structures in indicated cell-cycle phases (three experiments, n > 30, error bars indicate standard deviation). (C) G2/prophase-specific perinuclear actin in asynchronous U2OS cells detected by SiR-actin in living cells (see also Video S7). Images from a time-lapse movie in asynchronous U2OS cells showing formation of perinuclear actin structures in prophase (green, GFP-alpha-tubulin; red, SiR-actin; scale bar, 10 μm). See also Video S7. (D) Imaging of MT/actin interactions by SRRF processing. 1NM-PP1-arrested U2OS cdk1as cells were labeled by immunofluorescence and imaged using the SRRF technique. Phalloidin is shown in red and tubulin in green in the overlay. The smaller panels on the right show examples of MTs either stopping at or crossing the perinuclear actin ring. Scale bar, 5 μm.
Figure 6
Figure 6
Disrupting LINC/Actin Interactions Disrupts Centrosome Separation and Positioning (A) Effects of GFP-N2G-H and GFP-FHOD1(1–339) expression on perinuclear actin. U2OS cdk1as cells were transiently transfected with GFP, GFP-N2G-H, and GFP-FHOD1(1–339) expression vectors. 24 h after transfection, the cells were arrested in G2 phase by treatment with 2 μM 1NM-PP1 for 20 h and then fixed and stained with phalloidin (red), pericentrin (green), and DAPI (blue). The scale bar indicates 10 μm. Top panels show overlays, and the bottom panel shows the phalloidin staining in black and white (b/w). (B) Quantification of perinuclear actin. Intensity profiles were measured in ImageJ along manually generated regions of interest (ROIs) representing a line crossing the NE. The highest intensity of each line was taken as 100%, and relative intensities are plotted. Bold lines indicate the mean values and the shaded areas the standard deviation (3 experiments, total n = 20 cells per condition). (C–E) Effects of GFP-N2G-H and FHOD1(1–339) on centrosome congression (see also Video S8, right panel). Centrosome congression assays were performed as described in Figure 1 in cells transiently expressing GFP, GFP-N2G-H, or FHOD1(1–339). (C) Representative example of a GFP-FHOD1(1–339) expressing cell. Images show SiR-tubulin-labeled MTs at indicated time points (h:min) following treatment with 5 μM STLC. (D) Quantification of percent of congression in GFP, GFP-N2G-H, or FHOD1(1–339) expression cells (mean of three experiments is shown, and the error bars indicate standard deviation; n > 50 per experiment). (E) Tracks of centrosome congression over 60 min following STLC treatment (10 individual tracks are shown, and the mean is indicated by thicker line; n > 50 per experiment). The scale bar indicates 10 μm. (F–H) Effects of GFP-N2G-H and FHOD1(1–339) on centrosome separation (see also Video S8, left panel). Centrosome separation was assayed in 1NM-PP1-arrested U2OS cdk1as cells transiently expressing GFP, GFP-N2G-H, or FHOD1(1–339) following release from STLC as described in Figure 1. (F) Representative example of a GFP-FHOD1(1–339)-expressing cell. Images show SiR-tubulin-labeled MTs at indicated time points (h:min) following release from STLC treatment. (G) Quantification of percent separation in cells expressing GFP, GFP-N2G-H, or FHOD1(1–339) (mean of three experiments is shown, the error bars indicate standard deviation, n > 50 per experiment). (H) Qualitative analysis of centrosome positioning 3 h following STLC release. In controls most centrosomes were aligned along the nuclear diameter underneath the nucleus or at the border of the NE. GFP-N2G-H and FHOD(1–339) expressing cells mostly failed to reach this position and resided toward the side of the nuclear border (mean of three experiments is shown, and error bars indicate standard deviation; n > 50 per experiment). The scale bar indicates 10 μm. (I and J) Effects of cytochalasin D, GFP-N2G-H, and FHOD1(1–339) on MT polymerization. RFP-EB3-expressing U2OS cdk1as cells were arrested for 20 h in 2 μM 1NM-PP1 and 5 μM STLC, treated with 2 μg/mL cytochalasin D and 20 ng/mL nocodazole, or transfected with GFP-N2G-H or FHOD-1 (1–339) expression vectors 24 h before arrest. 50 EB3 comets per cell were tracked manually, and comet speed and MSD were calculated. Median speed (x) and number of analyzed cells per condition (n) are indicated. For (D), (G), (H), and (J), p values were calculated using an independent two sample t test. Levels of significance are indicated by stars (∗p < 0.05, ∗∗p < 0.01, ∗∗∗p < 0.001). The boxplot indicates median, first and third quartile, and minimum/maximum values.
Figure 7
Figure 7
Expression of Dominant-Negative GFP-Nesprin N2G-H and FHOD1(1–339) Causes Centrosome Separation and Positioning Defects and Chromosome Segregation Errors in Asynchronously Dividing U2OS Cells (A) Effects of GFP-N2G-H and FHOD1(1–339) domains on centrosome position and sister chromatid segregation Representative images of cells transiently expressing GFP, GFP-N2G-H, and GFP-FHOD1(1–339). The time-lapse images show the same cell at NEBD, metaphase, and anaphase. The overlays show histone H2B-fusionRed in blue and SiR-tubulin in red. Black and white images show single-channel images of SiR-tubulin. The arrows indicate lagging chromosomes, and the scale bar represents 5 μm. The diagrams below the image panels show the measurement of the axis between centrosomes at NEBD and the spindle poles at metaphase. This was used to estimate the degree of spindle rotation between NEBD and metaphase in (D). (B–D) Quantitative analysis of mitotic phenotypes. Mitotic progression was analyzed from three transient transfection experiments (total n = 40 for GFP, 30 for GFP-N2G-H, and 20 for GFP-FHOD1). Each cell was classified according to the presence (red dots) or absence (blue dots) of chromosome bridges in anaphase. (B) Quantification of the time spent between mitotic entry and anaphase. (C) Distance between the centrosomes at NEBD. (D) Angle between the centrosome axis at NEBD and the spindle pole axis at metaphase as indicated in the diagrams in (A). p values for (B) and (C) were estimated using a two-sided t test. p values for (D) were estimated using a Mann-Whitney test due to the non-normal distribution of the angle measurements. The boxplot indicates median, first and third quartiles, and minimum/maximum values. (E) Quantification of percentage of cells that display anaphase chromosome bridges. (F–I) Inducible expression of GFP-N2G-H and FHOD1(1–339) domains in RPE-1 cells. (F) RPE-1 cells were engineered to stable express GFP-N2G-H and GFP-FHOD1(1–339) from a doxycycline-inducible promoter using the sleeping beauty transposon system. Induction of protein expression was confirmed 24 h after addition of 2 μg/mL doxycycline to the growth medium by immunoblotting with GFP antibodies. (G) Colony-formation assays of RPE-1 cells expressing the indicated cDNAs from the inducible promoter in growth medium with or without 2 μg/mL. (H) Quantification of cell proliferation following 5-day growth in 2 μg/mL doxycycline addition by nuclei counting. (I) Display of representative Hoechst-stained nuclei in RPE-1 cells expressing GFP, GFP-N2G-H, or GFP-FHOD1(1–339) 5 days after doxycycline induction (scale bar, 10 μm). For (E) and (H), p values were calculated using an independent two sample t test. Levels of significance are indicated by stars (∗p < 0.05, ∗∗p < 0.01, ∗∗∗p < 0.001). Error bars show standard deviation.

References

    1. Agircan F.G., Schiebel E., Mardin B.R. Separate to operate: control of centrosome positioning and separation. Philos. Trans. R. Soc. Lond. B Biol. Sci. 2014;369 20130461–20130461. - PMC - PubMed
    1. Antoku S., Zhu R., Kutscheidt S., Fackler O.T., Gundersen G.G. Reinforcing the LINC complex connection to actin filaments: the role of FHOD1 in TAN line formation and nuclear movement. Cell Cycle. 2015;14:2200–2205. - PMC - PubMed
    1. Bahe S., Stierhof Y.-D., Wilkinson C.J., Leiss F., Nigg E.A. Rootletin forms centriole-associated filaments and functions in centrosome cohesion. J. Cell Biol. 2005;171:27–33. - PMC - PubMed
    1. Bolhy S., Bouhlel I., Dultz E., Nayak T., Zuccolo M., Gatti X., Vallee R., Ellenberg J., Doye V. A Nup133-dependent NPC-anchored network tethers centrosomes to the nuclear envelope in prophase. J. Cell Biol. 2011;192:855–871. - PMC - PubMed
    1. Booth A.J.R., Yue Z., Eykelenboom J.K., Stiff T., Luxton G.W.G., Hochegger H., Tanaka T.U. Contractile acto-myosin network on nuclear envelope remnants positions human chromosomes for mitosis. eLife. 2019;8:e46902. - PMC - PubMed

Publication types