. 2020 May 26;31(8):107691.
doi: 10.1016/j.celrep.2020.107691.

Expression of RUNX1-ETO Rapidly Alters the Chromatin Landscape and Growth of Early Human Myeloid Precursor Cells

Affiliations

Expression of RUNX1-ETO Rapidly Alters the Chromatin Landscape and Growth of Early Human Myeloid Precursor Cells

Monica Nafria et al. Cell Rep. .

Abstract

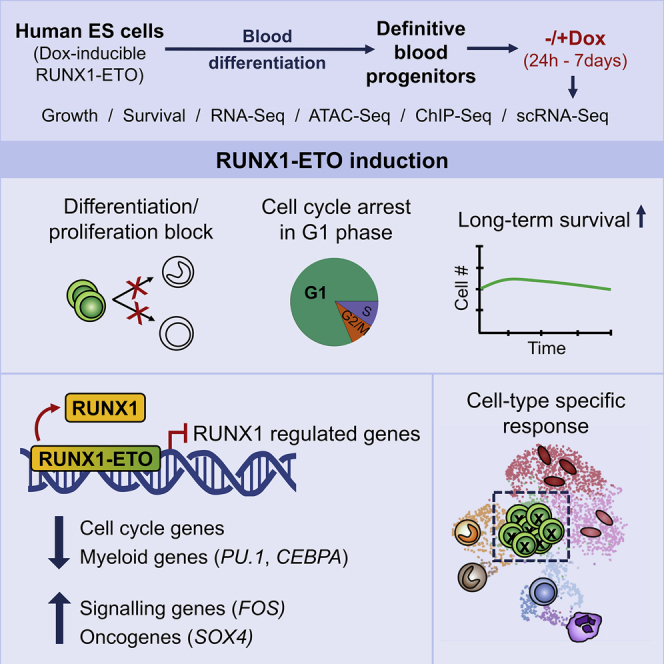
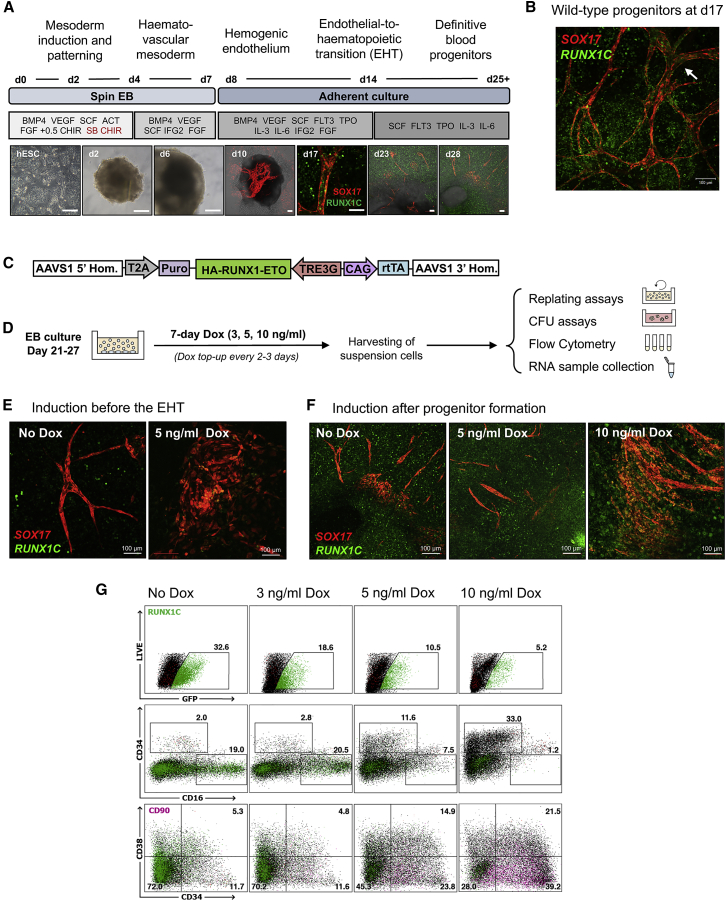
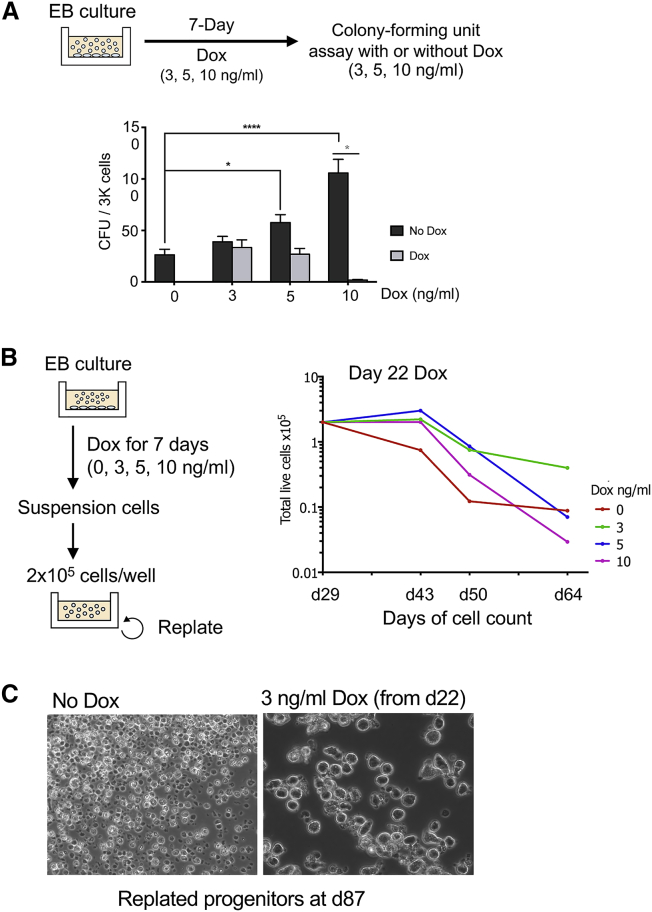
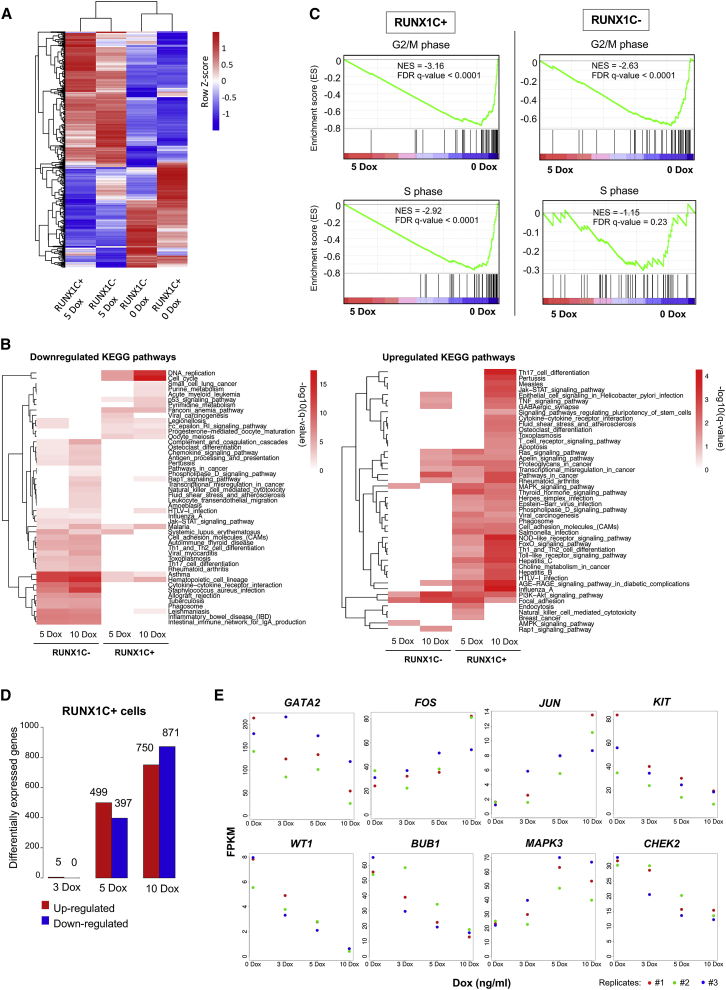
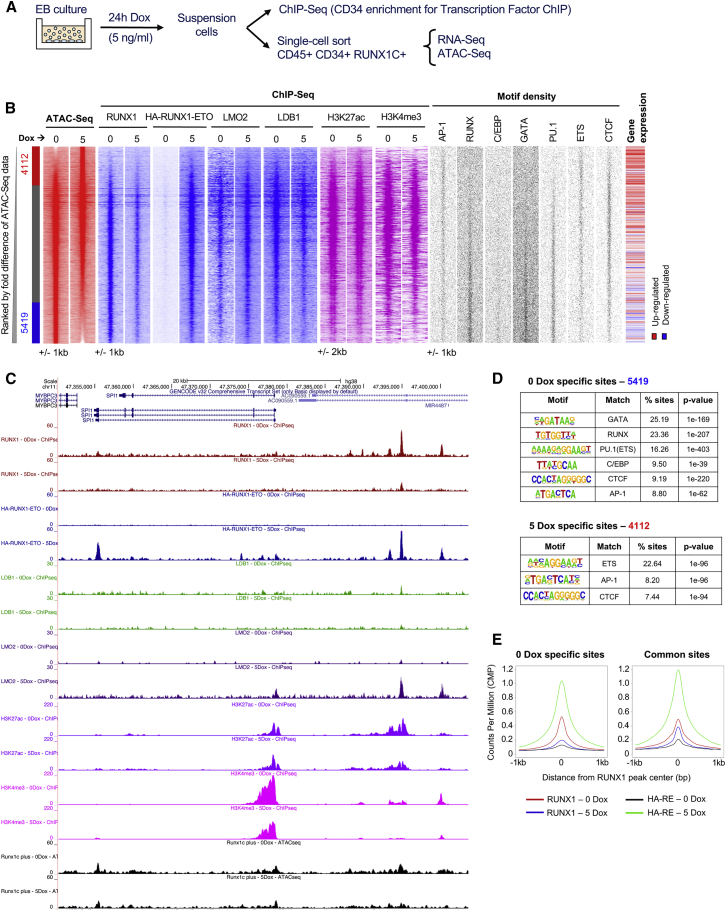
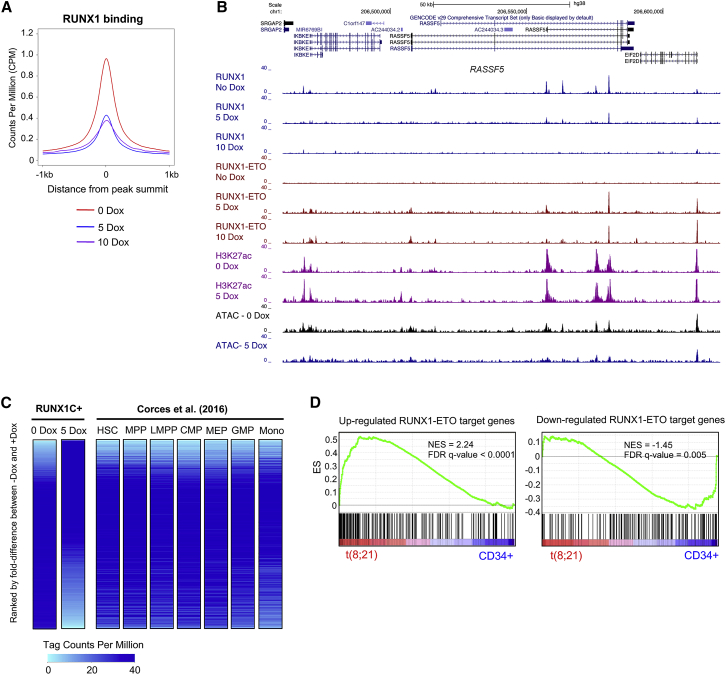
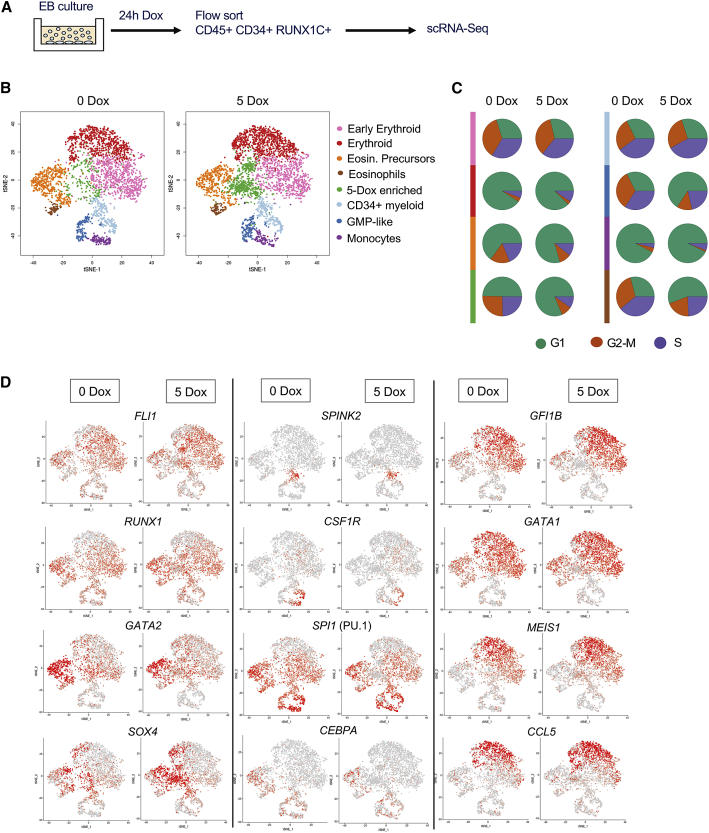
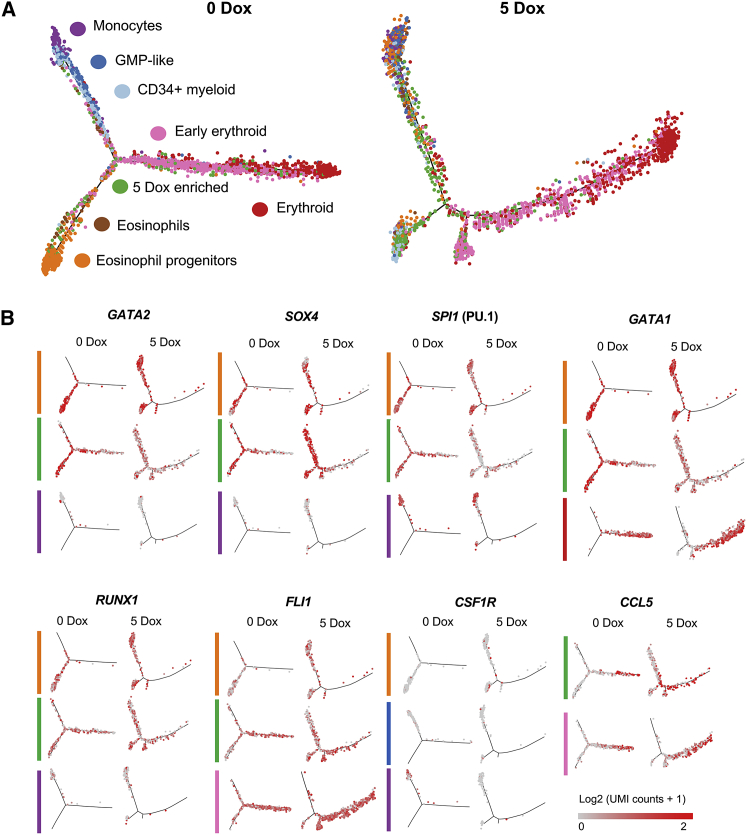
Acute myeloid leukemia (AML) is a hematopoietic malignancy caused by recurrent mutations in genes encoding transcriptional, chromatin, and/or signaling regulators. The t(8;21) translocation generates the aberrant transcription factor RUNX1-ETO (RUNX1-RUNX1T1), which by itself is insufficient to cause disease. t(8;21) AML patients show extensive chromatin reprogramming and have acquired additional mutations. Therefore, the genomic and developmental effects directly and solely attributable to RUNX1-ETO expression are unclear. To address this, we employ a human embryonic stem cell differentiation system capable of forming definitive myeloid progenitor cells to express RUNX1-ETO in an inducible fashion. Induction of RUNX1-ETO causes extensive chromatin reprogramming by interfering with RUNX1 binding, blocks differentiation, and arrests cellular growth, whereby growth arrest is reversible following RUNX1-ETO removal. Single-cell gene expression analyses show that RUNX1-ETO induction alters the differentiation of early myeloid progenitors, but not of other progenitor types, indicating that oncoprotein-mediated transcriptional reprogramming is highly target cell specific.

Keywords: Acute Myeloid Leukemia (AML); RUNX1-ETO; chromatin; human ES cell differentiation; myelopoiesis; single cell RNA-Seq.


Conflict of interest statement

Declaration of Interests The authors declare no competing interests.

Figures

None
Graphical abstract
Figure 1
Figure 1
Expression of RUNX1-ETO Leads to a Differentiation Arrest of Human Early Hematopoietic Progenitor Cells (A) Protocol for in vitro human definitive hematopoietic differentiation as spin embryoid bodies (EBs). Developmental stages, time course, and growth factors used are indicated. Epi-fluorescence images (human embryonic stem cells [hESCs], days 2 and 6) and confocal images (days 10–28) representative of each stage are shown. A pulse of SB431542 and CHIR (red) was included from days 2–4. hESCs are shown ~50% confluency on a feeder layer. EBs (days 2 and 6) appear as opaque round structures and are surrounded by adherent stroma, endothelium, and blood cells from day 10. Fluorescence and bright-field channels are merged in images corresponding to days 10, 13, and 28. Scale bar: 100 μm. SOX17 (mCHERRY, red) expression marks vascular structures, and RUNX1C (GFP, green) marks hematopoietic progenitors. (B) Confocal image of a differentiation culture at day 17 showing RUNX1C+ progenitors being generated from SOX17+ vascular structures of endothelial cells, resembling embryonic AGM hematopoiesis. SOX17 (CHERRY, red), RUNX1C (GFP, green). The arrow points to groups of progenitor cells resembling the embryonic intra-aortic hematopoietic cell clusters. Scale bar: 100 μm. (C) Schematic representation of the transgene targeting the AAVS1 locus. Knockin was performed via transcription activator-like effector nuclease (TALEN)-mediated homologous recombination into the AAVS1 locus of the SOX17mCHERRY/w RUNX1CGFP/w hESC line H9. The integrated sequence includes an HA-tagged RUNX1-ETO cDNA under control of a tetracycline-inducible expression system (TRE-3G), the reverse tetracycline activator (rtTA) controlled by a chicken β-actin promoter (CAG), and a puromycin resistance gene with an upstream T2A sequence to link its expression to the AAVS1 gene. (D) Experimental strategy for the evaluation of RUNX1-ETO induced by Dox (0, 3, 5, or 10 ng/mL). Cultures were treated with Dox at different time points once blood progenitors were had been formed (days 21–27). The non-adherent hematopoietic cell fraction was harvested 7 days after induction and used for flow cytometry analysis and CFU and replating assays. (E) Confocal images of hematopoietic cultures at day 17, showing the disruptive effects on vasculogenesis and blood formation of RUNX1-ETO induction before the EHT, which occurs around day 12 in our cultures. Images are representative of uninduced and induced cultures at day 10 (5 ng/mL Dox for 7 days). SOX17 (CHERRY) and RUNX1C (GFP). Scale bar: 100 μm. (F) Confocal images of hematopoietic cultures at day 28 showing the effect of RUNX1-ETO on formation of blood progenitors. RUNX1-ETO expression at an equivalent level to that of endogenous RUNX1 (5 ng/mL Dox) allows vasculogenesis and blood formation to occur, whereas higher RUNX1-ETO expression levels (10 ng/mL Dox) result in the formation of abnormal vascular structures and reduced blood formation. Images are representative of uninduced and induced cultures at day 21 with 5 or 10 ng/mL Dox for 7 days. SOX17 (CHERRY) and RUNX1C (GFP). Scale bar: 100 μm. (G) RUNX1-ETO-expressing cultures retain markers of immature myeloid progenitors. Flow cytometry analysis of the floating fraction of day 34 hematopoietic progenitors upon 7-day RUNX1-ETO induction (3, 5, or 10 ng/mL Dox at day 27). Results are representative of three biological replicates with comparable results with induction at different time points after the EHT. Accumulated precursor cells are highlighted pink.
Figure 2
Figure 2
RUNX1-ETO Induction Leads to Increased Survival and a Reversible Growth Arrest (A) RUNX1-ETO induction causes a reversible block in colony-forming ability. Top: diagram depicting the experimental strategy. EB cultures were treated with 3, 5, or 10 ng/mL Dox for 7 days, and suspension cells were subsequently plated in methylcellulose for CFU assays in the presence or the absence of Dox. Below: CFU assay of day 31 progenitors from treated EB cultures (at day 24 for 7 days), plated in methylcellulose in the presence (light gray) or absence (dark gray) of Dox. Data are from three independent biologic replicates using two clones. CFU assays were conducted in triplicate, with 3,000 cells plated per well. Error bars represent the standard error of the mean (SEM). Gray asterisk: multiple t test, statistical significance determined using the Holm-Sidak method, with alpha = 0.05. Each row was analyzed individually, without assuming a consistent SD. Black asterisk: two-way ANOVA, statistical significance determined using Dunnett’s multiple comparison test. (B) Induction of RUNX1-ETO at low levels (3 and 5 ng/mL Dox) enhances the survival of a subset of progenitor cells compared with uninduced cells, without increasing proliferative capacity. Left: schematic of the replating assays. EB cultures were treated at different stages of hematopoietic differentiation with 0, 3, 5, or 10 ng/mL Dox for 7 days. Floating progenitors were harvested and plated on Matrigel-coated wells at 2 × 105 cells/well in the corresponding Dox concentration and were serially passaged each week. Right: cell count of live cells × 105 during replating assays of hematopoietic progenitors from day 29 cultures previously treated with Dox for 7 days (from day 22), showing one representative of three biological replicates. Cell growth was measured at the indicated times. (C) RUNX1-ETO expressed at low levels allows survival of cells until day 87. Bright-field images of hematopoietic progenitors from replating assays at day 87 of differentiation that are uninduced (left) or treated with 3 ng/mL Dox from day 22 onward (right). Images are taken using the same magnification.
Figure 3
Figure 3
RUNX1-ETO Induction Leads to Cell-Type and Dose-Dependent Changes in Gene Expression (A) Clustering of gene expression data for sorted populations of RUNX1C− and RUNX1C+ (CD45+CD34+) cells, both wild-type and after 24 h of RUNX1-ETO induction using 5 ng/mL Dox. The figure includes all genes that showed up-/downregulation after RUNX1-ETO induction in either the RUNX1C+ or the RUNX1C− cell populations. (B) Heatmap after KEGG pathway analysis depicting clustering of differentially expressed genes associated with KEGG terms upon RUNX1-ETO induction (5 and 10 ng/mL Dox) in sorted populations of both RUNX1C− and RUNX1C+ cells. Red intensity reflects the enrichment significance of the terms in −log10 (q value). (C) Gene set enrichment analysis (GSEA) correlating expression of genes differentially regulated during the cell cycle (G2/M in top panels and S phase in bottom panels) between induced (5 ng/mL Dox for 24 h) and uninduced conditions in both RUNX1C+ and RUNX1C− cell populations. ES, enrichment score; NES, normalized enrichment score; FDR, false discovery rate. (D) Bar graph depicting differentially expressed genes between uninduced and Dox-treated (3, 5, and 10 ng/mL Dox) sorted populations of CD45+CD34+RUNX1C+ cells. (E) Examples of individual genes differentially regulated in CD34+RUNX1C+ progenitors in response to RUNX1-ETO induction (3, 5, and 10 ng/mL Dox) for 24 h. n = 3. Each colored dot represents a distinct biological replicate.
Figure 4
Figure 4
RUNX1-ETO Induction Causes Extensive Global Chromatin Reorganization and Blocks the Binding of RUNX1 (A) Sorting strategy and downstream analyses after 24-h induction of RUNX1-ETO with 5 ng/mL Dox. (B) Heatmaps depicting accessible chromatin regions ranked by the fold difference between 0 and 5 ng/mL Dox RUNX1C+-treated samples. ATAC-seq peaks were considered sample specific when displaying a greater than 2-fold enrichment compared with the other sample. Sample-specific sites and number of peaks are indicated alongside: red, 5-Dox specific; blue, 0-Dox specific; gray, shared peaks. ChIP-seq enrichment for RUNX1, HA-RUNX1-ETO, LMO2, LDB1, H3K27ac, and H3K4me3 in each sample; motif density plots; and gene expression at these sites are ranked along the same coordinates as the ATAC-seq peaks. (C) Genome browser screenshot at the SPI1 gene locus depicting RUNX1, HA-RUNX1-ETO, LMO2, LDB1, H3K27ac, and H3K4me3 ChIP-seq and ATAC-seq tracks in uninduced and induced (5 ng/mL Dox for 24 h) samples. (D) Motif enrichment analysis in the 0- and 5-Dox-specific peaks. (E) Average profiles for RUNX1 and RUNX1-ETO ChIP-seq data centered on RUNX1 binding peaks (±1,000 bp from peak center) in the 0- and 5-Dox-specific peaks.
Figure 5
Figure 5
Analysis of the Interplay between RUNX1 and RUNX1-ETO (A) Average profiles for RUNX1 ChIP-seq tag counts centered on all RUNX1 binding peaks (±1,000 bp from peak center) in the 0, 5, and 10 ng/mL Dox-treated samples. (B) Genome browser screenshot at the RASSF5 gene locus depicting RUNX1, HA-RUNX1-ETO, and H3K27ac ChIP-seq and ATAC-seq tracks for the indicated samples. (C) Comparison of chromatin accessibility in RUNX1C+ cells (0- and 5-Dox-treated samples) to myeloid progenitor cell types from Corces et al. (2016). Heatmaps show ATAC-seq tag counts ranked by fold difference between 0- and 5-Dox-treated RUNX1C+ samples. ATAC-seq tag counts from distinct myeloid progenitor cell types (Corces et al., 2016) are ranked along the same coordinates as the 0-Dox ATAC-seq peaks. Color intensity reflects tag counts per million, with light blue representing closed chromatin. (D) RUNX1-ETO-induced hESC-derived progenitors share a t(8;21) AML-specific gene expression profile with t(8;21) AML patients. GSEA correlating upregulated (left panel) and downregulated (right panel) RUNX1-ETO target genes between CD45+CD34+RUNX1C+ cells following 24-h RUNX1-ETO induction (5 ng/mL Dox) and the gene expression profile of the RUNX1-ETO targets in t(8;21) patients.
Figure 6
Figure 6
Induction of RUNX1-ETO in the CD45+CD34+RUNX1C+ Population Results in the Emergence of a New Cell Population (A) Diagram of the sorting strategy for scRNA-seq performed following 24-h induction of RUNX1-ETO (5 ng/mL Dox at day 21). (B) Two-dimensional t-distributed stochastic neighbor embedding (t-SNE) maps displaying 3,321 (left) and 3,814 (right) sorted populations of CD45+CD34+RUNX1C+ single cells following 0 and 5 ng/mL Dox treatment, respectively. Colors represent the different clusters identified after RaceID analysis. (C) Pie charts displaying the proportion of cells in each cell-cycle phase (G1, G2-M, and S) within each cell cluster as identified by expression of cell-cycle-regulated genes, such as histone genes. (D) Expression of individual marker genes projected on the t-SNE maps of both untreated (0 Dox) and treated (5 Dox; 5 ng/mL for 24 h) scRNA populations. Color intensity represents number of transcripts sequenced in log2 of unique molecular identifier (UMI) counts +1.
Figure 7
Figure 7
RUNX1-ETO Induction Distorts the Myeloid, but Not the Erythroid, Differentiation Trajectory and Dysregulates Genes Involved in Stem/Progenitor Development (A) Trajectory analysis using the Monocle algorithm of the sorted cell populations plotted according to each cell cluster. (B) Expression of individual marker genes projected on the trajectories, plotted according to each cell cluster in (A). Color intensity represents number of transcripts sequenced in log2 of UMI counts +1.

References

    1. Assi S.A., Imperato M.R., Coleman D.J.L., Pickin A., Potluri S., Ptasinska A., Chin P.S., Blair H., Cauchy P., James S.R. Subtype-specific regulatory network rewiring in acute myeloid leukemia. Nat. Genet. 2019;51:151–162. - PMC - PubMed
    1. Ben-Ami O., Friedman D., Leshkowitz D., Goldenberg D., Orlovsky K., Pencovich N., Lotem J., Tanay A., Groner Y. Addiction of t(8;21) and inv(16) acute myeloid leukemia to native RUNX1. Cell Rep. 2013;4:1131–1143. - PubMed
    1. Bertrand J.Y., Chi N.C., Santoso B., Teng S., Stainier D.Y.R., Traver D. Haematopoietic stem cells derive directly from aortic endothelium during development. Nature. 2010;464:108–111. - PMC - PubMed
    1. Bindea G., Mlecnik B., Hackl H., Charoentong P., Tosolini M., Kirilovsky A., Fridman W.-H., Pagès F., Trajanoski Z., Galon J. ClueGO: a Cytoscape plug-in to decipher functionally grouped gene ontology and pathway annotation networks. Bioinformatics. 2009;25:1091–1093. - PMC - PubMed
    1. Boisset J.-C., van Cappellen W., Andrieu-Soler C., Galjart N., Dzierzak E., Robin C. In vivo imaging of haematopoietic cells emerging from the mouse aortic endothelium. Nature. 2010;464:116–120. - PubMed

Publication types

MeSH terms