

Clinical implications of serum neurofilament in newly diagnosed MS patients: A longitudinal multicentre cohort study
- PMID: 32460167
- PMCID: PMC7251380
- DOI: 10.1016/j.ebiom.2020.102807
Clinical implications of serum neurofilament in newly diagnosed MS patients: A longitudinal multicentre cohort study
Abstract
Background: We aim to evaluate serum neurofilament light chain (sNfL), indicating neuroaxonal damage, as a biomarker at diagnosis in a large cohort of early multiple sclerosis (MS) patients.
Methods: In a multicentre prospective longitudinal observational cohort, patients with newly diagnosed relapsing-remitting MS (RRMS) or clinically isolated syndrome (CIS) were recruited between August 2010 and November 2015 in 22 centers. Clinical parameters, MRI, and sNfL levels (measured by single molecule array) were assessed at baseline and up to four-year follow-up.
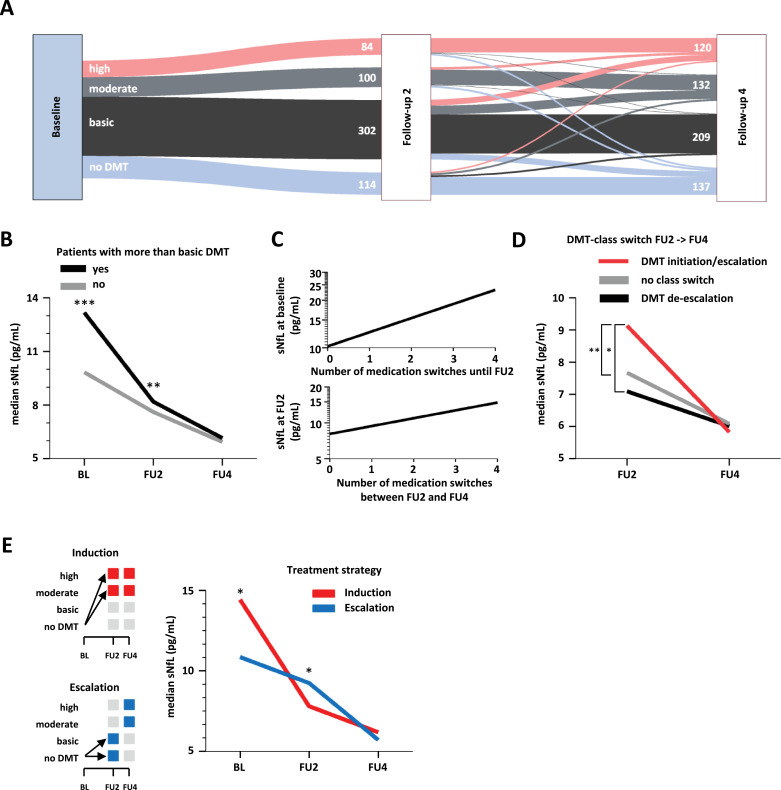
Findings: Of 814 patients, 54.7% (445) were diagnosed with RRMS and 45.3% (369) with CIS when applying 2010 McDonald criteria (RRMS[2010] and CIS[2010]). After reclassification of CIS[2010] patients with existing CSF analysis, according to 2017 criteria, sNfL levels were lower in CIS[2017] than RRMS[2017] patients (9.1 pg/ml, IQR 6.2-13.7 pg/ml, n = 45; 10.8 pg/ml, IQR 7.4-20.1 pg/ml, n = 213; p = 0.036). sNfL levels correlated with number of T2 and Gd+ lesions at baseline and future clinical relapses. Patients receiving disease-modifying therapy (DMT) during the first four years had higher baseline sNfL levels than DMT-naïve patients (11.8 pg/ml, IQR 7.5-20.7 pg/ml, n = 726; 9.7 pg/ml, IQR 6.4-15.3 pg/ml, n = 88). Therapy escalation decisions within this period were reflected by longitudinal changes in sNfL levels.
Interpretation: Assessment of sNfL increases diagnostic accuracy, is associated with disease course prognosis and may, particularly when measured longitudinally, facilitate therapeutic decisions.
Funding: Supported the German Federal Ministry for Education and Research, the German Research Council, and Hertie-Stiftung.
Keywords: Biomarker; Multiple sclerosis; Neurofilament light chain; Prediction; sNfL.
Copyright © 2020 The Authors. Published by Elsevier B.V. All rights reserved.
Conflict of interest statement
Declaration of Competing Interest Falk Steffen, Vinzenz Fleischer, Muthuraman Muthuraman, Sergiu Groppa, and Mark Mühlau declare no competing interests. Stefan Bittner has received honoria and compensation for travel from Biogen Idec, Merck Serono, Novartis, Sanofi-Genzyme and Roche. Timo Uphaus received honoria from Merck Serono. Carsten Lukas received consulting and speaker's honoraria from BiogenIdec, Bayer Schering, Novartis, Sanofi, Genzyme, and TEVA; has received research scientific grant support from Bayer Schering, TEVA, and Merck Serono; holds an endowed professorship supported by the Novartis Foundation. Anke Salmen received speaker honoraria and/or travel compensation for activities with Almirall Hermal GmbH, Biogen, Merck, Novartis, Roche, and Sanofi Genzyme and research support by the Swiss MS Society, none related to this work. Felix Luessi received consultancy fees from Roche and support with travel cost from Teva Pharma. Achim Berthele reports personal fees from Bayer Healthcare, Biogen, Merck Serono, Mylan, Roche, and Sanofi Genzyme, and his institution received compensations for clinical trials from Alexion Pharmaceuticals, Biogen, Chugai, Novartis, Roche, Sanofi Genzyme, and Teva - all outside the submitted work. Luisa Klotz received honoraria for lecturing and serving on advisory boards, as well as travel expenses for attending meetings and financial research support from Immunic AG, Biogen, Janssen, Merck Serono, Novartis, Roche, Sanofi Genzyme, Teva, Grifols, Alexion, Santhera, Bayer Healthcare, the Deutsche Forschungsgemeinschaft (DFG; German Research Society), the German Ministry for Education and Research (BMBF), the Interdisciplinary Center for Clinical Studies (IZKF) Muenster and the program Innovative Medical Research (IMF) Muenster. Sven G. Meuth receives honoraria for lecturing, and travel expenses for attending meetings from Almirall, Amicus Therapeutics Germany, Bayer Health Care, Biogen, Celgene, Diamed, Genzyme, MedDay Pharmaceuticals, Merck Serono, Novartis, Novo Nordisk, ONO Pharma, Roche, Sanofi-Aventis, Chugai Pharma, QuintilesIMS and Teva. His research is funded by the German Ministry for Education and Research (BMBF), Deutsche Forschungsgemeinschaft (DFG), Else Kröner Fresenius Foundation, German Academic Exchange Service, Hertie Foundation, Interdisciplinary Center for Clinical Studies (IZKF) Muenster, German Foundation Neurology and Almirall, Amicus Therapeutics Germany, Biogen, Diamed, Fresenius Medical Care, Genzyme, Merck Serono, Novartis, ONO Pharma, Roche, and Teva. Antonios Bayas received personal compensation from Merck, Biogen, Bayer Vital, Novartis, TEVA, Roche and Sanofi-Aventis/Genzyme and grants for congress trips and participation from Biogen, TEVA, Novartis, Sanofi-Aventis/Genzyme, and Merck. Friedemann Paul receives honoraria for lecturing, and travel expenses for attending meetings from Guthy Jackson Foundation, Sanofi Genzyme, Novartis, Alexion, Viela Bio, Roche, UCB, Mitsubishi Tanabe and Celgene. His research is funded by the German Ministry for Education and Research (BMBF), Deutsche Forschungsgemeinschaft (DFG), Einstein Foundation, Guthy Jackson Charitable Foundation, EU FP7 Framework Program, Arthur Arnstein Foundation Berlin, Biogen, Genzyme, Merck Serono, Novartis, Bayer, Teva, Alexion, Roche, Parexel and Almirall. Hans-Peter Hartung has received fees for consulting, serving on steering committees and data monitoring committees from Bayer Healthcare, Biogen, GeNeuro, Medimmune, Merck, Novartis, Roche, Sanofi Genzyme, Teva and TG Therapeutics with approval by the Rector of Heinrich-Heine-University. Ralf Linker received Research Support and/or personal compensation for activities with Bayer Health Care, Biogen, Genzyme/Sanofi, Merck, Novartis Pharma, Roche, and TEVA Pharma; none related to this work. Christoph Heesen received research grants and speaker honoraria from Biogen, Genzyme, Roche, and Merck; none related to this work. Martin Stangel received honoraria for scientific lectures or consultancy from Alexion, Bayer Healthcare, Biogen, CSL Behring, Grifols, Janssen, Merck-Serono, Novartis, Roche, Sanofi-Aventis, Takeda, and Teva. His institution received research support from Bayer Healthcare, Biogen Idec, Genzyme, Merck-Serono, Novartis, and Teva; none related to this work. Brigitte Wildemann received grants from the German Ministry of Education and Research, Deutsche Forschungsgemeinschaft, Dietmar Hopp Foundation and Klaus Tschira Foundation, grants and personal fees from Merck Serono, Sanofi Genzyme, Novartis pharmaceuticals, and personal fees from Bayer Healthcare, Biogenm, Teva Pharma; none related to this work. Florian Then Bergh received travel support to attend scientific meetings, personal speaker honoraria, and consultancy fees as a speaker and advisor from Bayer Healthcare, Biogen, Merck Serono, Novartis, Roche, Sanofi Genzyme, and TEVA. He received, through his institution, unrestricted research grants from Novartis, TEVA, Bayer Healthcare, and Actelion; none related to this work. He received funding from the DFG and, through TRM Leipzig, from the BMBF. Björn Tackenberg received personal speaker honoraria and consultancy fees as a speaker and advisor from Bayer Healthcare, Biogen, CSL Behring, GRIFOLS, Merck Serono, Novartis, Octapharma, Roche, Sanofi Genzyme, TEVA und UCB Pharma. His University received unrestricted research grants from Biogen-idec, Novartis, TEVA, Bayer Healthcare, CSL-Behring, GRIFOLS, Octapharma, Sanofi Genzyme und UCB Pharma; none related to this work. He is currently an employee of Roche. The data collection, evaluation and drafting of the manuscript was performed before beginning employment at Roche. Tania Kuempfel has received travel expenses and personal compensations from Bayer Healthcare, Teva Pharma, Merck-Serono, Novartis, Sanofi-Aventis/Genzyme, Roche and Biogen as well as grant support from Bayer-Schering AG, Novartis and Chugai Pharma. Frank Weber received honoraria from Genzyme, Novartis TEVA and Biogen for speaking or for serving on a scientific advisory board, a travel grant for the attention of a scientific meeting from Merck-Serono and Novartis and grant support from Merck-Serono, Novartis and from the Federal Ministry of Education and Research (BMBF, Projects Biobanking and Omics in ControlMS as part of the Competence Network Multiple Sclerosis). Uwe K. Zettl received speaker fees, travel compensation and/or his section received research support from Alexion, Almirall, Bayer Health Care, Biogen, Celgene, Genzyme, Merck Serono, Novartis, Roche, Sanofi-Aventis, Teva and grants from German Ministry for Education and Research (BMBF), German Ministry for Economy (BMWi), Deutsche Forschungsgemeinschaft (DFG), European Union (EU), outside the submitted work. Ulf Ziemann received speaker honoraria and/or travel compensation from Biogen Idec GmbH, Bayer Vital GmbH, Bristol Myers Squibb GmbH, CorTec GmbH, Medtronic GmbH, and grants from Biogen Idec GmbH, Servier, and Janssen Pharmaceuticals NV; none related to this work. Hayrettin Tumani received speaker honoraria from Bayer, Biogen, Fresenius, Genzyme, Merck, Novartis, Roche, Siemens, Teva; serves as section editor for the Journal of Neurology, Psychiatry, and Brain Research; and his institution receives research support from Fresenius, Genzyme, Merck, and Novartis; none related to this work. Bernhard Hemmer served on scientific advisory boards for Novartis; he has served as DMSC member for AllergyCare, Polpharma, and TG therapeutics; he or his institution have received speaker honoraria from Desitin; his institution has received research support from Regeneron; holds part of two patents; one for the detection of antibodies and T cells against KIR4.1 in a subpopulation of MS patients and one for genetic determinants of neutralising antibodies to interferon β during the last 3 years. Heinz Wiendl receives honoraria for acting as a member of Scientific Advisory Boards and as a consultant for Biogen, Evgen, MedDay Pharmaceuticals, Merck Serono, Novartis, Roche Pharma AG, Sanofi-Genzyme, as well as speaker honoraria and travel support from Alexion, Biogen, Cognomed, F. Hoffmann-La Roche Ltd., Gemeinnützige Hertie-Stiftung, Merck Serono, Novartis, Roche Pharma AG, Sanofi-Genzyme, TEVA, and WebMD Global. Prof. Wiendl is acting as a paid consultant for Abbvie, Actelion, Biogen, IGES, Novartis, Roche, Sanofi-Genzyme, and the Swiss Multiple Sclerosis Society. His research is funded by the BMBF, DFG, Else Kröner Fresenius Foundation, Fresenius Foundation, Hertie Foundation, NRW Ministry of Education and Research, Interdisciplinary Center for Clinical Studies (IZKF) Muenster and RE Children's Foundation, Biogen GmbH, GlaxoSmithKline GmbH, and Roche Pharma AG, Sanofi-Genzyme. Ralf Gold serves on scientific advisory boards for Teva Pharmaceutical Industries Ltd., Biogen Idec, Bayer Schering Pharma, and Novartis; has received speaker honoraria from Biogen Idec, Teva Pharmaceutical Industries Ltd., Bayer Schering Pharma, and Novartis; serves as editor for Therapeutic Advances in Neurological Diseases and on the editorial boards of Experimental Neurology and the Journal of Neuroimmunology; and receives research support from Teva Pharmaceutical Industries Ltd., Biogen Idec, Bayer Schering Pharma, Genzyme, Merck Serono, and Novartis; none related to this work. Frauke Zipp has recently received research grants and/or consultation funds from the DFG, BMBF, PMSA, Novartis, Octapharma, Merck Serono, ONO Pharma, Biogen, Genzyme, Celgene and Roche.
Figures


Comment in
-
Neurofilament light in blood - What more is needed for clinical implementation in multiple sclerosis?EBioMedicine. 2020 Jul;57:102826. doi: 10.1016/j.ebiom.2020.102826. Epub 2020 Jun 20. EBioMedicine. 2020. PMID: 32574951 Free PMC article. No abstract available.
References
-
- Larochelle C, Uphaus T, Prat A, Zipp F. Secondary progression in multiple sclerosis: neuronal exhaustion or distinct pathology? Trends Neurosci. 2016;39(5):325–339. - PubMed
-
- Steenwijk MD, Geurts JJ, Daams M. Cortical atrophy patterns in multiple sclerosis are non-random and clinically relevant. Brain: J Neurol. 2016;139(Pt 1):115–126. - PubMed
-
- Khalil M, Teunissen CE, Otto M. Neurofilaments as biomarkers in neurological disorders. Nat Rev Neurol. 2018;14(10):577–589. - PubMed
Publication types
MeSH terms
Substances
LinkOut - more resources
Full Text Sources
Other Literature Sources
Medical
