. 2021 Jan;15(1):299-316.
doi: 10.1002/1878-0261.12728. Epub 2020 Nov 14.

FOXD1-AS1 regulates FOXD1 translation and promotes gastric cancer progression and chemoresistance by activating the PI3K/AKT/mTOR pathway

Affiliations

FOXD1-AS1 regulates FOXD1 translation and promotes gastric cancer progression and chemoresistance by activating the PI3K/AKT/mTOR pathway

Qiong Wu et al. Mol Oncol. 2021 Jan.

Abstract

Gastric cancer (GC) is a common gastrointestinal cancer with a high global mortality. Recent reports have suggested that long noncoding RNA (lncRNA) are implicated in multiple aspects of GC, including pathogenesis, progression, and therapeutic response. Herein, we investigated the function of FOXD1-AS1 in GC progression and chemoresistance. Expression of FOXD1-AS1 was low in normal stomach tissues but was upregulated in GC cell lines. Silencing of FOXD1-AS1 impaired GC cell proliferation and motility in vitro, and repressed tumor growth and metastasis in vivo. Importantly, FOXD1-AS1 upregulation increased the resistance of GC cells to cisplatin. Moreover, we found that FOXD1-AS1 promoted FOXD1 protein translation through the eIF4G-eIF4E-eIF4A translational complex. We also demonstrated that FOXD1-AS1 released eIF4E from phosphorylated 4E-BP1 and thereby strengthened the interaction of eIF4E with eIF4G by activating the PI3K/AKT/mTOR pathway. Activation of the PI3K/AKT/mTOR pathway was due to the post-transcriptional upregulation of PIK3CA, in turn induced by FOXD1-AS1-mediated sequestering of microRNA (miR)-466. Furthermore, we verified that FOXD1-AS1 facilitated GC progression and cisplatin resistance in a FOXD1-dependent manner. In conclusion, FOXD1-AS1 aggravates GC progression and chemoresistance by promoting FOXD1 translation via PIK3CA/PI3K/AKT/mTOR signaling. These findings highlight a novel target for treatment of patients GC, particularly patients with cisplatin resistance.

Keywords: FOXD1; FOXD1-AS1; PI3K/AKT/mTOR pathway; eIF4G-eIF4E-eIF4A translational complex; gastric cancer.


Conflict of interest statement

The authors declare no conflict of interest.

Figures

Fig. 1
Fig. 1
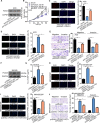
FOXD1‐AS1 was upregulated in GC cell lines and its inhibition restrained GC cell proliferation and motility. (A) UCSC indicated that FOXD1‐AS1 was underexpressed in normal human stomach tissues. (B) Relative expression level of FOXD1‐AS1 in GC cell lines; GES1 cell line was determined by qRT–PCR (n = 6, one‐way ANOVA). (C) qRT–PCR result of FOXD1‐AS1 in MKN45 and AGS cells under the transfection of shCtrl or two shRNA against FOXD1‐AS1. (n = 6, one‐way ANOVA). (D) The viability in MKN45 and AGS cells was evaluated by CCK‐8 assay. (n = 6, two‐way ANOVA). (E,F) Cell proliferation and apoptosis in MKN45 and AGS cells with or without FOXD1‐AS1 inhibition were examined via EdU and TUNEL assays, respectively (n = 6, Student’s t‐test, scale bar: 200 μm). (G,H) Transwell assay was conducted to analyze the migration and invasion in these two GC cells under FOXD1‐AS1 suppression. (n = 6, Student’s t‐test, scale bar: 100 μm). Data are shown as mean ± SD (standard deviation). Error bars indicate SD. *P < 0.05, **P < 0.01.
Fig. 2
Fig. 2
FOXD1‐AS1 upregulation contributed to the resistance of GC cells to DDP. (A) Morphological images of MKN28 and BGC‐823 cells and MKN28R and BGC‐823R cells that underwent continuous DDP treatment (n = 3, scale bar: 200 μm). (B) IC50 value of MKN28 and BGC‐823 cells responding to DDP treatment was determined by CCK‐8 assay. (C) qRT–PCR result of FOXD1‐AS1 level in MKN28R and BGC‐823R cells and the parental cells. (D) qRT–PCR analysis of FOXD1‐AS1 expression in MKN28 and BGC‐823 cells transfected with pcDNA3.1 or pcDNA3.1/FOXD1‐AS1. (E) CCK‐8 assay indicated an increased IC50 value in FOXD1‐AS1‐overexpressed MKN28 and BGC‐823 cells. (F,G) Cell proliferative ability and apoptotic rate in DDP‐treated MKN28 and BGC‐823 cells with or without FOXD1‐AS1 upregulation were evaluated using EdU and TUNEL assays (n = 6, scale bar: 200 μm). (H,I) The migratory and invasive abilities of indicated cells were assessed by Transwell assays (n = 6, scale bar: 200 μm). Data are shown as mean ± SD (standard deviation). Error bars indicate SD. *P < 0.05, **P < 0.01.
Fig. 3
Fig. 3
FOXD1‐AS1 facilitated FOXD1 mRNA translation in GC by affecting the assembly of eIF4E/eIF4G translational complex. (A,B) The impact of FOXD1‐AS1 on the mRNA and protein levels of FOXD1 was tested by qRT–PCR and western blot, respectively (n = 3, Student’s t‐test). (C) The level of FOXD1 protein in indicated cells was detected via western blotting. (n = 3). (D) Western blot analysis of the protein levels of eIF4E, eIF4G and 4E‐BP1 in MKN45 and AGS cells with or without FOXD1‐AS1 depletion (n = 3). (E) The interaction between eIF4G and FOXD1 mRNA in MKN45 and AGS cells was determined by RIP assay (n = 3, Student’s t‐test and one‐way ANOVA). (F) The interaction of eIF4E with eIF4G or 4E‐BP1 in shCtrl‐ or shFOXD1‐AS1#1‐transfected GC cells was analyzed by Co‐IP assay. (G) The level of 4E‐BP1 and p‐4E‐BP1 in indicated cells was evaluated by western blot (n = 3). Data are shown as mean ± SD (standard deviation). Error bars indicate SD. *P < 0.05, **P < 0.01.
Fig. 4
Fig. 4
FOXD1‐AS1 enhanced 4E‐BP1 phosphorylation by activation of the PI3K/AKT/mTOR pathway. (A) The influence of FOXD1‐AS1 knockdown on the level of proteins associated with PI3K/AKT/mTOR signaling was determined via western blot (n = 3). (B,C) FOXD1 mRNA and protein levels in MKN45 and AGS cells with FOXD1‐AS1 silencing or together with 740Y‐P treatment was assessed by qRT–PCR and western blot (n = 3, one‐way ANOVA). (D) RIP assay was carried out to estimate the interaction between eIF4G and FOXD1 mRNA in MKN45 and AGS cells (n = 5, one‐way ANOVA). (E) The phosphorylation of 4E‐BP1 in indicated cells was analyzed by western blot (n = 5). (F) Co‐IP assay was applied to assess the interaction between eIF4E and eIF4G or 4E‐BP1 in indicated GC cells (n = 5). Data are shown as mean ± SD (standard deviation). Error bars indicate SD. *P < 0.05, **P < 0.01.
Fig. 5
Fig. 5
FOXD1‐AS1 was mainly located in the cytoplasm and functioned as a ceRNA of PIK3CA by interacting with miR‐466. (A) Subcellular fractionation followed by qRT–PCR was conducted to determine the subcellular distribution of FOXD1‐AS1 in GC cells (n = 4). (B) Sequences used to construct luciferase reporter plasmids. (C) qRT–PCR result of PIK3CA expression in FOXD1‐AS1‐silenced MKN45 and AGS cells (n = 5, Student’s t‐test). (D) qRT–PCR result of miR‐466 level in GC cell lines and GES1 cell line (n = 5, one‐way ANOVA). (E) qRT–PCR result of miR‐466 expression in MKN45 and AGS cells with or without FOXD1‐AS1 silencing (n = 5, Student’s t‐test). (F,G) The interaction of miR‐466 with PIK3CA and FOXD1‐AS1 was evaluated by RNA pull‐down (F) and RIP assays (G) (n = 5, Student’s t‐test). (H,I) Luciferase reporter assays proved that there was a competition between FOXD1‐AS1 and PIK3CA mRNA in binding with miR‐466 (n = 5, Student’s t‐test and one‐way ANOVA). (J) RNA pull‐down assay revealed the competition between FOXD1‐AS1 and PIK3CA in binding to miR‐466 (n = 5, Student’s t‐test). (K) The mRNA and protein expressions of PIK3CA in GC cells transfected with indicated plasmids were assessed by qRT–PCR and western blot (n = 5, one‐way ANOVA). Data are shown as mean ± SD (standard deviation). Error bars indicate SD. *P < 0.05, **P < 0.01.
Fig. 6
Fig. 6
FOXD1 was responsible for FOXD1‐AS1‐affected GC progression and chemoresistance. (A) Western blot result of FOXD1 protein level in AGS cells transfected with shCtrl, shFOXD1‐AS1#1 or shFOXD1‐AS1#1 plus pcDNA3.1/FOXD1 (n = 3). (B–E) Cell viability, proliferation, apoptosis, and motility in AGS cells were detected by (B) CCK‐8 (n = 5, two‐way ANOVA); (C) EdU (n = 5, one‐way ANOVA) (scale bars: 200 μm); (D) TUNEL (n = 5, one‐way ANOVA; scale bar: 200 μm); and (E) Transwell assays (n = 5, one‐way ANOVA; scale bar: 200 μm). (F) Western blot was used to identify the level of FOXD1 protein in MKN28 cells transfected with pcDNA3.1, pcDNA3.1/FOXD1‐AS1 or pcDNA3.1/FOXD1‐AS1 plus shFOXD1 (n = 5). (G) The DDP resistance of MKN28 cells was estimated via CCK‐8 assay (n = 5, one‐way ANOVA). (H–J) The proliferation, apoptosis, and motility in DDP‐treated MKN28 cells under indicated transfections were evaluated through conducting (H) EdU (n = 5, one‐way ANOVA, scale bar: 200 μm), (I) TUNEL (n = 5, one‐way ANOVA, scale bar: 200 μm), and (J) Transwell assays (n = 5, one‐way ANOVA, scale bar: 200 μm). Data are shown as mean ± SD (standard deviation). Error bars indicate SD. *P < 0.05, **P < 0.01.
Fig. 7
Fig. 7
Depletion of FOXD1‐AS1 repressed the growth, metastasis, and DDP resistance of GC cells in vivo. (A,B) Representative images, volume and weight of tumors derived from mice with shCtrl‐ or shFOXD1‐AS1#1‐transfected AGS cells and together with PBS or DDP treatment (n = 3, one‐way/two‐way ANOVA). (C) qRT–PCR result of FOXD1‐AS1 and PIK3CA expressions in the tumors (n = 5, one‐way ANOVA). (D) ISH staining of FOXS1‐AS1 and miR‐466 as well as IHC staining of PIK3CA, p‐4E‐BP1, FOXD1, and Ki67 in tumors (n = 3, scale bars: 200 μm). (E) Representative images of livers with metastatic nodules from mice in indicated groups (n = 3). (F) HE staining of above livers and the quantitative diagram of metastatic nodules (n = 3, one‐way ANOVA). Data are shown as mean ± SD (standard deviation). Error bars indicate SD. *P < 0.05, **P < 0.01.
Fig. 8
Fig. 8
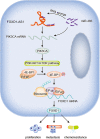
Graphical abstract illustrates the function and regulatory mechanism of FOXD1‐AS1 in AGS.

Similar articles

Cited by

References

    1. (2015) Cancer cells require eIF4E to translate pro‐oncogenic mRNAs. Cancer Discov 5, 792.
    1. Cheetham SW, Gruhl F, Mattick JS and Dinger ME (2013) Long noncoding RNAs and the genetics of cancer. Br J Cancer 108, 2419–2425. - PMC - PubMed
    1. Chen DL, Lu YX, Zhang JX, Wei XL, Wang F, Zeng ZL, Pan ZZ, Yuan YF, Wang FH, Pelicano H et al (2017) Long non‐coding RNA UICLM promotes colorectal cancer liver metastasis by acting as a ceRNA for microRNA‐215 to regulate ZEB2 expression. Theranostics 7, 4836–4849. - PMC - PubMed
    1. Chen X, Chen Z, Yu S, Nie F, Yan S, Ma P, Chen Q, Wei C, Fu H, Xu T et al (2018) Long noncoding RNA LINC01234 functions as a competing endogenous RNA to regulate CBFB expression by sponging miR‐204‐5p in gastric cancer. Clin Cancer Res 24, 2002–2014. - PubMed
    1. Cheng P, Wang J, Waghmare I, Sartini S, Coviello V, Zhang Z, Kim S‐H, Mohyeldin A, Pavlyukov MS, Minata M et al (2016) FOXD1‐ALDH1A3 signaling is a determinant for the self‐renewal and tumorigenicity of mesenchymal glioma stem cells. Cancer Res 76, 7219–7230. - PMC - PubMed

Publication types

MeSH terms