Clinical Trial
. 2020 May 27;12(1):47.
doi: 10.1186/s13073-020-00741-6.

Single-cell RNA sequencing reveals the tumor microenvironment and facilitates strategic choices to circumvent treatment failure in a chemorefractory bladder cancer patient

Affiliations
Clinical Trial

Single-cell RNA sequencing reveals the tumor microenvironment and facilitates strategic choices to circumvent treatment failure in a chemorefractory bladder cancer patient

Hye Won Lee et al. Genome Med. .

Abstract

Background: Tumor cell-intrinsic mechanisms and complex interactions with the tumor microenvironment contribute to therapeutic failure via tumor evolution. It may be possible to overcome treatment resistance by developing a personalized approach against relapsing cancers based on a comprehensive analysis of cell type-specific transcriptomic changes over the clinical course of the disease using single-cell RNA sequencing (scRNA-seq).

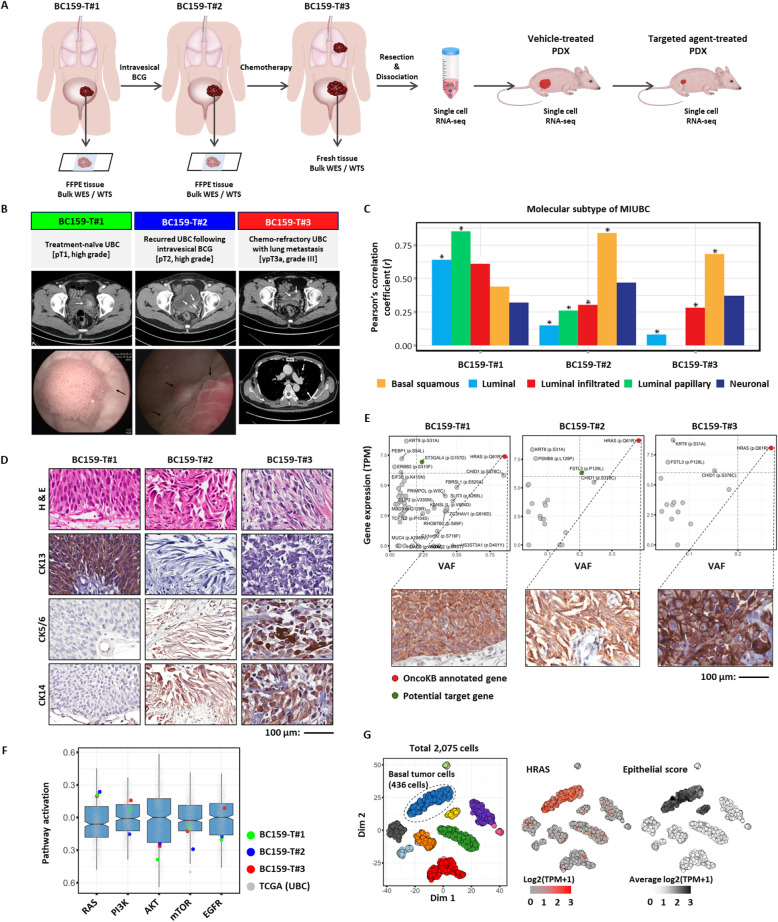
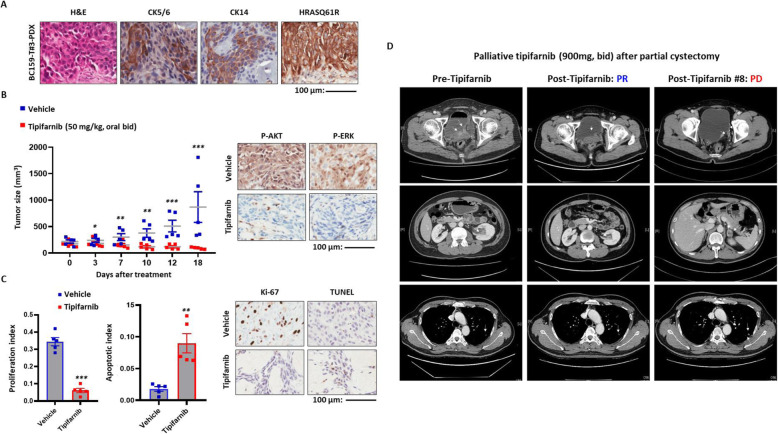
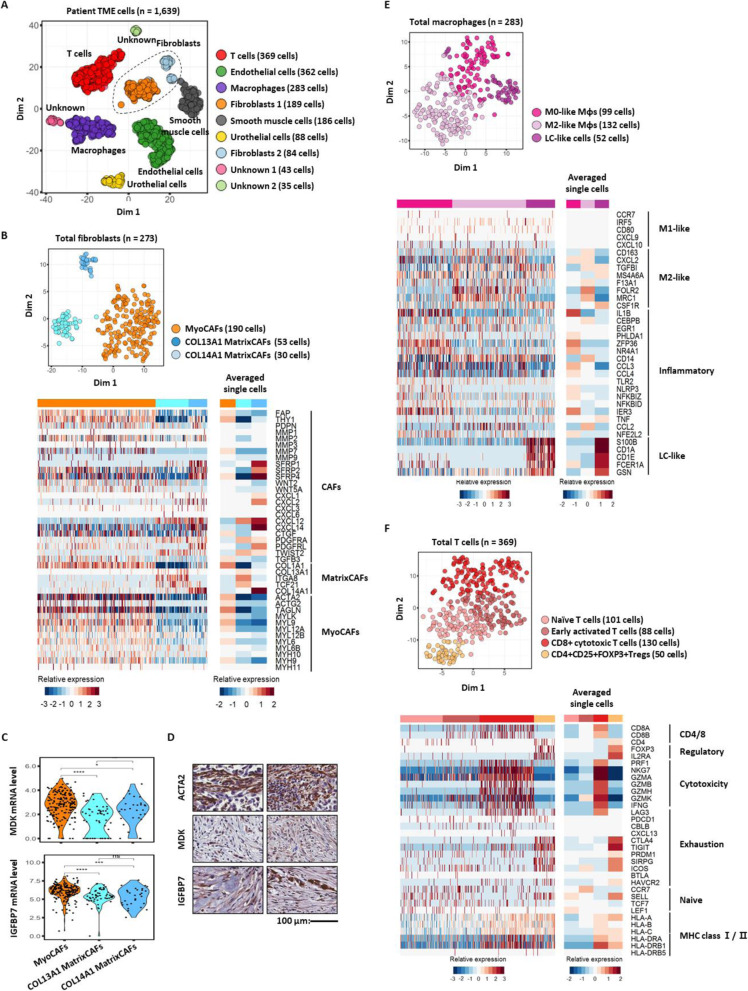
Methods: Here, we used scRNA-seq to depict the tumor landscape of a single case of chemo-resistant metastatic, muscle-invasive urothelial bladder cancer (MIUBC) addicted to an activating Harvey rat sarcoma viral oncogene homolog (HRAS) mutation. In order to analyze tumor evolution and microenvironmental changes upon treatment, we also applied scRNA-seq to the corresponding patient-derived xenograft (PDX) before and after treatment with tipifarnib, a HRAS-targeting agent under clinical evaluation.

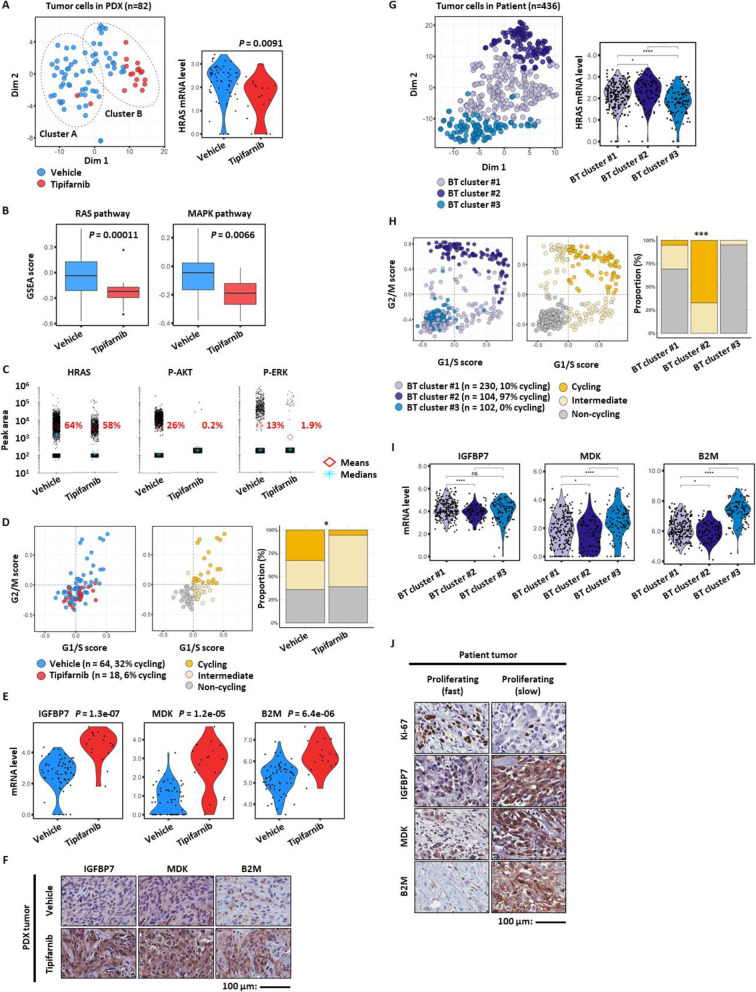
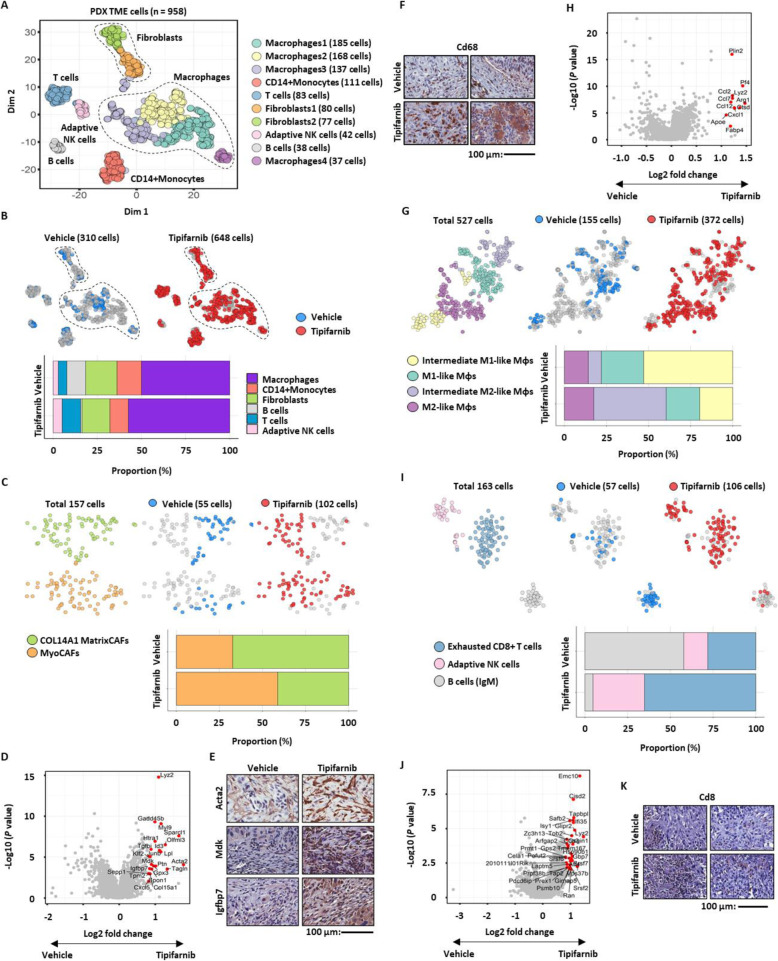
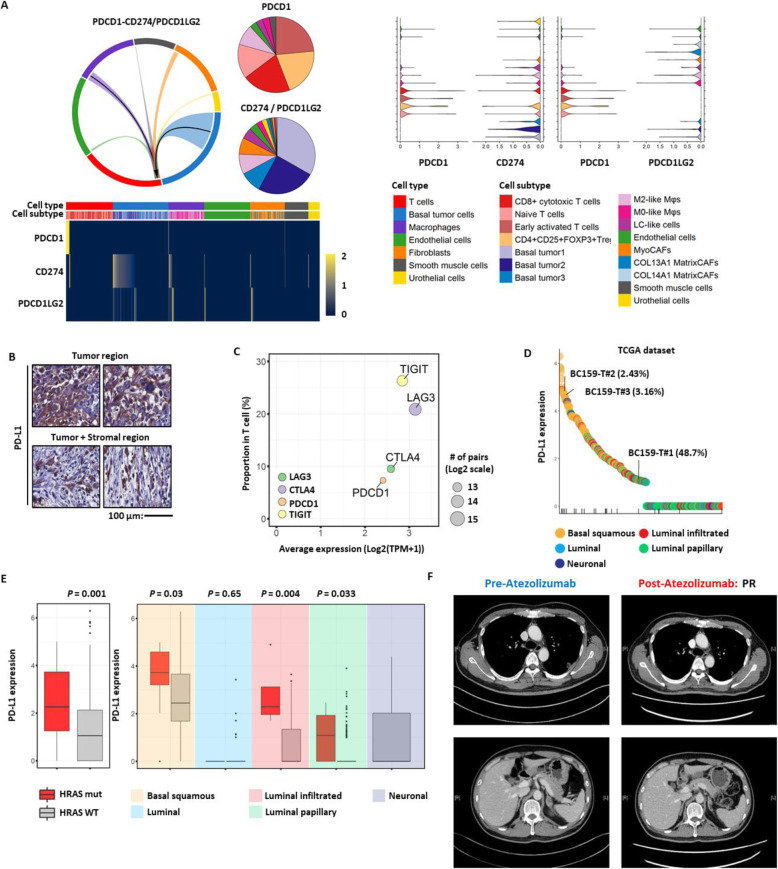
Results: In the parallel analysis of the human MIUBC and the PDX, diverse stromal and immune cell populations recapitulated the cellular composition in the human and mouse tumor microenvironment. Treatment with tipifarnib showed dramatic anticancer effects but was unable to achieve a complete response. Importantly, the comparative scRNA-seq analysis between pre- and post-tipifarnib-treated PDX revealed the nature of tipifarnib-refractory tumor cells and the tumor-supporting microenvironment. Based on the upregulation of programmed death-ligand 1 (PD-L1) in surviving tumor cells, and the accumulation of multiple immune-suppressive subsets from post-tipifarnib-treated PDX, a PD-L1 inhibitor, atezolizumab, was clinically applied; this resulted in a favorable response from the patient with acquired resistance to tipifarnib.

Conclusion: We presented a single case report demonstrating the power of scRNA-seq for visualizing the tumor microenvironment and identifying molecular and cellular therapeutic targets in a treatment-refractory cancer patient.

Keywords: Muscle-invasive urothelial bladder cancer; Single-cell RNA sequencing; Treatment resistance; Tumor microenvironment; Tumoral heterogeneity.


Conflict of interest statement

The authors declare that they have no competing interests.

Figures

Fig. 1
Fig. 1
Genomic characteristics and the identification of a druggable target of a chemo-refractory metastatic muscle-invasive urothelial bladder cancer (MIUBC). a Overall workflow. Abbreviations: BCG, Bacillus Calmette–Guerin; WES, whole exome sequencing; WTS, whole transcriptome sequencing. b Clinical course of the patient investigated in the present study. c The mRNA expression-based molecular subtype of MIUBC identified by Pearson’s correlation coefficients between the bulk RNA sequencing samples and pre-defined Cancer Genome Atlas Urothelial Bladder Carcinoma (TCGA-BLCA) samples. *P < 0.05. d Immunohistochemistry staining of cytokeratin (CK)13, CD5/6, and CK14 performed on tumor sections to validate the molecular subtype of each sample. Abbreviation: H&E, hematoxylin and eosin. Scale bar, 100 μm. e Scatter plots showing mRNA expression levels versus variant allele frequencies (VAFs) for nonsynonymous mutation genes. Gray lines indicate cutoff of potential treatment target (VAF > 0.2 and gene expression > 6). Potential treatment target genes are marked as colored dots. Immunohistochemistry staining of HRASQ61R (insets) demonstrates protein expression. Scale bar, 100 μm. f The activation scores of core cancer-related pathways are plotted for BC159-T#1, #2, #3, and TCGA-BLCA samples. The RAS pathway was activated in all BC159-T samples compared with TCGA-BLCA samples. Each box shows the median and IQR (interquartile range, 25th to 75th percentiles), and whiskers indicate the highest and lowest value within 1.5 times the IQR. g The in-depth validation at single-cell level. T-distributed stochastic neighbor embedding (tSNE) plot of 2075 cells in BC159-T#3 sample, color-coded by their graphic-based clusters; basal tumor cell cluster is marked as a circle (left panel). HRAS gene is overexpressed in basal tumor cells (middle panel). Epithelial cells were identified by the average expression of epithelial-related genes (right panel)
Fig. 2
Fig. 2
In vivo and clinical efficacy of the HRAS-targeting treatment. a Immunohistochemistry staining of protein markers of basal squamous subtype (CD5/6, CD14) and mutant HRASQ61R protein performed on tumor sections from patient-derived xenograft (PDX) of BC159-T#3. Abbreviation: H&E, hematoxylin and eosin. Scale bar, 100 μm. b Tumor sizes were measured in BC159-T#3 PDX administered tipifarnib (50 mg/kg) or vehicle as control. ***P < 0.001, **P < 0.01, *P < 0.05, Error bars indicate standard deviation (SD) (left panel). Immunohistochemistry staining of phosphorylated-AKT (P-AKT) and ERK (P-ERK) using PDX to evaluate the inhibitory effects of tipifarnib on HRAS downstream pathways (right panel). c Comparison of tumor cell proliferation and apoptosis between the tipifarnib and vehicle groups. ***P < 0.001, **P < 0.01, *P < 0.05. Error bars indicate SD (left panel). Immunohistochemistry staining of protein markers of proliferation (Ki-67) and apoptosis (TUNEL) performed on PDX tumor sections to validate the therapeutic efficacy (right panel). d Clinical responses to tipifarnib of the patient evaluated by serial chest–abdomen–pelvis computed tomography (CT). Left panel, before initiation of tipifarnib; middle panel, partial response to tipifarnib; right, the progression of primary tumor and lung metastases due to the resistance to tipifarnib
Fig. 3
Fig. 3
Tumor cell-intrinsic factors underlying treatment resistance to tipifarnib. a tSNE plot of total human tumor cells (dots) from the PDX model of BC159-T#3, color-coded by sample origin, circled by cluster (left panel). Comparison of HRAS mRNA expression level in tumor cells treated with tipifarnib or vehicle as control. Dots indicate individual cells, P = 0.0091 (right panel). b Comparison of RAS and MAPK pathway activity in tumor cells treated by tipifarnib and vehicle as control. P = 0.00011, P = 0.0066, respectively. Each box shows the median and IQR (interquartile range, 25th to 75th percentiles), whiskers indicate the highest and lowest value within 1.5 times the IQR, and outliers are marked as dots. c Single-cell western blots of HRAS protein and its downstream protein markers (p-AKT and p-ERK) in tumor cells treated with tipifarnib or vehicle. Dots indicate individual cells, and diamond and star shapes indicate means and median of peak area, respectively. d Prediction of cell cycle state in tumor cells from PDX at a single-cell level (dots) using G1/S and G2/M module score (left panel). Cells are colored by their assigned cell cycle state (cycling; orange, intermediate; yellow, non-cycling; gray, middle panel). The relative cellular composition for tumor cells treated with tipifarnib or vehicle. Chi-squared test, P = 0.021, *P < 0.05 (right panel). e Violin plots of significantly upregulated genes, IGFBP7, MDK, and B2M, in tumor cells treated by tipifarnib or vehicle (dots). P = 1.3e−07, P = 1.2e−05, P = 6.4e−06, respectively. f Validation of comparative upregulation of IGFBP7, MDK, and B2M in tumor cells treated with tipifarnib compared to those with vehicle by immunohistochemistry staining performed on PDX. Scale bar, 100 μm. g tSNE plot of total tumor cells from BC159-T#3 patient tumor, color-coded by cluster (left panel). Violin plot of HRAS mRNA expression level against distinct tumor cell clusters of BC159-T#3. Student’s t test, ****P < 0.0001, *P < 0.05. Abbreviation: BT, basal tumor (right panel). h Prediction of cell cycle state in tumor cells from BC159-T#3 at a single-cell level (dots) using G1/S and G2/M module score (left panel). Cells are colored by cell cycle as in d (middle panel). The relative cellular composition among basal tumor clusters. Chi-squared test, P < 2.2e−16, ****P < 0.0001 (right panel). i Violin plots of mRNA expression levels of IGFBP7, MDK, and B2M against distinct tumor cell clusters of BC159-T#3 (dots). ****P < 0.0001, *P < 0.05. j Comparison of IGFBP7, MDK, and B2M protein expression between fast (upregulated Ki-67) and slow (downregulated Ki-67) growing regions in BC159-T#3 by immunohistochemistry staining. Scale bar, 100 μm
Fig. 4
Fig. 4
Tumor cell extrinsic factors underlying treatment resistance to tipifarnib. a tSNE plot of non-tumor mouse cells (dots) from PDX of BC159-T#3, color-coded by cluster, circled by global cell type. b tSNE plot, color-coded by sample origin and circled by cell type (top panel). Relative cellular composition of non-tumor mouse cells treated with tipifarnib or vehicle (bottom panel). c tSNE plot (top panel) and relative cellular composition (bottom panel) of fibroblasts from PDX mouse cells treated with tipifarnib or vehicle, color-coded by cluster (top left panel) or sample origin (top middle and right panel). d Volcano plot of differentially expressed genes in mouse fibroblasts from PDX treated with tipifarnib or vehicle. Genes with fold change > 0.8 with P < 0.001 are colored in red. e Validation of relative overexpression of Igfbp7 and Mdk in mouse cancer-associated myofibroblasts (MyoCAFs, ACTA2 positive) from the tipifarnib group compared to those from the vehicle group by immunohistochemistry staining. Scale bar, 100 μm. f Increased infiltration of mouse macrophages (CD68 positive) in PDXs treated with tipifarnib confirmed by immunohistochemistry staining. Scale bar, 100 μm. g tSNE plot (top panel) and relative cellular composition (bottom panel) of mouse macrophages from PDX treated with tipifarnib or vehicle, color-coded by cluster (top left panel) and sample origin (top middle and right panel). h Volcano plot of differentially expressed genes between vehicle and tipifarnib-treated mouse macrophages from PDX. Genes with fold change > 0.8 with P < 0.001 are colored in red. i tSNE plot (top panel) and relative cellular composition (bottom panel) of mouse lymphocytes from PDX treated with tipifarnib or vehicle, color-coded by cluster (top left panel) and sample origin (top middle and right panel). j Volcano plot of differentially expressed genes between vehicle and tipifarnib-treated mouse T cells from PDX. Genes with fold change > 0.8 with P < 0.001 are colored in red. k Increased infiltration of mouse T cells (CD8 positive) in PDX treated with tipifarnib confirmed by immunohistochemistry staining. Scale bar, 100 μm
Fig. 5
Fig. 5
Parallel analysis of the tumor microenvironment in BC159-T#3. a tSNE plot of non-tumor cells (dots) from BC159-T#3 sample, color-coded by cluster; fibroblasts are circled. b tSNE plot of human fibroblasts (dots), color-coded by cluster (top panel). Heatmaps of single cells (bottom left panel) and averaged single cells (bottom right panel) represent the mRNA expression levels of well-known markers for fibroblasts. c Violin plots of MDK and IGFBP7 mRNA expression levels in three fibroblast clusters. Abbreviations: MyoCAFs, cancer-associated myofibroblasts; COL13A1 MatrixCAFs, COL13A1 expressing cancer-associated matrix fibroblasts; COL14A1 MatrixCAFs, COL14A1 expressing cancer-associated matrix fibroblasts. ****P < 0.0001, ***P < 0.001, **P < 0.01, *P < 0.05. d Validation of protein expression of IGFBP7 and MDK in fibroblasts (ACTA2 positive) from BC159-T#3 by immunohistochemistry staining. Scale bar, 100 μm. e tSNE plot of human macrophages (dots), color-coded by cluster (top panel). Heatmaps of single cells (bottom left panel) and averaged single cells (bottom right panel) represent the mRNA expression levels of well-known markers for macrophage subtypes. Abbreviation: LC-like cells, Langerhans cell-like cells. f tSNE plot of human T cells (dots), color-coded by cluster (top panel). Heatmaps of single cells (bottom left panel) and averaged single cells (bottom right panel) represent the mRNA expression levels of well-known markers of T cell subtypes
Fig. 6
Fig. 6
Programmed death receptor 1/programmed death-ligand 1 inhibitor as a potential treatment strategy against tipifarnib-resistant tumors developed from BC159-T#3. a Receptor–ligand interaction between the programmed death receptor 1 (PD-1) and its ligands (PD-L1/PD-L2) of total cells from BC159-T#3. Arrows indicate the direction of interaction (from ligand to receptor) that expresses more than 10% of the ligand genes (left top panel). Pie charts demonstrating the cell composition that express PDCD1/PD-1, CD274/PD-L1, and PDCD1LG2/PD-L2 genes (left top panel). Heatmap of single cells showing the mRNA expression levels of PDCD1/PD-1, CD274/PD-L1, and PDCD1LG2/PD-L2 genes (left bottom panel). 2D-violin plots represent each interaction of PD-1-PDL1 or PD-L2 (right panel). b Representative images for immunohistochemical staining of PD-L1 in BC159-T#3. Expression is specific in tumor cells in the core and stromal border. Scale bar, 100 μm. c Scatter plot representing the average expression of target ligands (x-axis) and the proportion of target receptors in T cells (y-axis). Circle size is proportional to the number of pairing between target ligands and receptors in log2 scale. dCD274/PD-L1 mRNA expression levels are plotted for BC159-T#1, #2, #3, and TCGA-BLCA samples. All samples are colored by molecular subtype. The samples with HRASQ61R mutation are marked in the bottom row of vertical ticks. eCD274/PD-L1 mRNA expression levels according to HRASQ61R mutation. Patients with HRASQ61R mutation in basal squamous subtype show upregulated expression of CD274/PD-L1. Each box shows the median and IQR (interquartile range, 25th to 75th percentiles), whiskers indicate the highest and lowest value within 1.5 times the IQR, and outliers are marked as dots. f Clinical partial response to atezolizumab (a fully humanized, engineered monoclonal antibody of IgG1 isotype against PD-L1) evaluated by CT scan

References

    1. Lee JK, Wang J, Sa JK, Ladewig E, Lee HO, Lee IH, Kang HJ, Rosenbloom DS, Camara PG, Liu Z, et al. Spatiotemporal genomic architecture informs precision oncology in glioblastoma. Nat Genet. 2017;49:594–599. - PMC - PubMed
    1. Dzobo K, Senthebane DA, Thomford NE, Rowe A, Dandara C, Parker MI. Not everyone fits the mold: intratumor and intertumor heterogeneity and innovative cancer drug design and development. OMICS. 2018;22:17–34. - PubMed
    1. Lovly CM, Salama AK, Salgia R. Tumor heterogeneity and therapeutic resistance. Am Soc Clin Oncol Educ Book. 2016;35:e585–e593. - PMC - PubMed
    1. Wang J, Cazzato E, Ladewig E, Frattini V, Rosenbloom DI, Zairis S, Abate F, Liu Z, Elliott O, Shin YJ, et al. Clonal evolution of glioblastoma under therapy. Nat Genet. 2016;48:768–776. - PMC - PubMed
    1. Junttila MR, de Sauvage FJ. Influence of tumour micro-environment heterogeneity on therapeutic response. Nature. 2013;501:346–354. - PubMed

Publication types

MeSH terms