. 2020 May 27;51(1):73.
doi: 10.1186/s13567-020-00795-9.

Characterization of splenic MRC1hiMHCIIlo and MRC1loMHCIIhi cells from the monocyte/macrophage lineage of White Leghorn chickens

Affiliations

Characterization of splenic MRC1hiMHCIIlo and MRC1loMHCIIhi cells from the monocyte/macrophage lineage of White Leghorn chickens

Keesun Yu et al. Vet Res. .

Abstract

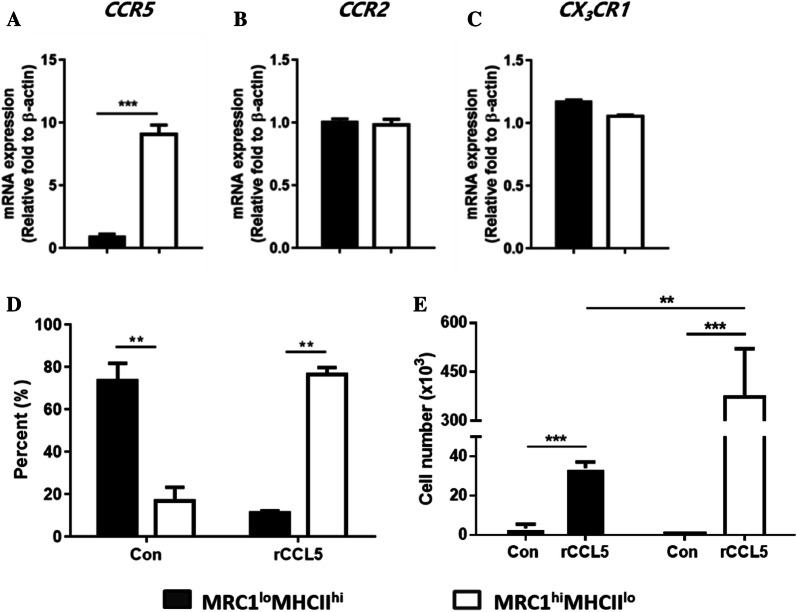
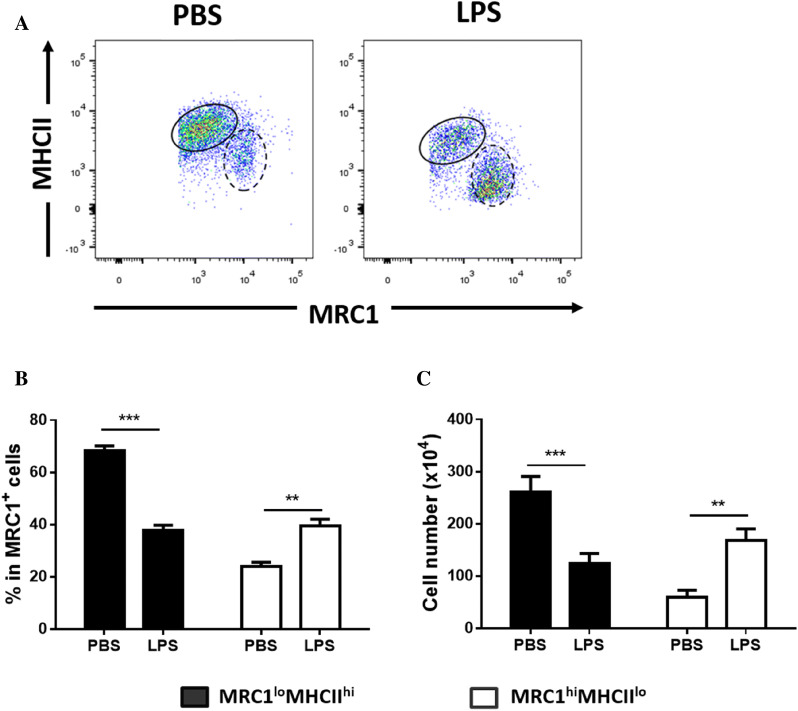
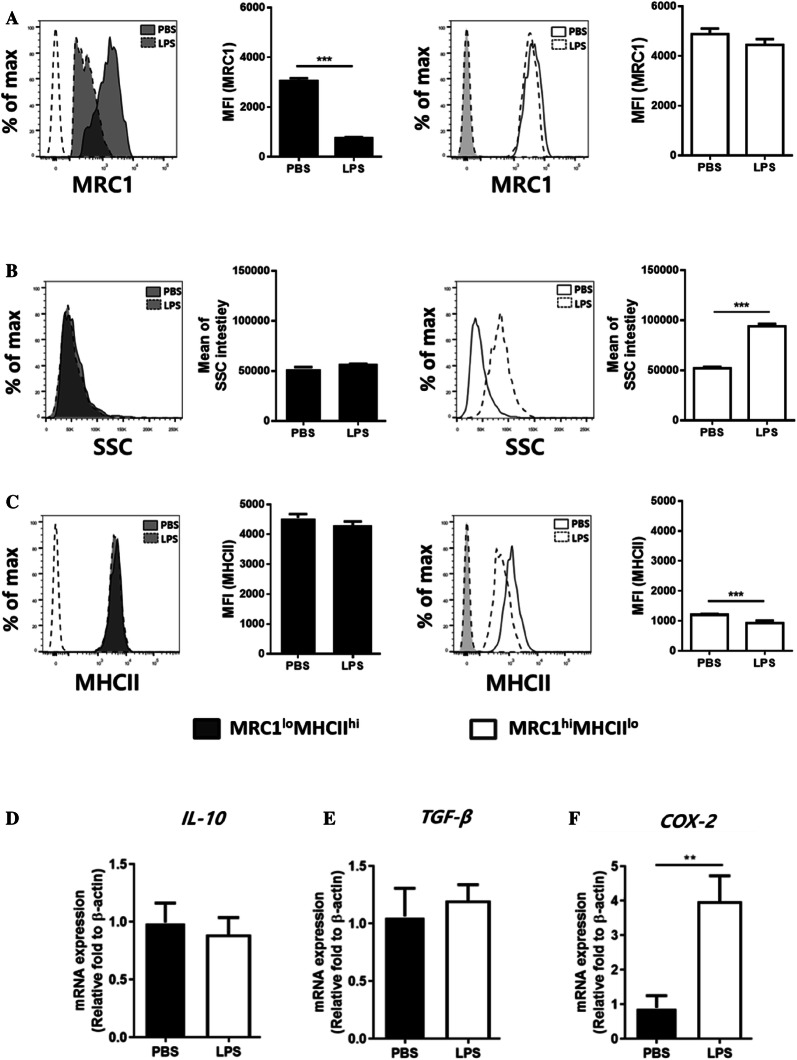
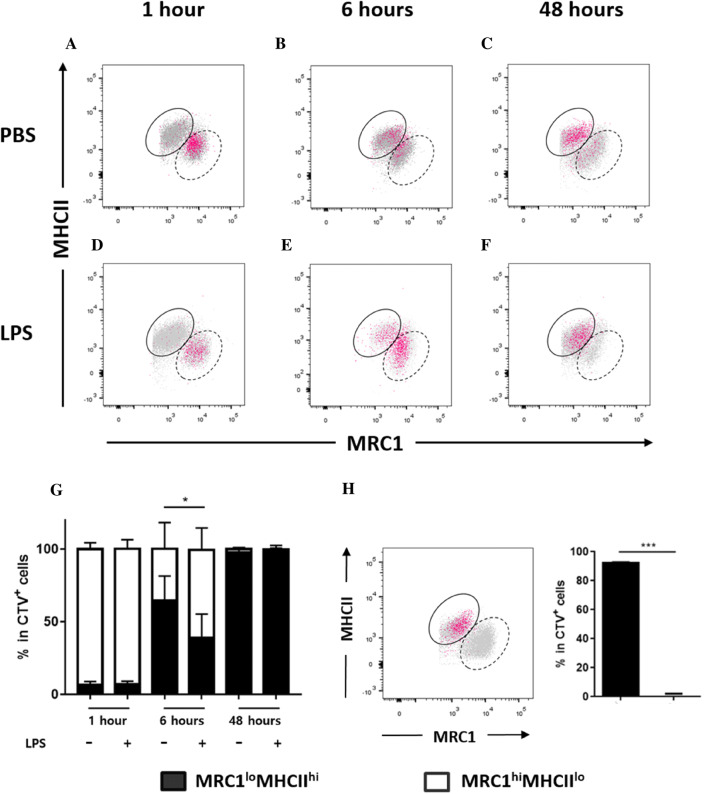
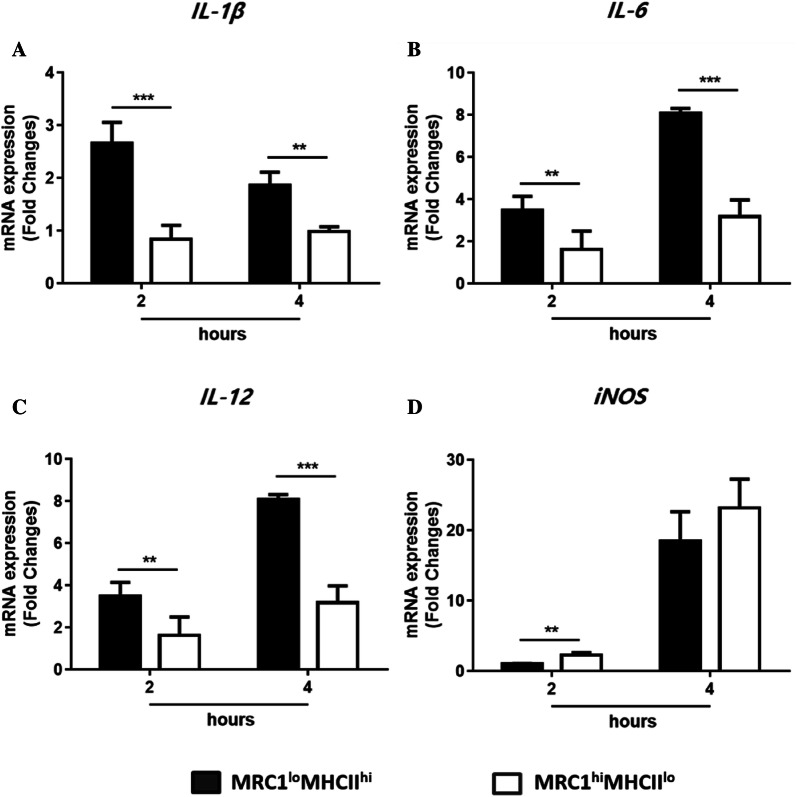
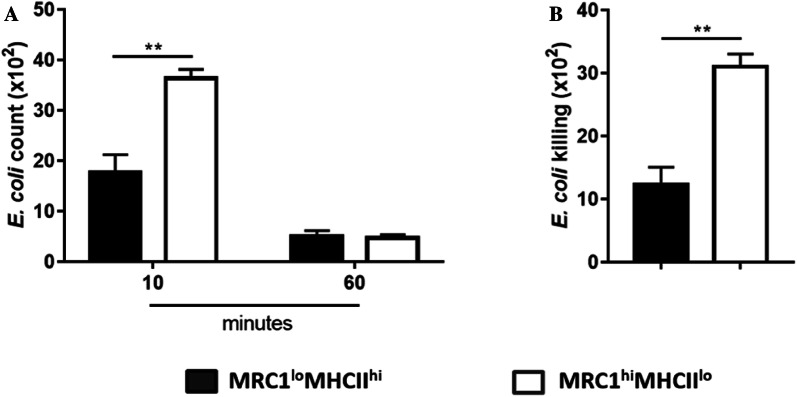
Monocytes/macrophages, which are found in a variety of organs, maintain tissue homeostasis at a steady state and act as the first line of defence during pathogen-induced inflammation in the host. Most monocyte/macrophage lineage studies in chickens have been largely performed using cell lines, while few studies using primary cells have been conducted. In the present study, the phenotypic and functional characteristics of splenic monocyte/macrophage lineage cells during steady state and inflammatory conditions were examined. Splenic monocyte/macrophage lineage cells could be identified as MRC1loMHCIIhi and MRC1hiMHCIIlo cells based on their surface expression of MRC1 and MHCII. In the steady state, MRC1loMHCIIhi cells were more frequently found among MRC1+ cells. MRC1loMHCIIhi cells expressed a higher number of antigen-presenting molecules (MHCII, MHCI, and CD80) than MRC1hiMHCIIlo cells. In contrast, MRC1hiMHCIIlo cells showed better phagocytic and CCR5-dependent migratory properties than MRC1loMHCIIhi cells. Furthermore, MRC1hiMHCIIlo cells infiltrated the spleen in vivo and then became MRC1loMHCIIhi cells. During lipopolysaccharide (LPS)-induced inflammatory conditions that were produced via intraperitoneal (i.p.) injection, the proportion and absolute number of MRC1hiMHCIIlo cells were increased in the spleen. Uniquely, inflammation induced the downregulation of MHCII expression in MRC1hiMHCIIlo cells. The major source of inflammatory cytokines (IL-1β, IL-6, and IL-12) was MRC1loMHCIIhi cells. Furthermore, MRC1hiMHCIIlo cells showed greater bactericidal activity than MRC1loMHCIIhi cells during LPS-induced inflammation. Collectively, these results suggest that two subsets of monocyte/macrophage lineage cells exist in the chicken spleen that have functional differences.


Conflict of interest statement

The authors declare that they have no competing interests.

Figures

Figure 1
Figure 1
Two distinct populations of MRC1+cells were found in spleen from chickens based on the expression of MRC1 and MHCII. Various organs were harvested from 3-week-old chickens. Single cells were stained with anti-chicken MRC1 and MHCII antibodies and analysed by flow cytometry. The gating strategy is shown in Additional file 1. A Representative dot plots of MRC1+ cells in bone marrow, the bursa of Fabricius, thymus, blood, caecal tonsil, and lung (n = 10). An identical gating strategy for MRC1loMHCIIhi and MRC1hiMHCIIlo cells in the spleen was used in each panel. A representative figure from three independent experiments with similar results is shown. B Two distinct populations of spleicn MRC1+ cells are shown. The gate with the solid line represents MRC1loMHCIIhi cells, and the gate with the dashed line represents MRC1hiMHCIIlo cells. C Proportion and D absolute number of MRC1loMHCIIhi and MRC1hiMHCIIlo cells in the spleen. E Single cells prepared from the spleen were stained with anti-chicken MRC1, MHCII, MHCI, and CD80 antibodies. Representative histograms display the surface expression of MRC1, MHCI, MHCII or CD80 on MRC1loMHCIIhi and MRC1hiMHCIIlo cell (upper panel). Dashed histograms represent the isotype control. The bar graph represents the mean fluorescence intensity (MFI) of the target molecules (lower panel). Representative histograms are shown with data from three independent experiments with similar results. Data are represented as the mean ± SD. ***P < 0.001.
Figure 2
Figure 2
Splenic MRC1hiMHCIIlocells exhibit phagocytic properties superior to those of MRC1loMHCIIhicells under steady-state conditions. For the in vitro phagocytosis assay, MRC1+ cells were sorted from splenocytes by positive selection. MRC1+ cells (1 × 106 cells/mL) were preincubated for 3 h and then incubated with A CTV-labelled dead cells (1 × 106 cells/mL) or B OVA-FITC (1 ng/mL) for 1 h at 39 °C or 4 °C. The gating strategy is shown in Additional file 3. Data obtained at 39 °C were normalized according to results obtained at 4 °C. The data represent A the percentages of the MRC1+ cell subsets in the CTV+ gate and B the mean fluorescence intensity (MFI) of OVA-FITC in MRC1loMHCIIhi and MRC1hiMHCIIlo cells (n = 10). Data are represented as the mean values ± SD. ***P < 0.001.
Figure 3
Figure 3
Splenic MRC1hiMHCIIlocells migrated towards CCL5 better than MRC1loMHCIIhicells.A-C Chicken splenocytes were sorted into MRC1loMHCIIhi and MRC1hiMHCIIlo cell populations using a cell sorter. The transcriptional levels of the chicken chemokine receptors A CCR5, B CCR2 and C CX3CR1 were analysed by RT-qPCR. Their expression was normalized to the β-actin mRNA level (n = 10). Data are represented as the mean values ± SD. ***P < 0.001. D, E For the in vitro migration assay, bead-sorted splenic MRC1+ cells (1 × 106 cells/mL) in 200 μL of media were placed in the insert of the transwell plate. The lower compartment was filled with media in the absence or presence of recombinant chicken CCL5 protein (50 ng/mL). After 1 h, D the percentage and E absolute number of migrated cells in the lower compartment were quantified by flow cytometry (n = 10). Data are represented as the mean values ± SD. **P < 0.01 ***P < 0.001.
Figure 4
Figure 4
LPS-induced inflammation in chickens resulted in changes in the proportion and number of the two populations of splenic MRC1+cells. Chickens were administered PBS or LPS (1 mg/kg body weight) i.p. After 4 h, the spleens were collected, and the splenocytes were analysed to determine the number and proportional changes of the subtypes of MRC1+ cells by flow cytometry. A Representative dot plot with similar results showing MRC1+ cells from the spleen of chickens administered PBS or LPS. The solid line represents MRC1loMHCIIhi cells, whereas the dashed line represents MRC1hiMHCIIlo cells. The bar graph represents the B proportion and C absolute number of the two subsets in the PBS or LPS administration group (n = 10). Data are represented as the mean values ± SD. **P < 0.01, ***P < 0.001.
Figure 5
Figure 5
LPS-induced inflammation in chickens decreased MHCII expression in splenic MRC1hiMHCIIlocells. Chickens were administered PBS or LPS (500 μL of 1 mg/kg body weight) i.p. for 4 h. Then, the spleen was collected and analysed to determine the A-C phenotype and D-F mRNA levels of potential mediators through flow cytometry and RT-qPCR, respectively. Representative histograms show the changes in A MRC1, B SSC, and C MHCII expression in the two subsets at 4 h after LPS injection. Solid histograms represent the PBS group, and dashed histograms show the LPS group. Dashed histograms without colour (left) and with colour (right) represent the isotype control. The bar graph represents the MFI of the expression (n = 10) **P < 0.01, ***P < 0.001. Transcriptional levels of D IL-10, E TGF-β, and F COX-2 in splenocytes were examined by RT-qPCR. The expression was normalized to the β-actin mRNA level (n = 10). Data are represented as the mean values ± SD. **P < 0.01.
Figure 6
Figure 6
Splenic MRC1+cells were replenished by monocytes and showed distinct phenotypic changes in chickens with LPS-induced inflammation. AG PBMCs were isolated from 3-week-old chickens, labelled with CTV, and transferred into age-matched recipient chickens via the intravenous route (200 μL of 1 × 107 cells). To cause LPS-induced inflammation, recipient chickens were intraperitoneally administered 200 μL of LPS (1 mg/kg body weight) or the same volume of PBS (control) immediately after the cell transfer. At 1, 6, and 48 h after LPS administration, spleens were isolated from recipient chickens, and the splenocytes were stained with anti-chicken MRC1 and MHCII antibodies. Injected PBMCs were distinguished from recipient cells (grey dots) by analysing the CTV+-pre-gated cells (pink dots). In addition, the MRC1+ cells were gated, and the expression of MRC1 and MHCII was examined by flow cytometry for MRC1loMHCIIhi (solid line) and MRC1hiMHCIIlo cells (dashed line). Representative dot plot of the results from 1-, 6-, and 48-h post-adoptive transfer AF showed the proportion of donor MRC1+ cells (pink) within the recipient MRC1+ populations (grey) in the spleen. The bar graph G represents the proportion of MRC1loMHCIIhi and MRC1hiMHCIIlo cells within CTV+MRC1+ donor cells in the recipient after adoptive transfer (n = 10). H MRC1loMHCIIhi cells were sorted from the spleen of 3-week-old chickens and labelled with CTV. CTV-labelled MRC1loMHCIIhi cells were transferred into age-matched recipient chickens via the intravenous route (200 μL of 1 × 107 cells). Then, the recipient chickens were intraperitoneally administered 200 μL of LPS (1 mg/kg body weight). Pink dots represent donor cells, and grey dots recipient cells. The bar graph displays the proportions of MRC1loMHCIIhi and MRC1hiMHCIIlo cells within CTV+MRC1+ cells (pink in the left panel) at 6 h after the cell transfer (n = 6). Data are represented as the mean values ± SD. * P < 0.05, *** P < 0.001.
Figure 7
Figure 7
Splenic MRC1loMHCIIhicells were the main source of inflammatory cytokines. The mRNA expression of A IL-1β, B IL-6, C IL-12, and D iNOS in FACS-sorted MRC1loMHCIIhi and MRC1hiMHCIIlo cells from the spleen of chickens at 2 and 4 h post-LPS injection. Data are normalized according to the data of the PBS group (n = 10). Data are represented as the mean values ± SD. **P < 0.01, ***P < 0.001.
Figure 8
Figure 8
Splenic MRC1hiMHCIIlocells showed a superior bacterial killing capacity compared to that of MRC1loMHCIIhicells when treated with LPS. A The bar graph represents the remaining bacteria in the FACS-sorted MRC1loMHCIIhi and MRC1hiMHCIIlo cell lysates after 10 (uptake assay) or 60 min (clearance assay) of gentamicin treatment. B The bar graph represents the bacterial killing capacity of MRC1loMHCIIhi and MRC1hiMHCIIlo cells. Data were calculated by subtracting the number of bacteria remaining after clearance from the number from the uptake assay (n = 10). Data are represented as the mean values ± SD. **P < 0.01.

References

    1. van Furth R, Cohn ZA, Hirsch JG, Humphrey JH, Spector WG, Langevoort HL. The mononuclear phagocyte system: a new classification of macrophages, monocytes, and their precursor cells. Bull World Health Organ. 1972;46:845–852. - PMC - PubMed
    1. Gomez Perdiguero E, Klapproth K, Schulz C, Busch K, Azzoni E, Crozet L, Garner H, Trouillet C, de Bruijn MF, Geissmann F, Rodewald HR. Tissue-resident macrophages originate from yolk-sac-derived erythro-myeloid progenitors. Nature. 2015;518:547–551. - PMC - PubMed
    1. Li MO, Sarkisian MR, Mehal WZ, Rakic P, Flavell RA. Phosphatidylserine receptor is required for clearance of apoptotic cells. Science. 2003;302:1560–1563. - PubMed
    1. Munoz-Espin D, Canamero M, Maraver A, Gomez-Lopez G, Contreras J, Murillo-Cuesta S, Rodriguez-Baeza A, Varela-Nieto I, Ruberte J, Collado M, Serrano M. Programmed cell senescence during mammalian embryonic development. Cell. 2013;155:1104–1118. - PubMed
    1. Shi C, Pamer EG. Monocyte recruitment during infection and inflammation. Nat Rev Immunol. 2011;11:762–774. - PMC - PubMed

LinkOut - more resources