

A review of the use of propensity score diagnostics in papers published in high-ranking medical journals
- PMID: 32460872
- PMCID: PMC7251670
- DOI: 10.1186/s12874-020-00994-0
A review of the use of propensity score diagnostics in papers published in high-ranking medical journals
Abstract
Background: Propensity scores are widely used to deal with confounding bias in medical research. An incorrectly specified propensity score model may lead to residual confounding bias; therefore it is essential to use diagnostics to assess propensity scores in a propensity score analysis. The current use of propensity score diagnostics in the medical literature is unknown. The objectives of this study are to (1) assess the use of propensity score diagnostics in medical studies published in high-ranking journals, and (2) assess whether the use of propensity score diagnostics differs between studies (a) in different research areas and (b) using different propensity score methods.
Methods: A PubMed search identified studies published in high-impact journals between Jan 1st 2014 and Dec 31st 2016 using propensity scores to answer an applied medical question. From each study we extracted information regarding how propensity scores were assessed and which propensity score method was used. Research area was defined using the journal categories from the Journal Citations Report.
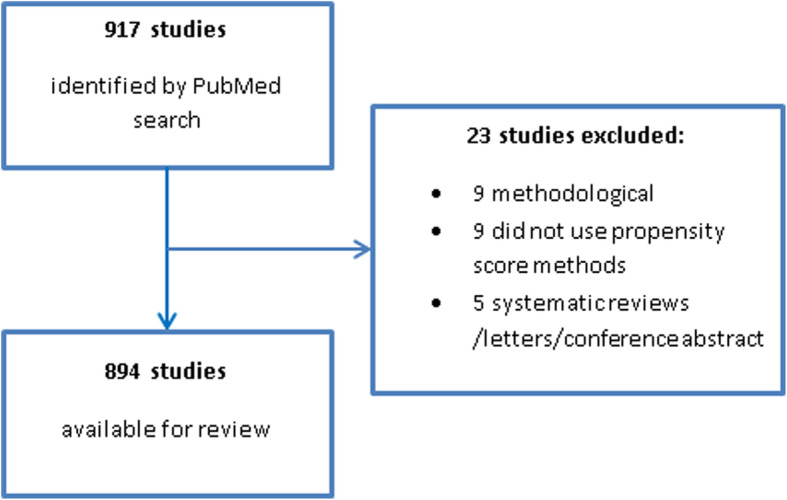
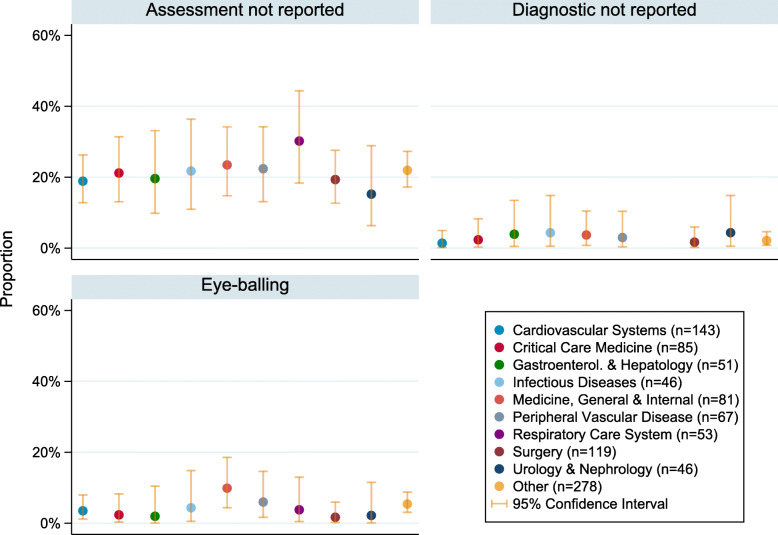
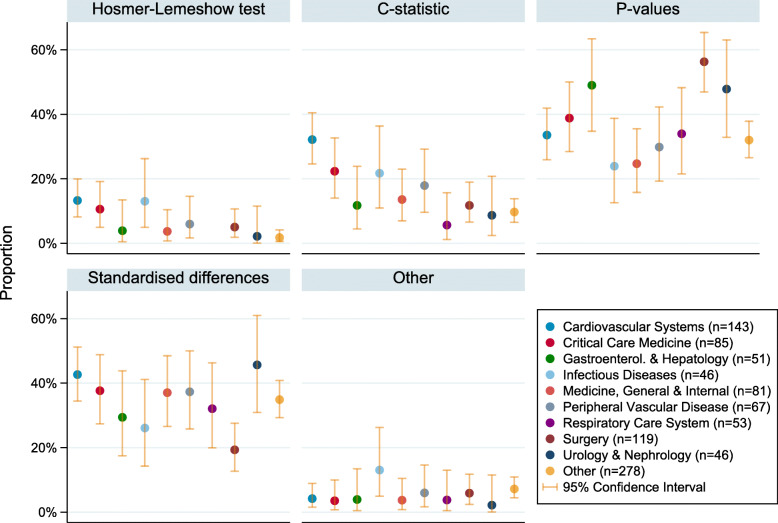
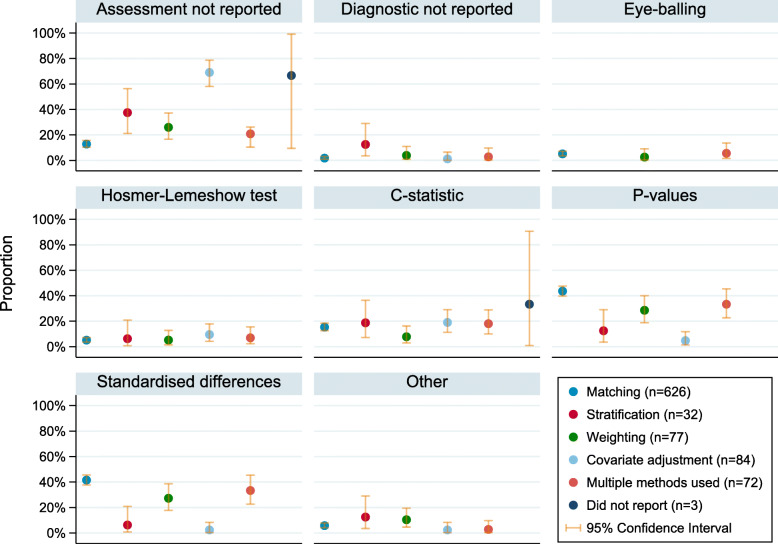
Results: A total of 894 papers were included in the review. Of these, 187 (20.9%) failed to report whether the propensity score had been assessed. Commonly reported diagnostics were p-values from hypothesis tests (36.6%) and the standardised mean difference (34.6%). Statistical tests provided marginally stronger evidence for a difference in diagnostic use between studies in different research areas (p = 0.033) than studies using different propensity score methods (p = 0.061).
Conclusions: The use of diagnostics in the propensity score medical literature is far from optimal, with different diagnostics preferred in different areas of medicine. The propensity score literature may improve with focused efforts to change practice in areas where suboptimal practice is most common.
Keywords: Confounding; Covariate balance; Diagnostics; Epidemiology; Propensity scores.
Conflict of interest statement
The authors declare that they have no competing interests.
Figures
References
-
- Peduzzi P, Concato J, Kemper E, et al. A simulation study of the number of events per variable in logistic regression analysis. J Clin Epidemiol. 1996;49:1373–1379. - PubMed
-
- Rosenbaum PR, Rubin DB. The central role of the propensity score in observational studies for causal effects. Biometrika. 1983;70:41–55.
-
- Rosenbaum PR, Rubin DB. Reducing bias in observational studies using subclassification on the propensity score. J Am Stat Assoc. 1984;79:516–524.
Publication types
MeSH terms
Grants and funding
LinkOut - more resources
Full Text Sources
Research Materials
