. 2020 Jul;215(3):653-664.
doi: 10.1534/genetics.120.303351. Epub 2020 May 27.

Base-Pairing Requirements for Small RNA-Mediated Gene Silencing of Recessive Self-Incompatibility Alleles in Arabidopsis halleri

Affiliations

Base-Pairing Requirements for Small RNA-Mediated Gene Silencing of Recessive Self-Incompatibility Alleles in Arabidopsis halleri

Nicolas Burghgraeve et al. Genetics. 2020 Jul.

Abstract

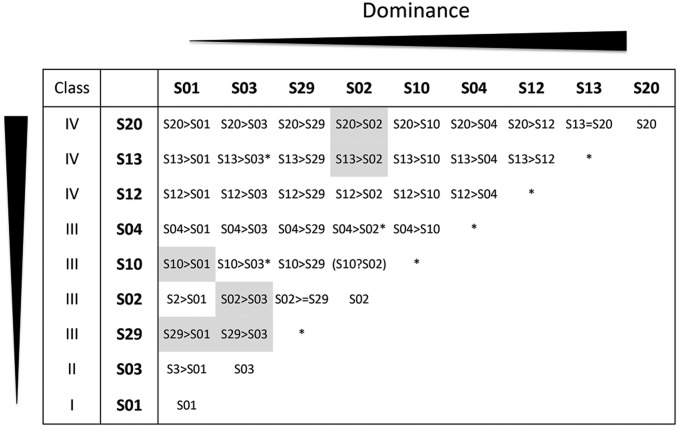
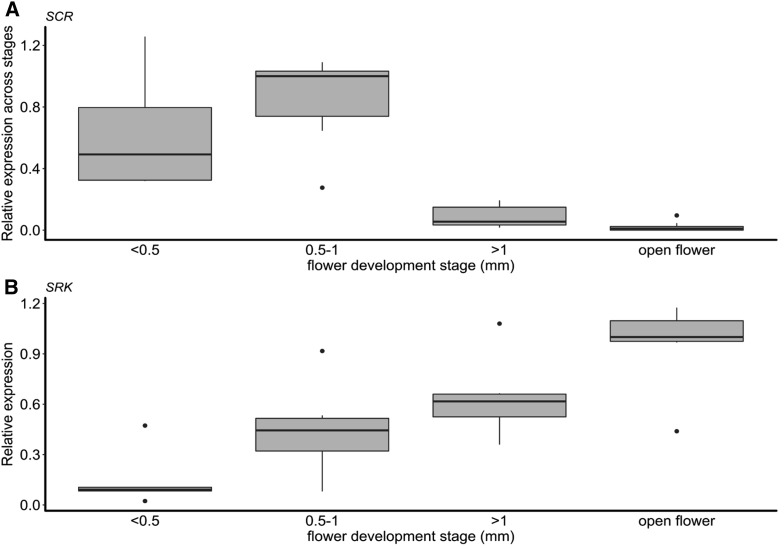
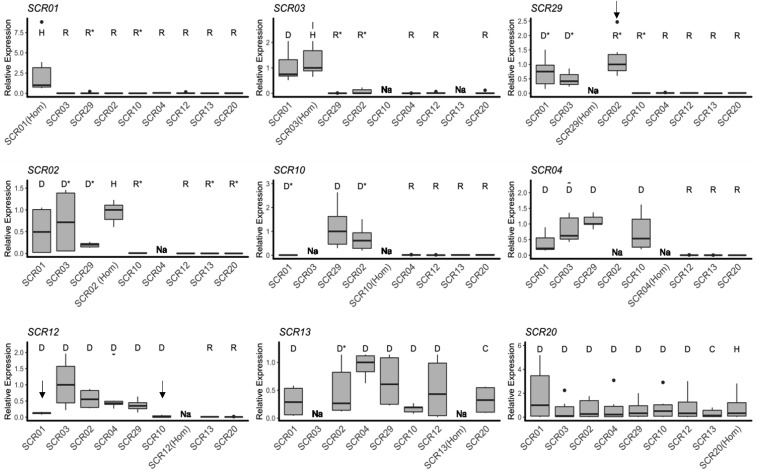
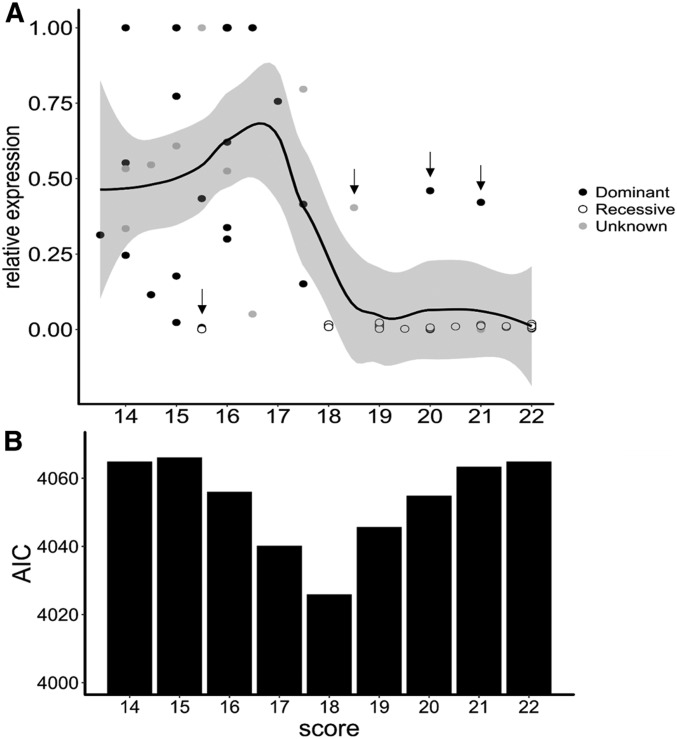
Small noncoding RNAs are central regulators of genome activity and stability. Their regulatory function typically involves sequence similarity with their target sites, but understanding the criteria by which they specifically recognize and regulate their targets across the genome remains a major challenge in the field, especially in the face of the diversity of silencing pathways involved. The dominance hierarchy among self-incompatibility alleles in Brassicaceae is controlled by interactions between a highly diversified set of small noncoding RNAs produced by dominant S-alleles and their corresponding target sites on recessive S-alleles. By controlled crosses, we created numerous heterozygous combinations of S-alleles in Arabidopsis halleri and developed an real-time quantitative PCR assay to compare allele-specific transcript levels for the pollen determinant of self-incompatibility (SCR). This provides the unique opportunity to evaluate the precise base-pairing requirements for effective transcriptional regulation of this target gene. We found strong transcriptional silencing of recessive SCR alleles in all heterozygote combinations examined. A simple threshold model of base pairing for the small RNA-target interaction captures most of the variation in SCR transcript levels. For a subset of S-alleles, we also measured allele-specific transcript levels of the determinant of pistil specificity (SRK), and found sharply distinct expression dynamics throughout flower development between SCR and SRK In contrast to SCR, both SRK alleles were expressed at similar levels in the heterozygote genotypes examined, suggesting no transcriptional control of dominance for this gene. We discuss the implications for the evolutionary processes associated with the origin and maintenance of the dominance hierarchy among self-incompatibility alleles.

Keywords: Arabidopsis halleri; RT-qPCR; allele-specific expression assay; dominance/recessivity; sporophytic self-incompatibility.


Figures

Figure 1
Figure 1
Pairwise dominance interactions in pollen between the nine A. halleri S-alleles included in this study. Gray-shaded cells indicate pairwise dominance interactions inferred from phylogenetic classes rather than directly determined phenotypically. Star symbols indicate genotypes that were not available for the transcriptional analysis. Genotype S10S02 is shown in parentheses with a question mark to indicate that this dominance relationship is currently not known experimentally, and cannot be determined from the phylogeny because these two alleles belong to the same phylogenetic class (shown on the left side of the figure). The possibly unusual dominance interaction between S02 and S29 is indicated by the symbol “>=” (see text for details). Details of the crosses and references for the raw phenotypic data used in this figure are reported in Table S3.
Figure 2
Figure 2
Expression dynamics of (A) SCR and (B) SRK during flower development, from early buds (< 0.5 mm) to open flowers. For SCR, only genotypes in which a given allele was either dominant or codominant were included (recessive SCR alleles were strongly silenced at all stages and were therefore not informative here). All genotypes are shown for SRK. For each allele, 2−ΔCt values were normalized relative to the developmental stage with the highest expression. For each stage, the thick horizontal line represents the median, and the box represents the first and third quartiles. The upper whisker extends from the hinge to the largest value no further than 1.5 x interquartile range from the hinge (or distance between the first and third quartiles). The lower whisker extends from the hinge to the smallest value at most 1.5 x interquartile range of the hinge and the black dots represents outlier values.
Figure 3
Figure 3
Expression of individual SCR alleles in different genotypic contexts. Pollen dominance statuses of the S-allele whose expression is measured relative to the other allele in the genotype as determined by controlled crosses are represented by different letters (D: dominant; C: codominant; R: recessive; U: unknown; and H: Homozygote; Table S3). In a few instances, relative dominance statuses of the two alleles had not been resolved phenotypically and were inferred from the phylogeny (marked by asterisks). Thick horizontal bars represent the median of 2−ΔCt values, first and third quartiles are indicated by the upper and lower limits of the boxes. The upper whisker extends from the hinge to the largest value no further than 1.5 x interquartile range from the hinge (or distance between the first and third quartiles). The lower whisker extends from the hinge to the smallest value at most 1.5 x interquartile range of the hinge and the black dots represents outlier values. We normalized values relative to the highest median across heterozygous combinations within each panel. Alleles are ordered from left to right and from top to bottom according to their position along the dominance hierarchy, with SCR01 the most recessive and SCR13 and SCR20 the most dominant alleles. Under a model of transcriptional control of dominance, high expression is expected when a given allele is either dominant or codominant, and low expression when it is recessive. Exceptions to this model are marked by black vertical arrows and discussed in the text. “Na” marks genotypes that were not available.
Figure 4
Figure 4
Base-pairing requirements for the transcriptional control of SCR alleles by small RNAs (sRNAs) suggest a threshold model. (A) Relative expression of SCR alleles as a function of the alignment score of the “best” interaction between the focal allele (including 2 kb of sequence upstream and downstream of SCR) and the population of sRNAs produced by sRNA precursors of the other allele in the genotype. For each allele, expression was normalized relative to the genotype in which the 2−ΔCt value was highest. Dots are colored according to the dominance status of the focal SCR allele in each genotypic context (black: dominant; white: recessive; and gray: undetermined). The black line corresponds to a local regression obtained by a smooth function (loess function, span = 0.5) in the ggplot2 package (Wickham 2009) and the gray area covers the 95% C.I. Vertical arrows point to observations that do not fit the threshold model of transcriptional control and are represented individually on Figure 5. (B) Bar plot of the Akaike Information Criteria (AIC) quantifying the fit of the generalized linear model for different target alignment scores used to define functional targets. Lower AIC values indicate a better fit, indicating that a threshold score of 18 to define functional sRNA–target interactions provides the best explanatory power of the variation in SCR transcript levels in heterozygotes.
Figure 5
Figure 5
Predicted sRNA–target interactions that do not fit with the documented dominance phenotype or the measured expression. For each alignment, the sequence on top is the small RNA (sRNA) and the bottom sequence is the best predicted target site on the SCR gene sequence (including 2 kb of sequence upstream and downstream of SCR). (A) sRNA targets with a score > 18, while the S-allele producing the sRNA is phenotypically recessive over the S-allele containing the SCR sequence. (B) sRNA target with a score < 18, while the S-allele producing the sRNA (S04) is phenotypically dominant over the S-allele containing the SCR sequence and transcript levels of the SCR03 allele are accordingly very low. This is the best target we could identify on SCR03 for sRNAs produced by S04.

References

    1. Aalto A. P., and Pasquinelli A. E., 2012. Small non-coding RNAs mount a silent revolution in gene expression. Curr. Opin. Cell Biol. 24: 333–340. 10.1016/j.ceb.2012.03.006 - DOI - PMC - PubMed
    1. Allen E., Xie Z., Gustafson A. M., Sung G. H., Spatafora J. W. et al. , 2004. Evolution of microRNA genes by inverted duplication of target gene sequences in Arabidopsis thaliana. Nat. Genet. 36: 1282–1290. 10.1038/ng1478 - DOI - PubMed
    1. An Y. Q., McDowell J. M., Huang S., McKinney E. C., Chambliss S., et al. , 1996. Strong, constitutive expression of the Arabidopsis ACT2/ACT8 actin subclass in vegetative tissues. Plant J. 10: 107–121. 10.1046/j.1365-313x.1996.10010107.x - DOI - PubMed
    1. Axtell M. J., and Meyers B. C., 2018. Revisiting criteria for plant microRNA annotation in the era of big data. Plant Cell 30: 272–284. 10.1105/tpc.17.00851 - DOI - PMC - PubMed
    1. Bates D., Mächler M., Bolker B., and Walker S., 2014. Fitting linear mixed-effects models using lme4. J. Stat. Softw. 67: 1–48.

Publication types

Substances