. 2020 Jul 16;94(15):e00284-20.
doi: 10.1128/JVI.00284-20. Print 2020 Jul 16.

The Epstein-Barr Virus Major Tegument Protein BNRF1 Is a Common Target of Cytotoxic CD4+ T Cells

Affiliations

The Epstein-Barr Virus Major Tegument Protein BNRF1 Is a Common Target of Cytotoxic CD4+ T Cells

Dinesh Adhikary et al. J Virol. .

Abstract

Cellular immunotherapy is a proven approach against Epstein-Barr virus (EBV)-driven lymphoproliferation in recipients of hematopoietic stem cells. Extending the applicability and improving the response rates of such therapy demands improving the knowledge base. We studied 23 healthy donors for specific CD4+ T cell responses against the viral tegument protein BNRF1 and found such T cells in all seropositive donors, establishing BNRF1 as an important immune target in EBV. We identified 18 novel immune epitopes from BNRF1, all of them generated by natural processing of the full-length protein from virus-transformed lymphoblastoid cell lines (LCL). BNRF1-specific CD4+ T cells were measured directly ex vivo by a cytokine-based method, thus providing a tool to study the interaction between immunity and infection in health and disease. T cells of the cytotoxic Th1 type inhibited the proliferation of autologous LCL as well as virus-driven transformation. We infer that they are important in limiting reactivations to subclinical levels during health and reducing virus propagation during disease. The information obtained from this work will feed into data sets that are indispensable in the design of patient-tailored immunotherapeutic approaches, thereby enabling the stride toward broader application of T cell therapy and improving clinical response rates.IMPORTANCE Epstein-Barr virus is carried by most humans and can cause life-threatening diseases. Virus-specific T cells have been used in different clinical settings with variable success rates. One way to improve immunotherapy is to better suit T cell generation protocols to viral targets available in different diseases. BNRF1 is present in viral particles and therefore likely available as a target for T cells in diseases with virus amplification. Here, we studied healthy Epstein-Barr virus (EBV) carriers for BNRF1 immunogenicity and report our results indicating BNRF1 to be a dominant target of the EBV-specific CD4+ T cell response. BNRF1-specific CD4+ T cells were found to be cytotoxic and capable of limiting EBV-driven B cell transformation in vitro The findings of this work contribute to forwarding our understanding of host-virus interactions during health and disease and are expected to find direct application in the generation of specific T cells for immunotherapy.

Keywords: Epstein-Barr virus; T cells; antigen; cytotoxic CD4+; virion structure.


Figures

FIG 1
FIG 1
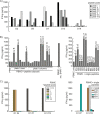
BNRF1-specific CD4+ T cells are present in the peripheral blood of EBV-seropositive individuals. (A) Expression of recombinant proteins. BZLF1, transaldolase, and BNRF1 were expressed as C-terminal 6 His-tagged proteins in HEK 293T cells and purified using Ni-NTA agarose beads. A sample of the eluate was loaded on a polyacrylamide gel, and Western blotting was performed using the anti-His antibody 3D5. Molecular masses (according to www.uniprot.org) were 142,844 Da for BNRF1, 26,860 Da for BZLF1, and 37,540 Da for transaldolase. (B) BNRF1-stimulated T cell lines from EBV-seropositive and EBV-seronegative donors. CD4+ T cell lines established by restimulations with protein-pulsed PBMC were tested against PBMC, either untreated or pulsed with BNRF1 or with the control protein BZLF1. The IFN-γ indices were calculated as cytokine concentration in supernatants of T cells responding to PBMC pulsed with either BNRF1 (black bars) or control protein BZLF1 (gray bars) divided each by that of T cells incubated with untreated PBMC. Shown are the IFN-γ indices for T cells from different donors after up to seven passages (indicated as D1p1 to D22p7 along the x axis). Representative assays are shown. D21 and D22 represent EBV-seronegative donors, and the remaining donors were seropositive. (C) BNRF1 specificity of T cell lines improves upon restimulation. The T cell lines were restimulated biweekly for at least seven rounds. The IFN-γ indices for BNRF1 are shown for the T cell lines from different donors (D1 to 22). Each data point depicts an IFN-γ index (y axis) for a given donor at a given passage number. The passage numbers are denoted on the x axis (p1 to p7). Representative assays are shown. D21 and D22 represent EBV-seronegative donors, while the remaining donors were seropositive. The T cell line from seropositive donor D1 showed specific responses as passage 1 and was thus not restimulated further. At some passages, some T cell lines could not be tested, due to a lack either of sufficient PBMC or of T cells.
FIG 2
FIG 2
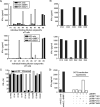
Identification of peptide epitopes targeted by BNRF1-specific CD4+ T cells. (A) BNRF1-specific T cell lines recognize pools of peptides derived from BNRF1. T cell lines shown here from five donors (D2, D6, D7, D13, and 19) were tested against seven peptide pools (I to VII), pools I to VI each with 47 unique peptides and pool VII with 45 unique peptides drawn out of a library of 327 15-mer synthetic peptides covering the entire amino acid length of BNRF1, with neighboring peptides overlapping by at least 11 amino acids. Autologous PBMC were used as antigen-presenting cells in these studies. Representative responses from five donors are shown. (B) Identification of individual target peptides recognized by BNRF1-specific T cells. A total of 20 peptide subpools (8 row subpools and 12 column subpools) were derived from each 96-well plate of peptides. Each peptide was present in one row subpool and one column subpool. Subpools relevant to the positive pool were tested in further T cell cytokine release assays using PBMC as antigen-presenting cells and responsive T cells as effectors. In the example depicted here, the T cell line from donor D11, which was found to be responsive to pools I and II, was tested against row (r) subpools and column (c) subpools from 96-well plate number 1 (left). Once positive subpools were identified, candidate single peptides were determined and subsequently tested (right), allowing the identification of single target peptides (19 to 95), which were further confirmed. (C) Identification of T cells recognizing adjacent peptides. Some T cell clones (shown for donor D1 clone 4) recognized two pools (pools II and III), which was found to be due to the recognition of two consecutive peptides (numbers 94 and 95) that were the last peptide in pool II and the first peptide in pool III, respectively. Some T cell clones responded against the same pool (lower-left panel, clones 7 and 12 from donor D1 both recognized pool I) but recognized different peptides in the pool. D1 clone 7 recognized peptide 21, and D1 clone 12 recognized peptides 19 and 20.
FIG 3
FIG 3
BNRF1-specific T cells can be detected ex vivo. CD8-depleted PBMC from 21 different donors (EBV-seropositive except for D21 and D29) were rested overnight, followed by exposure to BNRF1 or to the control protein transaldolase for 16 h on a precoated IFN-γ ELISPOT plate. ELISPOT assays were set up with three to four replicates of each condition. Background-subtracted mean counts of spot-forming units (SFU) per million cells along with the standard deviation (error bars) are shown. The mean of the number of spots in the absence of any antigen was considered background.
FIG 4
FIG 4
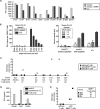
Characterization of polyclonal T cell lines and T cell clones. (A) BNRF1-pulsed PBMC-stimulated T cell lines contain BNRF1-specific as well as nonspecific T cells. Limiting dilution cloning yielded several outgrowing clones. Representative results for nine clones (1 to 9) each obtained from the line from donors D1 (top) and D12 (bottom) were tested in cytokine secretion assays against antigen-presenting cells (mini-LCL), either untreated or pulsed with BNRF1 or the control protein BZLF1. (B) Testing T cells against target cells with partly overlapping MHCII genotype of the donor allows identification or narrowing down of potential antigen-presenting molecules. T cell clones D14 no. 5 and D12 no. 3 were tested in cytokine secretion assays against BNRF1-pulsed mini-LCL from different donors (marked as D14 to D39 and D12 to D44 on the x axis) with known, partially overlapping MHCII profiles, allowing for the identification of the antigen-presenting molecule (top: DRB3*02:02) or for narrowing down the potential antigen-presenting molecules (bottom: DRB1*01:01 and DQB1*05:01). (C) Test for DP molecules as potential antigen-presenting molecules using an anti-DP blocking antibody. T cell clones (named along the x axis) were tested against matched BNRF1-pulsed target cells, either untreated or pretreated with an anti-human DP inhibitory antibody or with an IgG isotype-matched control antibody. Cytokine secretion in response to antibody-treated (anti-DP or control) target cells is shown as a percentage of cytokine secretion in response to untreated targets. (D) Test for antigen-presenting molecule using transfection of MHCII molecules in the transfection-permissive cell line DG75. For some T cell clones, the restriction element was identified by expressing single MHCII molecules using expression plasmids (p). In the example shown here, the EBV-negative Burkitt lymphoma cell line DG75 was transfected with expression plasmids coding for BNRF1 alone or along with another plasmid coding for the MHCII molecules DRB1*1301, DRB1*1501, DRB5*0101, or DQB1*0603. Transfected cells were tested for recognition by the T cell clone D37 no. 1. Mini-LCL, either untreated or pulsed with recombinant BNRF1, served as negative and positive controls. DRB5*0101 was identified as the molecule presenting BNRF1 to D37 no. 1 T cells.
FIG 5
FIG 5
Relative positions of CD4+ T cell epitopes in the reference BNRF1 protein sequence from B95.8 virus. The BNRF1 protein contained epitope sequences recognized by T cell lines from only one (red), two (bold green), or three (bold italic print face purple) donors. Where epitopes overlapped, amino acids common to both epitopes are shown in brown bold typeface.
FIG 6
FIG 6
BNRF1-specific CD4+ T cells are cytolytic. (A) Secretion of cytolytic molecules by BNRF1-specific T cells. T cell clones were tested for secretion of perforin (top) and granzyme B (bottom) in response to mini-LCL either unpulsed or pulsed with cognate or control peptide. The perforin (or granzyme B) index represents the perforin (or granzyme B) concentration in supernatants of T cells in response to cognate (black) or control (gray) peptide in relation to that of untreated T cells. The x axis depicts the donor number along with the T cell clone number. (B) Specific lysis of antigen-presenting target cells by BNRF1-specific T cells. T cell clones D25 no. 8 (top) and D23 no. 1 (bottom) were tested for their cytolytic potential in Calcein-AM cytotoxicity assays using mini-LCL pulsed with the cognate peptide or a control peptide as target cells. Peptide-pulsed mini-LCL were labeled with Calcein-AM dye and then brought out with T cells at different effector-to-target ratios as marked on the x axis.
FIG 7
FIG 7
BNRF1-specific CD4+ T cells inhibit EBV-driven proliferation and transformation. (A) BNRF1-specific CD4+ T cells recognize EBV-transformed B cells that are permissive to lytic replication. T cell clones were tested in IFN-γ secretion assays against autologous mini-LCL, mini-LCL pulsed with recombinant BNRF1, or LCL. (B) BNRF1-specific T cells recognize unmanipulated EBV-transformed B cells and can efficiently kill them. (Left) T cell clones (10,000 cells per well) were tested in IFN-γ ELISPOT assays against autologous mini-LCL or LCL brought out in serial dilutions starting at 2,500 target cells per well. (Right) T cells at different T cell-to-target ratios were used to assess cytolytic activity in 4-h cytotoxicity assays using untreated or peptide-pulsed autologous mini-LCL and untreated LCL as targets. (C) BNRF1-specific T cells restrict the proliferation of EBV-transformed LCL but not mini-LCL. Autologous LCL or mini-LCL (target cells) were plated in serial dilutions from 10,000 to 30 cells per well in round-bottom 96-well plates, in four replicas, with or without T cells (10,000 per well). In all cases CD4+ BNRF1-specific T cells (BNRF1 T cells) were used, except for donor D23, where in addition to BNRF1-specific T cells, an influenza M1-specific CD4+ T cell clone (M1 T cells) was available from the same donor and was therefore also included as a control T cell clone. After a month, the plate was inspected for proliferation of mini-LCL or LCL, and wells with target outgrowths in the absence and presence of T cells were noted. The results are expressed as ratios of the number of input target cells that led to outgrowth in the presence of T cells to the number of input target cells that led to outgrowth in the absence of T cells. (D) Donor-derived spontaneous LCL efficiently present antigen to BNRF1-specific CD4+ T cells. BNRF1-specific CD4+ T cell clones from donors D25, D1, and D23 were tested for responses against autologous spontaneous LCL. The corresponding mini-LCL served as controls. (E) BNRF1-specific CD4+ T cells inhibit EBV-driven transformation of primary B cells. Magnetically sorted CD19+ PBMC from three donors (D6, D23, D24) were exposed to B95.8 virus for 2 h and then brought out in serial dilutions from 10,000 to 10 cells per well in 96-well plates in two different conditions, either with or without BNRF1-specific T cells (10,000 per well), with each condition in four replicates. After 4 weeks, the plate was monitored for B cell transformation by microscopy. Shown in the figure are the fold input cell numbers that led to transformation. The number of B cells that led to a transformed proliferating culture when plated without T cells was taken as fold 1.

Similar articles

Cited by

References

    1. IARC. 2012. A review of human carcinogens. Part B: biological agents, vol 100 B, p 475 International Agency for Research on Cancer, Lyon, France.
    1. Taylor GS, Long HM, Brooks JM, Rickinson AB, Hislop AD. 2015. The immunology of Epstein-Barr virus-induced disease. Annu Rev Immunol 33:787–821. doi:10.1146/annurev-immunol-032414-112326. - DOI - PubMed
    1. Rooney CM, Smith CA, Ng CY, Loftin S, Li C, Krance RA, Brenner MK, Heslop HE. 1995. Use of gene-modified virus-specific T lymphocytes to control Epstein-Barr-virus-related lymphoproliferation. Lancet 345:9–13. doi:10.1016/s0140-6736(95)91150-2. - DOI - PubMed
    1. Kang MS, Kieff E. 2015. Epstein-Barr virus latent genes. Exp Mol Med 47:e131. doi:10.1038/emm.2014.84. - DOI - PMC - PubMed
    1. Rickinson AB, Moss DJ. 1997. Human cytotoxic T lymphocyte responses to Epstein-Barr virus infection. Annu Rev Immunol 15:405–431. doi:10.1146/annurev.immunol.15.1.405. - DOI - PubMed

Substances