. 2020 May 27;12(545):eaaz7773.
doi: 10.1126/scitranslmed.aaz7773.

Functional role of kallikrein 5 and proteinase-activated receptor 2 in eosinophilic esophagitis

Affiliations

Functional role of kallikrein 5 and proteinase-activated receptor 2 in eosinophilic esophagitis

Nurit P Azouz et al. Sci Transl Med. .

Abstract

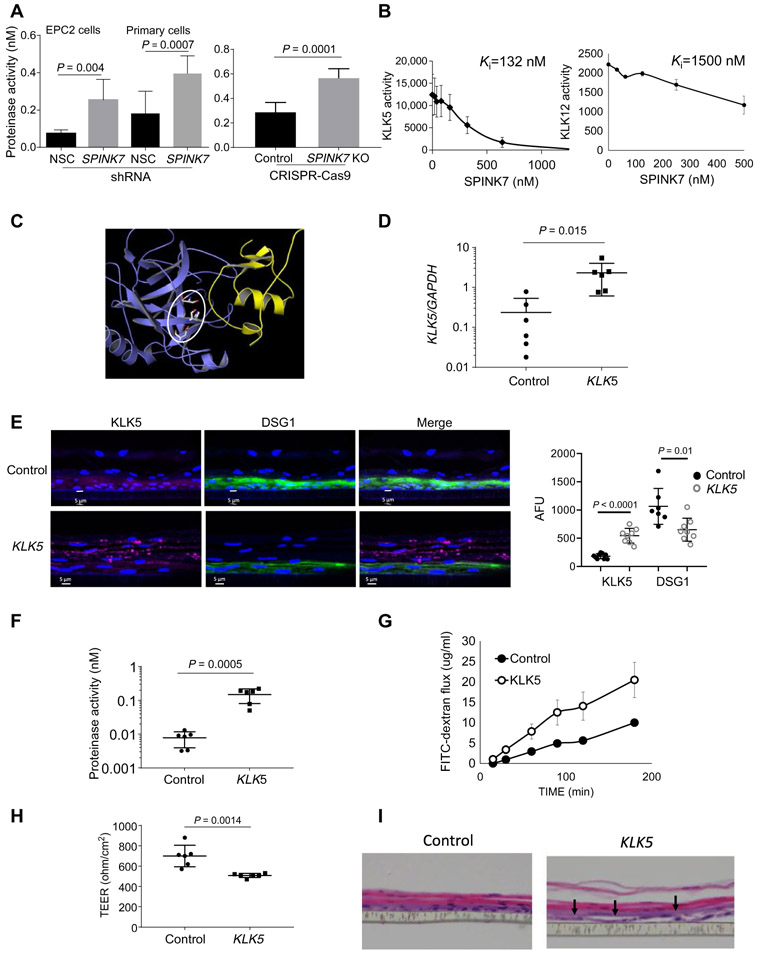
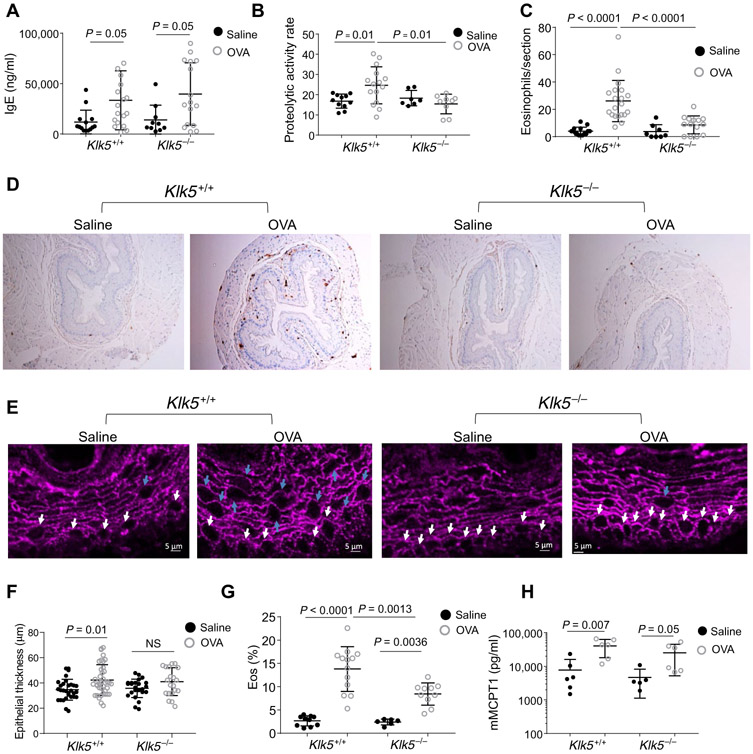
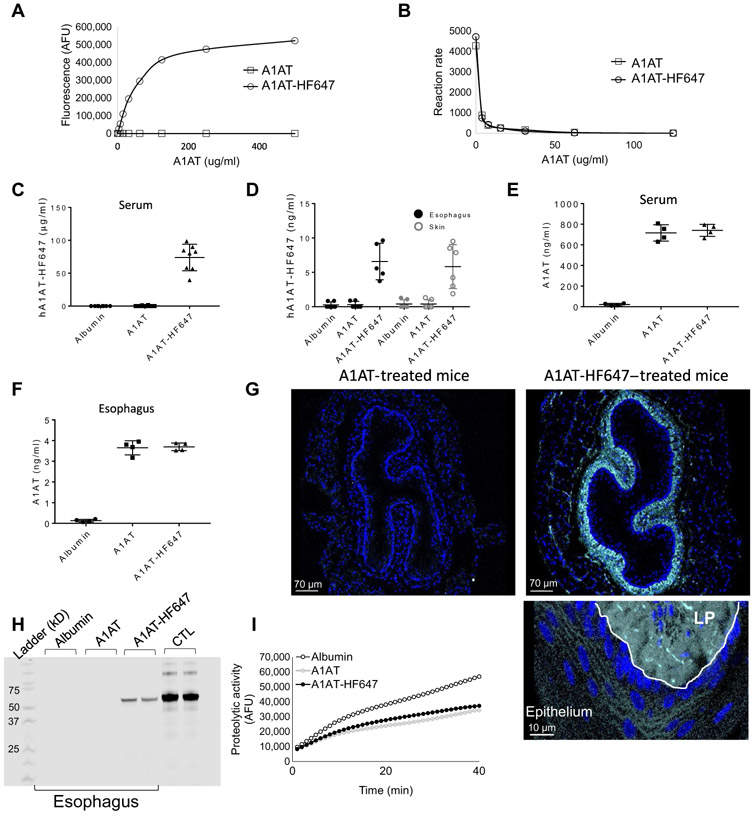
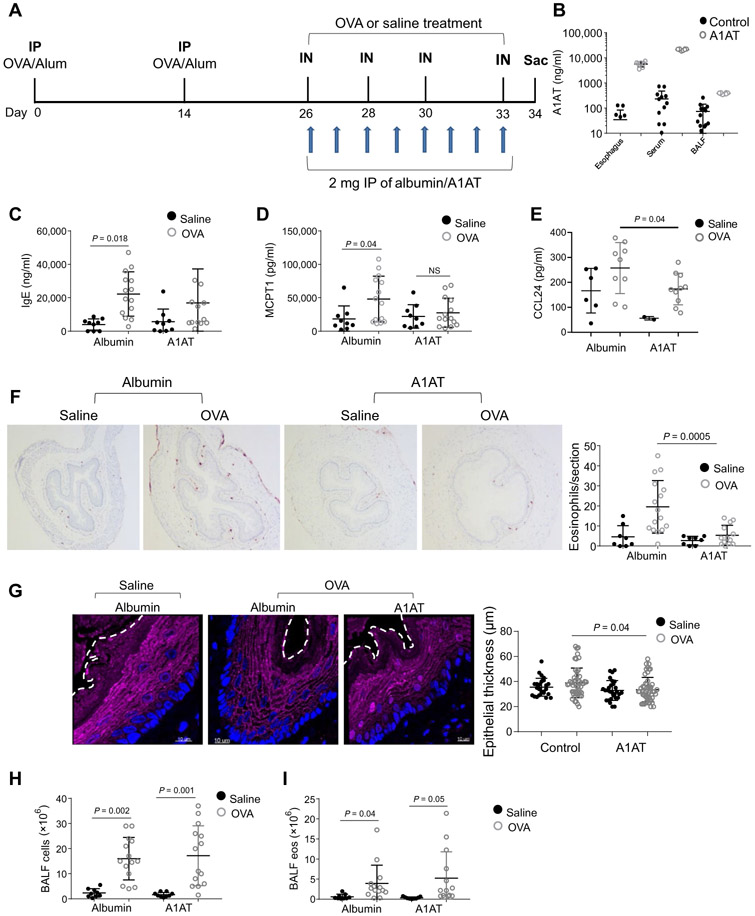
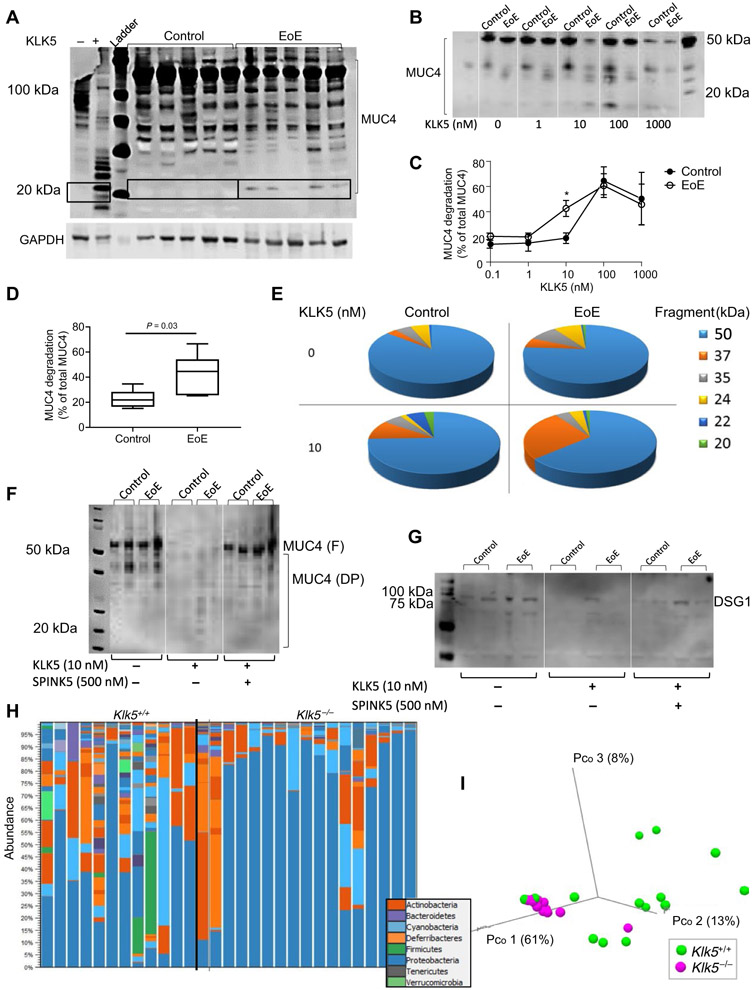
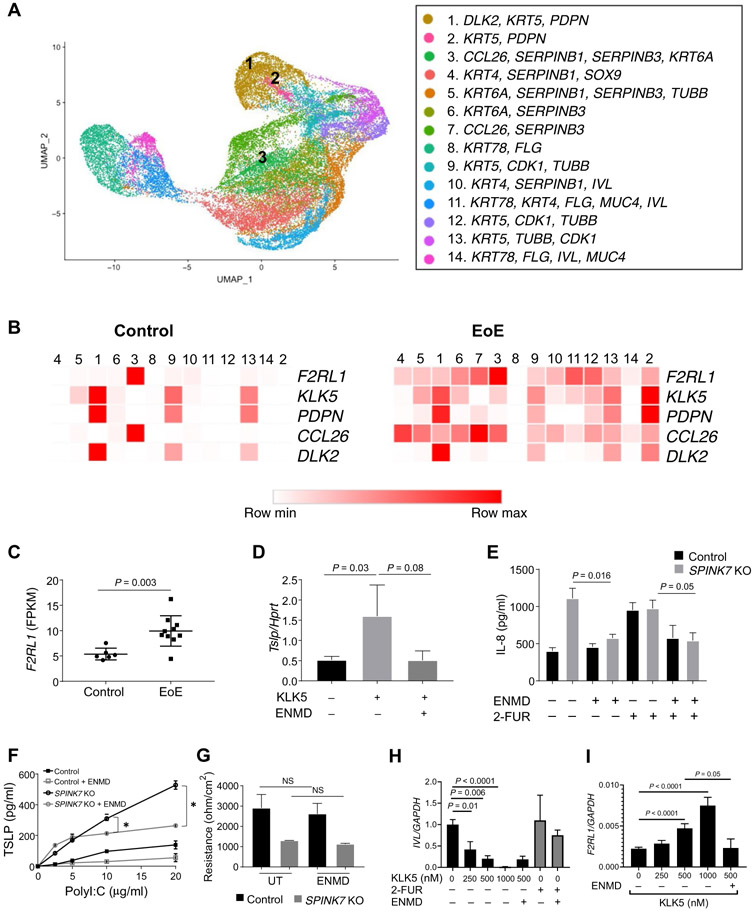
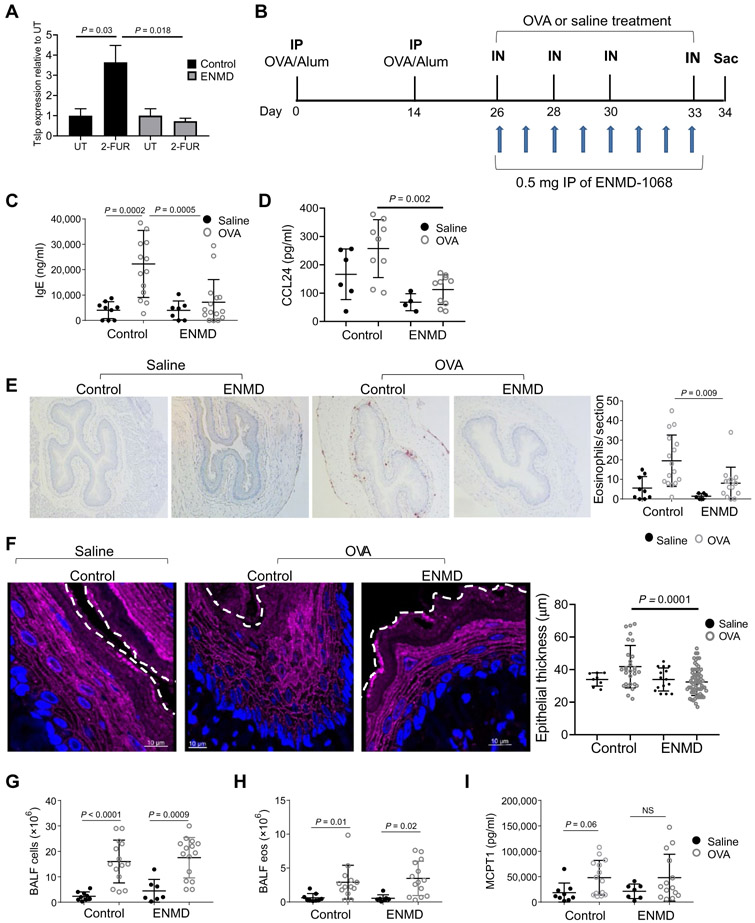
Eosinophilic esophagitis (EoE) is a chronic, food antigen-driven, inflammatory disease of the esophagus and is associated with impaired barrier function. Evidence is emerging that loss of esophageal expression of the serine peptidase inhibitor, kazal type 7 (SPINK7), is an upstream event in EoE pathogenesis. Here, we provide evidence that loss of SPINK7 mediates its pro-EoE effects via kallikrein 5 (KLK5) and its substrate, protease-activated receptor 2 (PAR2). Overexpression of KLK5 in differentiated esophageal epithelial cells recapitulated the effect of SPINK7 gene silencing, including barrier impairment and loss of desmoglein-1 expression. Conversely, KLK5 deficiency attenuated allergen-induced esophageal protease activity, modified commensal microbiome composition, and attenuated eosinophilia in a murine model of EoE. Inhibition of PAR2 blunted the cytokine production associated with loss of SPINK7 in epithelial cells and attenuated the allergen-induced esophageal eosinophilia in vivo. Clinical samples substantiated dysregulated PAR2 expression in the esophagus of patients with EoE, and delivery of the clinically approved drug α1 antitrypsin (A1AT, a protease inhibitor) inhibited experimental EoE. These findings demonstrate a role for the balance between KLK5 and protease inhibitors in the esophagus and highlight EoE as a protease-mediated disease. We suggest that antagonizing KLK5 and/or PAR2 has potential to be therapeutic for EoE.


Figures

Fig. 1.
Fig. 1.. Identification of SPINK7 targets and their function.
(A) Quantification of trypsin-like activity in supernatants derived from differentiated nonsilencing control (NSC) shRNA– or SPINK7 shRNA–treated EPC2 cells or primary esophageal cells or from control or CRISPR-Cas9 SPINK7 knockout (KO) EPC2 cells. Protease activity was quantitated by comparison to the activity of serial dilutions of KLK5. P values of SPINK7-depleted cells compared with control cells were calculated by t test (unpaired, two-tailed). Data shown from three independent experiments performed in triplicates. (B) KLK5 or KLK12 were incubated with their substrates and a wide range of doses of SPINK7. The proteolytic rate for each dose of SPINK7 was calculated. Results are the means ± SD. Values of inhibition constants (Ki) were calculated according to the Morrison equation (65). Data shown from three independent experiments performed in duplicates. (C) Docking results of SPINK7 (yellow), KLK5 (blue), and the catalytic triad of KLK5 in gray lines (circled) obtained from ClusPro (https://cluspro.bu.edu). The PDB files for SPINK7 (PDBID:2LEO chain A) and KLK5 (PDBID:2PSX chain A) were used with the default ClusPro settings. This represents the top result with balanced weighting. The images were generated with the program PyMOL (66). (D) Quantitative polymerase chain reaction analysis of KLK5 expression in the plasmid PLX304 (control) and KLK5-PLX304–transfected cells after lentivirus transduction. (E) Immunofluorescence of KLK5 (magenta) and desmoglein-1 (DSG1) (green) in PLX304 (control) and KLK5-PLX304–transfected EPC2 cells after differentiation. The graph on the right represents the mean fluorescent intensity of KLK5 and DSG1 in control and KLK5-overexpressing cells. Each dot represents the mean fluorescent intensity of one section. (F) Quantification of trypsin-like activity in supernatants derived from differentiated control or KLK5-overexpressing EPC2 cells. (G) A representative FITC-dextran flux that was measured at day 14 of air-liquid interface (ALI) differentiation from control and KLK5-overexpressing EPC2 cells at the indicated time points. (H) Transepithelial electrical resistance (TEER; ohm/cm2) measurement from control and KLK5-overexpressing EPC2 cells at day 9 of ALI differentiation. (I) Hematoxylin and eosin–stained sections of control or KLK5-overexpressing EPC2 cells after ALI differentiation (day 14). Arrows point to intercellular dilated spaces. Data in (A), (B), and (G) are the means ± SD (n ≥ 3). P values of KLK5 overexpressing cells compared with control cells in (D) to (H) were calculated by t test (unpaired, two-tailed). Data shown in (D) to (H) derived from three independent experiments performed in duplicates (D to H).
Fig. 2.
Fig. 2.. The effect of klk5 gene deletion on esophageal eosinophilia in murine experimental EoE.
(A) IgE concentration in the serum of the mice after induction of allergic inflammation. (B) Proteolytic activity in the esophagus after allergen challenge. (C) Quantification of eosinophils in the esophagus; data shown are the number of eosinophils per section. (D) Representative images of anti-MBP staining of esophageal sections after allergen challenge. (E) Immunofluorescence staining of murine esophageal sections after allergen challenge. For DSG1 (magenta), representative images of four sections from at least six different mice in each treatment group are presented. White arrows denote round (cuboidal) epithelial cells in the basal layer. Blue arrows denote round (cuboidal) epithelial cells in the suprabasal epithelium. (F) Quantification of esophageal epithelial thickness; data shown are the thickness of the epithelium from the basal cells to the lumen in different areas of the sections from at least six mice in each treatment from two independent experiments. NS, not significant. (G) Percent of eosinophils (Eos; % of circulating white blood cells) as determined by flow cytometry of SiglecF+ and CD11b+ cells in the blood after red blood cell lysis. (H) MCPT1 concentration in the serum of the mice after allergen challenge. Each data point represents a value from a single mouse from three independent experiments with at least three mice per group. Mean values are indicated by a horizontal line; error bars represent SD. P values in (A) to (C) and (F) to (H) were calculated by two-way ANOVA with multiple comparisons.
Fig. 3.
Fig. 3.. A1AT delivery to the esophagus.
(A) Arbitrary fluorescence unit (AFU) measurements of different concentrations of A1AT and A1AT-HF647. Fluorescent signal was measured by the far-red filter (excitation, 625 nm; emission, 660 to 720 nm) that corresponds to the wavelength of HF647. (B) Measurements of trypsin activity using FITC-casein substrate at the indicated concentrations of A1AT or A1AT-HF647. The proteolytic activity for each concentration of A1AT or A1AT-HF647 was calculated by the average increase in fluorescent intensity per 1 min after serial of 30 measurements in 1-min intervals for a total time of 30 min. (C to I) Mice were intraperitoneally injected twice with 1 mg of human serum albumin or A1AT or A1AT-HF647 for two consecutive days. Twenty-four hours after the last injection, fluorescence in the serum (C) or protein lysates from the esophagus and skin (D) were measured. Concentrations of A1AT were calculated per 1 ml of serum or 1 mg of tissue using serial dilutions of A1AT-HF647. A1AT concentration in the serum (E) and esophageal protein lysates (F) were measured by a human A1AT ELISA. (G) Representative images of esophageal sections from mice that were injected with A1AT or A1AT-HF647. HF647 is shown in cyan, and nuclei are marked in blue by 4′,6-diamidino-2-phenylindole (DAPI). White line separates the LP from the epithelium. (H) After two intraperitoneal injections (1 mg) of albumin, A1AT, or AIAT-HF647, esophageal lysates were electrophoresed in a polyacrylamide gel; 100 ng of A1AT-HF647 was a positive control (CTL). HF647 fluorescence was visualized using ImageStudio software. (I) Proteolytic activity measurement of esophageal protein lysates after two intraperitoneal injections of albumin, A1AT, or AIAT-HF647 (1 mg each) using the substrate BOC-VPR-AMC and 5 nM recombinant human KLK5. Data in (C) to (F) are presented as means ± SD, with data points representing individual mice from three independent experiments with at least two mice per group.
Fig. 4.
Fig. 4.. The effect of A1AT delivery on experimental EoE.
(A) Schematic representations of the EoE model and A1AT or control albumin administration. IP, intraperitoneal injections; IN, intranasal challenges. (B) A1AT concentration in the esophagus, skin, and BALF. A1AT concentrations were determined using a human A1AT ELISA of 1 mg of tissue or 1 ml of BALF. (C) IgE concentration in the serum. (D) MCPT1 concentration in the serum. (E) CCL24 concentration in the esophagus of mice after induction of allergic inflammation. (F) Representative images of anti-MBP staining in esophageal sections after induction of allergic inflammation. In the right graph, a quantification of eosinophils per section of the esophagus is given. (G) Immunofluorescence staining of murine esophageal sections after allergen-induced EoE model for DSG1 (magenta) and DAPI-stained nuclei (blue); representative images of four sections from six different mice in each treatment group are presented. The white dashed line highlights the boundary between the epithelium and the lumen. In the right graph, each dot represents the thickness of the epithelium in a specific section of the esophagus. (H) Quantification of cell number in the BALF after induction of allergic inflammation. (I) Quantification of eosinophil (eos) number in the BALF after induction of allergic inflammation. In (B) to (H), each data point represents a value from a single mouse from three independent experiments, and means ± SD are indicated by horizontal lines. P values in (C) to (I) were calculated by two-way ANOVA with multiple comparisons. Data in (B) to (I) derived from three independent experiments with at least three mice per group.
Fig. 5.
Fig. 5.. The effect of KLK5 activity on mucin and DSG1 processing and microbiome homeostasis.
(A) MUC4 protein expression in esophageal biopsies. A representative image of 5 EoE samples and 5 control samples of 11 EoE samples and 10 control samples. The first two lanes from the left represent MUC4 expression from an EoE biopsy that was not treated with protease inhibitor cocktail and incubated at 37°C for 20 hours with recombinant KLK5 (1 μm) (+) or control buffer (−). The right lanes represent MUC4 protein expression in EoE biopsies compared to control biopsies that were treated with protease inhibitor cocktail during protein extraction. (B) Representative image of MUC4 expression in EoE and control biopsies after 20 hours of incubation with the indicated concentrations of recombinant KLK5 at 37°C and in the absence of protease inhibitor cocktail. (C) Quantitative analysis of MUC4 degradation in esophageal biopsies with the indicated concentrations of recombinant KLK5. Results are the means ± SD of three control and three EoE biopsies. *P < 0.05 according to t test (unpaired, two-tailed). (D) Quantitative analysis of the percent of MUC4 degradation from total MUC4. P value was calculated according to t test (unpaired, two-tailed). (E) Percentage of all cleavage bands after 20 hours of incubation at 37°C with or without recombinant KLK5 (10 nM) in the absence of protease inhibitor cocktail from seven control and seven EoE esophageal biopsies. (F) Western blot analysis of MUC4 or (G) DSG1 degradation in esophageal biopsies after 20 hours of incubation at 37°C with or without recombinant KLK5 (10 nM) and with or without SPINK5 (500 nM) in the absence of protease inhibitor cocktail. Degradation products are marked (DP) and full-length protein are marked (F). (H) 16S sequence analysis of phylum abundance of Klk5+/+ and Klk5−/− in the esophagus. (I) Variability analysis of the microbiome of Klk5+/+ and Klk5−/− in the esophagus according to a PERMANOVA weighted test. Each data point represents one mouse. Results are from three independent experiments with at least four mice in each group.
Fig. 6.
Fig. 6.. KLK5 and PAR2 expression and function.
(A) Uniform manifold approximation and projection (UMAP) plot displaying single cells, colored by shared nearest neighbor clusters and cell types. (B) Heat maps represent the expression of the indicated genes in epithelial clusters based on single-cell RNA sequencing data of dispersed cells from esophageal EoE biopsies and control biopsies. Data derived from two control and five EoE biopsies and total of 47,141 cells. (C) Fragments per kilobase of transcript per million (FPKM) values for F2LR1 determined from bulk RNA sequencing of esophageal biopsies [n = 6 control patients (Control) and n = 10 patients with active EoE (EoE)]. Mean values are indicated by a horizontal line; error bars represent SD, with each circle or square representing an individual. (D) Tslp expression was examined in murine esophageal explants that were either untreated or treated with KLK5 (800 nM) in the presence or absence of ENMD-1068 (1 mM). Data represent as the means ± SD from three independent experiments. (E) IL-8 protein expression in supernatants from control or SPINK7-KO EPC2 cells that were differentiated in ALI culture (day 14). Cells were treated with either ENMD-1068 (500 μM), 2-FUR (1 μM), or ENMD-1068 (500 μM) 30 min before 2-FUR (1 μM) on day 9 and day 12 of differentiation. P values were calculated by two-way ANOVA with multiple comparisons from four independent experiments performed in duplicates. (F) TSLP release from control or SPINK7-KO EPC2 cells that were grown in high-calcium media and high confluency for 64 hours and then stimulated for 8 hours with the indicated concentrations of polyI:C with or without ENMD (1 mM). Cell supernatants were assessed for TSLP concentrations from three independent experiments performed in duplicates. Data are means ± SD. (G) TEER (ohm/cm2) measurement from EPC2 cells at day 12 of ALI differentiation. After the final 48 hours, cells were either left untreated (UT) or treated with ENMD-1068 (500 μM). Data from three independent experiments performed in triplicates. (H) IVL mRNA expression in EPC2 cells that were grown in high-calcium media and high confluency (250,000 cells per well) for 48 hours and then stimulated for 18 hours with the indicated concentrations of KLK5 or 2-FUR (1 μM) with or without ENMD-1068 (500 μM). (I) F2RL1 mRNA expression in EPC2 cells that were grown in high-calcium media and high confluency (250,000 cells per well) for 48 hours and then stimulated for 18 hours with the indicated concentrations of KLK5 with or without ENMD-1068 (500 μM). Data in (H) and (I) are from three independent experiments performed in triplicates. (D) to (I) represent the mean values, and error bars represent SD. P values in (C) and (F) to (I) were calculated by t test (unpaired, two-tailed).
Fig. 7.
Fig. 7.. The effect of selective inhibition of PAR2 on experimental EoE.
(A) Tslp mRNA expression was examined in murine esophageal explants that were taken from mice that were intraperitoneally injected twice with 0.5 mg of ENMD-1068 or saline. Esophageal explants were either untreated or treated with 2-FUR (2 μM) for 6 hours at 37°C. Data represented as the mean values of three independent experiments; error bars represent SD. P values was calculated by t test (unpaired, two-tailed). (B) Schematic representation of the EoE model and PAR2 antagonist administration. (C) IgE concentration in the serum and (D) CCL24 concentration in esophageal protein lysates after induction of allergic inflammation. (E) Representative image of anti-MBP staining in esophageal sections after induction of allergic inflammation. The graph on the right shows the quantification of MBP+ eosinophils per field in the esophagus. (F) Immunofluorescence staining of murine esophageal sections after induction of allergic inflammation for DSG1 (magenta) and DAPI-stained nuclei (blue); representative images of four sections from six different mice in each treatment group are presented. The white dashed line represents the boundary between the epithelium and the lumen. In the right graph, each dot in the graph represents the thickness of the epithelium in a specific section of the esophagus. (G) Quantification of total cell number in the BALF after induction of allergic inflammation. (H) Quantification of eosinophil numbers in the BALF after induction of allergic inflammation. (I) MCPT1 concentration in the serum of the mice after allergen and saline challenge. In (C) to (I), mean values are indicated by a horizontal line when A each circle represents data point from one mouse; error bars represent SD. P values in (A) and (C) to (I) were calculated by two-way ANOVA with multiple comparisons. Data derived from three independent experiments with at least three mice in each group.

Similar articles

Cited by

References

    1. Davis BP, Rothenberg ME, Mechanisms of disease of eosinophilic esophagitis. Annu. Rev. Pathol 11, 365–393 (2016). - PMC - PubMed
    1. O'Shea KM, Aceves SS, Dellon ES, Gupta SK, Spergel JM, Furuta GT, Rothenberg ME, Pathophysiology of eosinophilic esophagitis. Gastroenterology 154, 333–345 (2018). - PMC - PubMed
    1. Dellon ES, Liacouras CA, Molina-Infante J, Furuta GT, Spergel JM, Zevit N, Spechler SJ, Attwood SE, Straumann A, Aceves SS, Alexander JA, Atkins D, Arva NC, Blanchard C, Bonis PA, Book WM, Capocelli KE, Chehade M, Cheng E, Collins MH, Davis CM, Dias JA, Di Lorenzo C, Dohil R, Dupont C, Falk GW, Ferreira CT, Fox A, Gonsalves NP, Gupta SK, Katzka DA, Kinoshita Y, Menard-Katcher C, Kodroff E, Metz DC, Miehlke S, Muir AB, Mukkada VA, Murch S, Nurko S, Ohtsuka Y, Orel R, Papadopoulou A, Peterson KA, Philpott H, Putnam PE, Richter JE, Rosen R, Rothenberg ME, Schoepfer A, Scott MM, Shah N, Sheikh J, Souza RF, Strobel MJ, Talley NJ, Vaezi MF, Vandenplas Y, Vieira MC, Walker MM, Wechsler JB, Wershil BK, Wen T, Yang GY, Hirano I, Bredenoord AJ, Updated international consensus diagnostic criteria for eosinophilic esophagitis: Proceedings of the AGREE conference. Gastroenterology 155, 1022–1033.e10 (2018). - PMC - PubMed
    1. Molina-Infante J, Gonzalez-Cordero PL, Arias A, Lucendo AJ, Update on dietary therapy for eosinophilic esophagitis in children and adults. Expert Rev. Gastroenterol. Hepatol 11, 115–123 (2017). - PubMed
    1. Rochman M, Travers J, Miracle CE, Bedard MC, Wen T, Azouz NP, Caldwell JM, Kc K, Sherrill JD, Davis BP, Rymer JK, Kaufman KM, Aronow BJ, Rothenberg ME, Profound loss of esophageal tissue differentiation in patients with eosinophilic esophagitis. J. Allergy Clin. Immunol 140, 738–749.e3 (2017). - PMC - PubMed

Publication types